
Articles
- Page Path
- HOME > Osong Public Health Res Perspect > Volume 10(2); 2019 > Article
-
Original Article
Comparison of Foot Structure, Function, Plantar Pressure and Balance Ability According to the Body Mass Index of Young Adults - Se-Yeon Parka, Du-Jin Parkb
-
Osong Public Health and Research Perspectives 2019;10(2):102-107.
DOI: https://doi.org/10.24171/j.phrp.2019.10.2.09
Published online: April 30, 2019
aDepartment of Physical Therapy, Kaya University, Korea
bDepartment of Physical Therapy, College of Health Sciences, Catholic University of Pusan, Korea
- *Corresponding author: Du-Jin Park, Department of Physical Therapy, College of Health Sciences, Catholic University of Pusan, Korea, E-mail addresses: djpark35@cup.ac.kr
• Received: November 3, 2018 • Revised: March 19, 2019 • Accepted: March 21, 2019
Copyright ©2019, Korea Centers for Disease Control and Prevention
This is an open access article under the CC BY-NC-ND license (http://creativecommons.org/licenses/by-nc-nd/4.0/).
Abstract
-
Objectives
- This study compared foot arch height, plantar fascia thickness, a range of motion assessments of the ankle joint, strength of the ankle joint, plantar pressure, and balance between obese and normal weight young adults.
-
Methods
- Fifty-two participants were required for the present study design to achieve 80% power, 0.8 effect size (η2), and an alpha level of 0.05. The participants were categorized to normal weight or obese groups based on BMI (≤ 24 kg/m2 and ≥ 25 kg/m2, respectively). The foot and ankle disability index and Sport survey were completed by the participants before the measurements. Foot arch height was measured using the navicular drop test, and plantar fascia thickness was measured using ultrasound. Plantar pressure and balance tests were also conducted, followed by ankle joint range of motion and strength tests.
-
Results
- Foot arch height and plantar fascia thickness was significantly higher in the obese group compared with the normal weight group (p < 0.01). There were significant differences in eversion of ankle strength, plantar pressure in the big toe and heel and anterior-posterior balance between normal and obese weight groups (p < 0.05).
-
Conclusion
- Obese young adults had more abnormalities in the medial longitudinal arch, plantar fascia, and plantar pressure as well as weakened ankle eversion strength and balance problems compared with the normal weight group.
- Obesity is a serious public health issue that has been gradually increasing in all age ranges. The World Health Organization has recognized its severity, and has declared that obesity is an epidemic of the 21st century [1]. Obesity is a severe disease which adversely impacts mortality by increasing the risk of chronic diseases such as cardiovascular disease, hypertension, and diabetes [2,3]. Furthermore, obesity lowers the quality of life, and can negatively affect psychosocial mental health [4]. Medical problems related to obesity carry a heavy financial cost which has major impacts on national budgets.
- In the USA and the United Kingdom, obese individuals have 30% more spent on medical costs than individuals of normal weight [5]. In previous studies in the middle aged and elderly in USA, it was shown that obese individuals had a larger socioeconomic cost than normal weight individuals and the cost increases even more in morbidly obese cases [6,7]. In Korea, the obesity rate is trending similarly, and the National Health Insurance Service has announced that medical costs related to obesity increased by 40.49% from 2007 to 2011 [8]. Recent studies have shown that individuals with a body mass index (BMI) of 25 kg/m2 or higher, had a significantly higher probability of using medical services than individuals with a normal BMI, and their medical costs also increased 10% in 2011 to 2012 [9].
- In Korea, changes in diets and living environments have caused obesity to steadily increase, resulting in a corresponding impact on escalating medical costs. There is currently no systematic countermeasure for this increase in obesity, indicating that the government needs to implement an obesity prevention and management program at a national level [9]. Previous studies on obesity have focused on corrective restrictions on daily life activities caused by osteoporosis, weight loss, surgery, lumbago, ambulatory disabilities, and weakened lower limbs [10,11]. However, no studies have analyzed foot structure and its changes in function in obese individuals.
- The feet are constantly exposed to weight-bearing strains in obese individuals During normal gait, the weight in the feet is approximately 1.2 times the body weight and increases to 2–3 times the body weight when running [12,13]. In obese individuals, weight bearing on the medial longitudinal arch is approximately 3 times greater than it is in normal weight individuals [14], which can cause negative biodynamic changes that may potentially decrease the quality of life, and restrict physical activity [10,15]. Furthermore, decreased physical activity can lead to weakened muscle strength due to restricted motion [16].
- Excessive weight-bearing on feet due to obesity causes abnormal structural and functional changes in the foot. Furthermore, it results in decreased physical activity and weakened muscles, and leads to a series of unfortunate symptoms. These complications may increase socioeconomic costs related to obesity, and hence, preventing obesity is important. Recent studies on flat feet showed the importance of investigating the pathophysiology of plantar fasciitis and abnormalities of the feet in obese female adults [17]. In this study, the foot arch height, plantar fascia thickness, range of motion of the ankle joint, strength of the ankle joint, plantar pressure, and balance were analyzed to compare obese and normal weight young adults.
Introduction
- 1. Participants
- There were 52 adults in their 20s who participated in this study: 26 with a BMI of ≤ 24 kg/m2 and 26 with a BMI of ≥ 25 kg/m2. In Korea, the standard of obesity is BMI of ≥ 25 kg/m2. The participant pool was analyzed using G-Power analysis, and the effect size, power, and significance were set at 0.8, 0.8, and α = 0.05, respectively. Classification of normal weight and obesity was performed according to Asian BMI [18]. To accurately measure the participants’ BMI, an impedance body composition analyzer (Inbody 230, Inbody Inc., Korea) was used. The study procedure was fully explained to those who agreed to participate in the study. Participants with a history of foot diseases or surgical history, and those who were currently undergoing obesity-related interventions were excluded. This study was approved by the Kaya University Institutional Review Board (approval no.: 20180203) and was undertaken with the consent of the individuals in this study.
- 2. Measurements
- To measure foot arch height, a functional navicular drop test was performed. With the participant sitting on a chair and their feet placed on the floor (without bearing weight), the distance between the floor and the navicular tuberosity was measured. The distance between the floor and the navicular tuberosity was then measured while the participant was standing, weight bearing on both feet. The 2 measurements were compared and a difference of 10 mm or more indicated flat feet [19].
- An ultrasound device (Prosound 2, Hitachi Aloka Medical, Japan) was used to measure the thickness of the plantar fascia. A 6–13 MHz linear probe was used and the measurement was taken while the participant was in a prone position with the ankle joint at a 90° angle. The probe was placed vertically on the medial aspect of the calcaneal tuberosity, and the plantar fascia thickness was measured [20].
- A Tekscan pressure mapping tool (Tekscan pressure mapping tool, Tekscan Inc., USA) was used to determine the distribution of plantar pressure and the changes in the center of mass. Plantar pressure was measured for 5 seconds while the participant was comfortably standing on the pressure mapping tool. The measurements were recorded by video. The image of the foot was divided into 3 identical cells: big toe, little toe, and heel. Excluding the first second and the last second, the mean values of the measurements recorded in the middle 3 seconds were used (Figure 1). Balance was assessed by having the participants stand on the pressure mapping tool on their dominant foot for 10 seconds. Excluding the first and the last 2 seconds, the measurements of the middle 6 seconds were used to evaluate changes in the center of pressure.
- The participants were asked to maintain a supine position with the ankle joint in a neutral position. The degree of dorsiflexion on the ankle joints was measured and the degree of their plantar flexion was measured in the same position [21]. Ankle joint strength was evaluated through dorsiflexion, plantar flexion, inversion, and eversion. The ankle joint strength test was conducted using the guidelines provided by Hislop et al [22] and a Commander muscle tester (Commander muscle tester, JTECH Medical Inc., USA) was used for the measurements.
- The FADI is composed of 26 categories related to daily activities. Each category is scored from 0 to 4 points. The FADI sports evaluation can also be used to evaluate foot and ankle disability. FADI-Sport is composed of 8 categories related to sports activities with a score range also from 0 to 4 points. The measurement confidence levels of FADI and FADI-Sport are outstanding at 0.89 and 0.84, respectively [23].
- 3. Procedure
- In this study, the participants were divided into normal weight and obese groups based on a BMI of ≤ 24 kg/m2 and ≥ 25 kg/m2, respectively, to analyze body composition. FADI and FADI-Sport surveys were completed by the participants before the measurements. All feet evaluations were measured on the dominant foot of each participant. Foot arch height was measured using the navicular drop test and plantar fascia thickness was measured using ultrasound. Plantar pressure and balance tests were conducted afterward followed by ankle joint range of motion and strength tests.
- 4. Statistical analysis
- The collected data were analyzed using SPSS version 18.0 for Windows (SPSS Inc., Chicago, IL, USA), and the participants’ general characteristics were analyzed using descriptive statistics. The difference between normal weight and obese groups were analyzed using an independent t test. For ultrasound measurements, the inter-rater and intra-rater reliabilities were analyzed using intraclass correlation coefficient (ICC)2,1 and ICC3,1. The statistical significance level was set to 0.05.
Materials and Methods
2.1. Measurement of foot arch height
2.2. Plantar fascia thickness test
2.3. Plantar pressure and balance tests
2.4. Ankle joint range of motion and strength tests
2.5. Foot and ankle disability index (FADI)
- All participants’ general characteristics are shown in Table 1. The mean age and height in both the normal and obese patients were broadly similar. As expected, the mean weight and BMI in the obese group (83.31 ± 19.35 kg and 29.11 ± 3.98 kg/m2, respectively) was markedly higher than in the normal group (58.13 ± 8.56 kg and 21.11 ± 2.06 kg/m2, respectively).
- Measurement of physical differences in foot structure and function showed that in obese participants, significantly higher values were obtained for the navicular drop test (NDT) and plantar fascia thickness (PFT) than in normal weight participants (p = 0.001; Table 2). Obese participants were also shown to have significantly lower ankle eversion strength (AES) test values compared with normal weight participants (p = 0.003; Table 2). No other significant differences in foot structure and function tests were observed between obese and normal weight participants were observed (Table 2).
- When participants were assessed for the distribution of pressure along their feet using a pressure mapping tool, it was shown that significantly higher measurements were observed for foot pressure between the 1st and 2nd metatarsal bone, foot pressure in heel, and “one leg stand-anterior and posterior sway,” in obese participants compared with normal weight participants (p < 0.05; Table 3). In contrast, no significant differences were observed in foot pressure between the 4th and 5th metatarsal bone, and the “one leg stand-left and right sway” measurements.
- Ultrasound measurements of plantar fascia thickness showed inter- and intra-rater reliability of 0.89 and 0.94, respectively (Table 4).
Results
- In this study, structural and functional changes on young adults’ feet as well as changes in balance secondary to obesity were analyzed in order to develop an intervention that could prevent these changes. Foot arch height, plantar fascia thickness, ankle joint range of motion, ankle joint strength, distribution of plantar pressure, and balance on one foot were investigated and compared between normal weight and obese groups.
- The obese group showed a significantly higher foot arch height than the normal weight group (as determined by NDT). The mean foot arch height change in the obese group was 9.23 mm, which was close to the flat foot diagnostic threshold of 10 mm. This result indicates problems with the medial longitudinal arch and is consistent with the results of previous studies showing structural and functional abnormalities of the medial longitudinal arch in obese patients [24–26]. The plantar fascia is the structure that maintains the shape of the medial longitudinal arch and provides mechanical support to the foot [27]. The obese group in this study had a relatively greater thickness of the plantar fascia, which is inferred to be secondary to the increased activity of the plantar fascia due to increased weight bearing and support.
- Obesity is a risk factor for plantar fasciitis [15,28], and a mean plantar fascia thickness of 4.8 mm has been reported in patients with plantar fasciitis [29]. However, the mean plantar fascia thickness of obese patients in this study was 4.2 mm, which is 0.6 mm less than the mean thickness observed in patients with plantar fasciitis. According to previous studies, mean navicular drop test measurement and plantar fascia thickness in young adults with flat feet were 11.08 mm and 4.7 mm, respectively [17]. Considering the changes in foot arch height and plantar fascia thickness in the obese group in this study, obese patients’ feet could eventually develop into flat feet and plantar fasciitis without appropriate weight loss and intervention programs, even if obese young adults do not currently have structural or functional problems in their feet.
- Obese and overweight patients have a higher mean plantar pressure than normal weight individuals [14,26]. Previous studies have reported increased plantar pressure on the heel and second and fourth metatarsal bones in male participants with a BMI of ≥ 25 kg/m2 [14]. In this study, the obese group had a higher plantar pressure on the first metatarsal bone, second metatarsal bone, and heel than the normal weight group. This observation is thought to be due to the decreased medial longitudinal arch and increased weight bearing on the plantar fascia. Pronation of the foot secondary to decreased medial longitudinal arch and excessive weight bearing on the plantar fascia’s origin and insertion seem to have caused increased plantar pressure on the 1st metatarsal bone, 2nd metatarsal bone, and heel.
- The obese group in this study had a greater decrease in medial longitudinal arch height and anterior-posterior balance while standing on one foot. This result coincides with that of a previous study [30] showing that decreased medial longitudinal arch height could affect posterior balance. Furthermore, decreased anterior-posterior balance not only causes a decrease in medial longitudinal arch height but also causes problems in the foot’s mechanoreceptors. A study by Handrigan et al [31] reported that increased weight can decrease the quality of proprioceptive information necessary for balance by putting excessive weight above the detection threshold on the foot’s mechanoreceptors.
- Furthermore, ankle strength, which is related to ankle motion, is a strong predictor of ankle stability and balance [32]. The eversion strength of the ankle is especially important for preventing ankle sprain [33]. In this study, a significant decrease in eversion strength of the ankle joint was observed in the obese group relative to the normal weight group, which indicates a higher probability of ankle sprain. Although FADI and FADI-Sport scores did not significantly differ in this study, the probability of acute or chronic activity restrictions is very high in patients whose BMI is higher than 25 kg/m2 [34]. Hence, obese young adults should undergo periodic evaluations of foot structure and function. Further studies are needed to develop management programs to improve structural and functional problems in the feet of obese young adults.
- The present study had some limitations. There was a lack of detailed classification of obesity and most of the population was selected from participants in their 20s, which may limit conclusions for the general population.
Discussion
- Obese young adults had more abnormalities in the medial longitudinal arch, plantar fascia, and plantar pressure as well as weakened ankle eversion strength and balance problems compared with the normal weight group. To prevent these abnormal changes, the development of a foot management program and its application are needed.
Conclusion
-
Acknowledgements
- This research was supported by the National Research Foundation of Korea (NRF) grant funded by Ministry of Science and ICT (No. 2017R1C1B5074795).
Acknowledgments
-
Conflicts of Interest
All the authors of this study declare no conflicts of interest.
Article information
- 1. World Health Organization (WHO). Obesity: preventing and managing the global epidemic. WHO Technical Report Series. 2000. p 894.
- 2. Fontaine KR, Redden DT, Wang C, et al. Years of life lost due to obesity. JAMA 2003;289(2). 187−93.ArticlePubMed
- 3. Owen CG, Kapetanakis VV, Rudnicka AR, et al. Body mass index in early and middle adult life: prospective associations with myocardial infarction, stroke and diabetes over a 30-year period: the British regional heart study. BMJ Open 2015;5(9). e008105. ArticlePubMedPMC
- 4. Bocchieri LE, Meana M, Fisher BL. A review of psychosocial outcomes of surgery for morbid obesity. J Psychosom Res 2002;52(3). 155−65.ArticlePubMed
- 5. Wang YC, McPherson K, Marsh T, et al. Health and economic burden of the projected obesity trends in the USA and the UK. Lancet 2011;378(9793). 815−25.ArticlePubMed
- 6. Anderson LH, Martinson BC, Crain AL, et al. Health care charges associated with physical inactivity, overweight, and obesity. Prev Chronic Dis 2005;2(4). A09.
- 7. Yang Z, Hall AG. The financial burden of overweight and obesity among elderly Americans: the dynamics of weight, longevity, and health care cost. Health Serv Res 2008;43(3). 849−68.ArticlePubMedPMC
- 8. National Health Insurance Service (NHIS). A plan of health care charge on health risk factors for financial resources of health insurance. NHIS Report 2012;191−202.
- 9. Yoon NH, Kwon SM. Impact of obesity on health care utilization and expenditure. Korea Assoc Health Econ Policy 2013;19(2). 61−80.
- 10. Anandacoomarasamy A, Caterson I, Sambrook P, et al. The impact of obesity on the musculoskeletal system. Int J Obes 2008;32(2). 211−22.ArticlePDF
- 11. Cooper L, Ryan CG, Ells LJ, et al. Weight loss interventions for adults with overweight/obesity and chronic musculoskeletal pain: a mixed methods systematic review. Obes Rev 2018;19(7). 989−1007.ArticlePubMed
- 12. Jacob HA. Forces acting in the forefoot during normal gait—an estimate. Clin Biomech 2001;16(9). 783−92.Article
- 13. Keller TS, Weisberger AM, Ray JL, et al. Relationship between vertical ground reaction force and speed during walking, slow jogging, and running. Clin Biomech 1996;11(5). 253−9.Article
- 14. Hills AP, Hennig EM, McDonald M, et al. Plantar pressure differences between obese and non-obese adults: a biomechanical analysis. Int J Obes Relat Metab Disord 2001;25(11). 1674−9.ArticlePubMedPDF
- 15. Mickle KJ, Steele JR. Obese older adults suffer foot pain and foot-related functional limitation. Gait Posture 2015;42(4). 442−7.ArticlePubMed
- 16. Duvigneaud N, Matton L, Wijndaele K, et al. Relationship of obesity with physical activity, aerobic fitness and muscle strength in Flemish adults. J Sports Med Phys Fitness 2008;48(2). 201−10.PubMed
- 17. Park SY, Bang HS, Park DJ. Potential for foot dysfunction and plantar fasciitis according to the shape of the foot arch in young adults. J Exerc Rehabil 2018;14(3). 497−502.ArticlePubMedPMCPDF
- 18. Joo NS, Park YW, Park TS, et al. Medical cost and hospital visit by obesity and central obesity. Korean J Obes 2008;17(2). 91−8.
- 19. Dicharry JM, Franz JR, Della Croce U, et al. Differences in static and dynamic measures in evaluation of talonavicular mobility in gait. J Orthop Sports Phys Ther 2009;39(8). 628−34.ArticlePubMed
- 20. Radwan A, Wyland M, Applequist L, et al. Ultrasonography, an effective tool in diagnosing plantar fasciitis: a systematic review of diagnostic trials. Int J Sports Phys Ther 2016;11(5). 663−71.PubMedPMC
- 21. Hong WS, Kim GW. Reliability of the joint neutral position and measurement methods of the ankle joint complex range of motion. J Korea Phys Ther 2011;23(4). 45−51.
- 22. Hislop H, Avers D, Brown M. Daniels and Worthingham’s Muscle Testing. 9th ed. St Louis (MS): Saunders, Elsevier; 2013. pp 251−78.
- 23. Hale SA, Hertel J. Reliability and sensitivity of the foot and ankle disability index in subjects with chronic ankle instability. J Athl Train 2005;40(1). 35−40.PubMedPMC
- 24. Hills AP, Hennig EM, Byrne NM, et al. The biomechanics of adiposity--structural and functional limitations of obesity and implications for movement. Obes Rev 2002;3(1). 35−43.ArticlePubMed
- 25. Irving DB, Cook JL, Young MA, et al. Obesity and pronated foot type may increase the risk of chronic plantar heel pain: a matched case-control study. BMC Musculoskelet Disord 2007;8:41. ArticlePubMedPMC
- 26. Mickle KJ, Steele JR, Munro BJ. Does excess mass affect plantar pressure in young children? Int J Pediatr Obes 2006;1(3). 183−8.ArticlePubMed
- 27. Erdemir A, Hamel AJ, Fauth AR, et al. Dynamic loading of the plantar aponeurosis in walking. J Bone Joint Surg Am 2004;86-A(3). 546−52.Article
- 28. Riddle DL, Pulisic M, Pidcoe P, et al. Risk factors for plantar fasciitis: a matched case-control study. J Bone Joint Surg Am 2003;85-A(5). 872−7.Article
- 29. Karabay N, Toros T, Hurel C. Ultrasonographic evaluation in plantar fasciitis. J Foot Ankle Surg 2007;46(6). 442−6.ArticlePubMed
- 30. Lee GC, Kim CH, Kim BG, et al. The effects of balanced performances on degree of dropped foot arch. Archiv Orthop Sports Phys Ther 2006;2(1). 45−52.
- 31. Handrigan G, Hue O, Simoneau M, et al. Weight loss and muscular strength affect static balance control. Int J Obes 2010;34(5). 936−42.ArticlePDF
- 32. Munn J, Beard DJ, Refshauge KM, et al. Eccentric muscle strength in functional ankle instability. Med Sci Sports Exerc 2003;35(2). 245−50.ArticlePubMed
- 33. Ashton-Miller JA, Ottaviani RA, Hutchinson C, et al. What best protects the inverted weight bearing ankle against further inversion? Evertor muscle strength compares favorably with shoe height, athletic tape, and three orthoses. Am J Sports Med 1996;24(6). 800−9.ArticlePubMed
- 34. Tsuritani I, Honda R, Noborisaka Y, et al. Impact of obesity on musculoskeletal pain and difficulty of daily movements in Japanese middle-aged women. Maturitas 2002;42(1). 23−30.ArticlePubMed
References
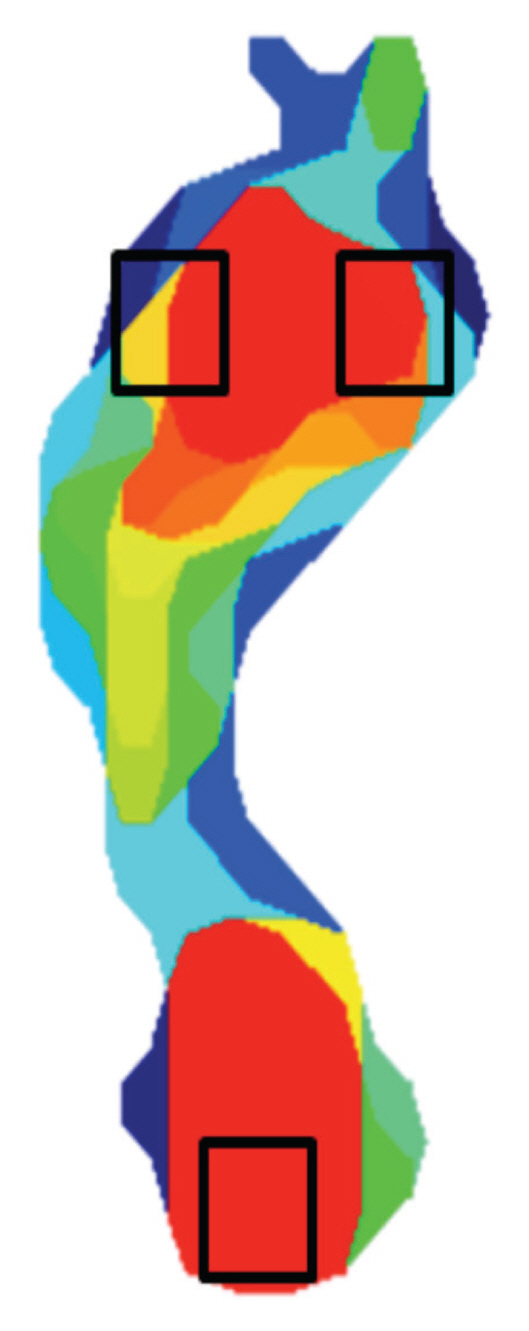
Table 1General characteristics of participants (n = 52).
Table 2Comparison of foot structure, and function between the normal and obese weight groups (n = 52).
Table 3Comparison of foot pressure and balance between normal and obese weight groups (n = 52).
Figure & Data
References
Citations
Citations to this article as recorded by 
- Arch-related alteration in foot loading patterns affected by the increasing extent of body mass index in children: A follow-up study
Shiyang Yan, Yihong Zhao, Longbin Zhang, Luming Yang
Gait & Posture.2023; 100: 247. CrossRef - Understanding foot conditions, morphologies and functions in children: a current review
Hanhui Jiang, Qichang Mei, Yuan Wang, Junhao He, Enze Shao, Justin Fernandez, Yaodong Gu
Frontiers in Bioengineering and Biotechnology.2023;[Epub] CrossRef - Immediate effect of the use of toe separators on dynamic balance and ankle range of motion: a pilot study
Daniel González-Devesa, Alberto Hermo-Argibay, Nerea Blanco-Martínez, Carlos Ayán-Pérez
The Physician and Sportsmedicine.2023; : 1. CrossRef - Analysis of Static and Dynamic Baropedographic Parameters in Post COVID-19 Patients
Zofia Dzięcioł-Anikiej, Agnieszka Dakowicz, Monika Pociene, Janusz Dzięcioł, Anna Kuryliszyn-Moskal, Amanda Maria Kostro
Acta Balneologica.2023; 65(5): 276. CrossRef - Characteristics of Plantar Pressure with Foot Postures and Lower Limb Pain Profiles in Taiwanese College Elite Rugby League Athletes
Tong-Hsien Chow, Yih-Shyuan Chen, Chin-Chia Hsu, Chin-Hsien Hsu
International Journal of Environmental Research an.2022; 19(3): 1158. CrossRef - Traceable Features of Static Plantar Pressure Characteristics and Foot Postures in College Students with Hemiplegic Cerebral Palsy
Tong-Hsien Chow
Journal of Personalized Medicine.2022; 12(3): 394. CrossRef - Elite Tennis Players Experiencing High-Arched Supination and Cuboids Dropped Foot Syndromes in Daily Normal Gait
Tong-Hsien Chow, Chin-Chia Hsu
International Journal of Environmental Research an.2022; 19(15): 8897. CrossRef - Association between flat foot prevalence and nutritional status in schoolchildren
Sonja Susnjevic, Dragana Milijasevic, Dusica Maric, Olja Niciforovic-Surkovic, Vesna Mijatovic-Jovanovic, Snezana Ukropina
Srpski arhiv za celokupno lekarstvo.2022; 150(1-2): 59. CrossRef - Comparison of Foot Posture, Joint Position Sense, Dynamic Balance,
and Plantar Pressure between Young Adults with and without
Obesity
Min-Hyeok Kang, Dong-Chul Moon, Du-Jin Park
Journal of Musculoskeletal Science and Technology.2022; 6(2): 58. CrossRef - Relationship between total weight-bearing response of the navicular and talus bones and weight-bearing response of hindfoot valgus in normal foot arch
Masafumi Maruyama, Arito Yozu, Yoshikazu Okamoto, Hitoshi Shiraki
The Journal of Physical Fitness and Sports Medicin.2021; 10(2): 75. CrossRef - Effects of Two Foot-Ankle Interventions on Foot Structure, Function, and Balance Ability in Obese People with Pes Planus
Du-Jin Park, Kyung-Sun Lee, Se-Yeon Park
Healthcare.2021; 9(6): 667. CrossRef - An Investigation of Regional Plantar Soft Tissue Hardness and Its Potential Correlation with Plantar Pressure Distribution in Healthy Adults
Maimaitirexiati Helili, Xiang Geng, Xin Ma, Wenming Chen, Chao Zhang, Jiazhang Huang, Xu Wang, Estefanía Peña
Applied Bionics and Biomechanics.2021; 2021: 1. CrossRef - Relationships between Plantar Pressure Distribution and Rearfoot Alignment in the Taiwanese College Athletes with Plantar Fasciopathy during Static Standing and Walking
Tong-Hsien Chow, Yih-Shyuan Chen, Chin-Chia Hsu
International Journal of Environmental Research an.2021; 18(24): 12942. CrossRef - Three-Dimensional Ankle Exercise with Combined Isotonic Technique for an Obese Subject with Plantar Fasciitis: A Case Study
Kyung-Sun Lee, Du-Jin Park
Medicina.2020; 56(4): 190. CrossRef - Mixed factors affecting plantar pressures and center of pressure in obese children: Obesity and flatfoot
Shiyang Yan, Ruoyi Li, Bi Shi, Ruoli Wang, Luming Yang
Gait & Posture.2020; 80: 7. CrossRef - Body weight-dependent foot loads, assessed in terms of BMI and adiposity, in school-aged children: a cross sectional study
Beata Szczepanowska-Wolowiec, Paulina Sztandera, Ireneusz Kotela, Marek Zak
Scientific Reports.2020;[Epub] CrossRef - The Impact of Overweight and Obesity on Plantar Pressure in Children and Adolescents: A Systematic Review
Liliana Catan, Elena Amaricai, Roxana Ramona Onofrei, Calin Marius Popoiu, Emil Radu Iacob, Corina Maria Stanciulescu, Simona Cerbu, Delia Ioana Horhat, Oana Suciu
International Journal of Environmental Research an.2020; 17(18): 6600. CrossRef - Standard reference values of weight and maximum pressure distribution in healthy adults aged 18–65 years in Germany
D. Ohlendorf, K. Kerth, W. Osiander, F. Holzgreve, L. Fraeulin, H. Ackermann, D. A. Groneberg
Journal of Physiological Anthropology.2020;[Epub] CrossRef
 PubReader
 ePub Link
 Cite
Cite
