Articles
- Page Path
- HOME > Osong Public Health Res Perspect > Volume 10(6); 2019 > Article
-
Original Article
Mediation Effects of Basic Psychological Needs Between Autonomy Support from Healthcare Providers and Self-Management Among Cancer Survivors - Eun-Jung Baea, Yun-Hee Kimb
-
Osong Public Health and Research Perspectives 2019;10(6):385-393.
DOI: https://doi.org/10.24171/j.phrp.2019.10.6.09
Published online: December 31, 2019
aDivision of Nursing, Dongnam Institute of Radiological & Medical Sciences, Busan, Korea
bDepartment of Nursing, Pukyong National University, Busan, Korea
- *Corresponding author: Yun-Hee Kim, Department of Nursing, Pukyong National University, Busan, Korea, E-mail: soohappy@pknu.ac.kr
• Received: October 13, 2019 • Revised: November 27, 2019 • Accepted: November 28, 2019
Copyright ©2019, Korea Centers for Disease Control and Prevention
This is an open access article under the CC BY-NC-ND license (http://creativecommons.org/licenses/by-nc-nd/4.0/).
Abstract
-
Objectives
- This study examined the mediating effects of basic psychological needs between patient autonomy support from healthcare providers, and self-management among cancer survivors.
-
Methods
- This study collected data from 148 cancer patients who had visited D hospitals in B city, Korea. A structured questionnaire was distributed to determine patient characteristics, healthcare provider autonomy support, basic psychological needs, and self-management. Data were analyzed using descriptive statistics, Pearson’s correlation coefficient, and regression analysis that implemented Baron and Kenny’s method for mediation were used for analyses.
-
Results
- Self-management was significantly correlated with the level of healthcare provider autonomy support (r = 0.38, p < 0.001), autonomy (r = 0.40, p < 0.001), competence (r = 0.25, p = 0.002), and relatedness (r = 0.32, p < 0.001). Furthermore, autonomy (β = 0.30, p < 0.001) and relatedness (β = 0.22, p = 0.008) had partial mediating effects on the relationship between healthcare provider autonomy support and self-management (Z = 3.13, p = 0.002 and Z = 2.29, p = 0.022, respectively).
-
Conclusion
- Autonomy and relatedness mediated the impact of healthcare provider autonomy support for self-management among cancer survivors. This suggests that strategies for enhancing autonomy and relatedness should be considered when developing self-management interventions for cancer survivor patients.
- The National Cancer Information Center reported that 1 in every 29 Koreans received cancer treatments and survived after cancer treatments in 2016 [1]. However, the 5-year survival rate for Korean cancer patients was 70.7% which was a 29.5% increase compared with data from 1993–1995 where the rate was 41.2% [1]. Early screening practices and improved treatment rates increased the survival rates. In addition to diagnoses and treatment procedures, many of these patients and their care managers are very interested in the expected quality-of-life after cancer treatment.
- As the importance of daily care goes beyond cancer diagnoses and treatments, the concept of “the cancer survivor” goes beyond a simple reference to post-cancer patients. Rather, it has become a comprehensive term that includes patients who are currently being diagnosed and treated [2]. Beginning with diagnosis, many cancer patients must endure a dynamic process that persists. In other words, experiences of physical and mental stress combine with long-term treatments and inscrutable prognoses that require patients to adapt to life with cancer [3]. These patients require continuous self-care to minimize the after-effects of cancer treatment, maintain optimal health conditions, and prevent the recurrence and spread of cancer. Self-management is a dynamic and interactive daily process in which individuals must confront their chronic disease. This concept requires patients to manage symptoms and treatments whilst adapting to lifestyle changes involving both physical and psychological consequences of the disease whilst working with their families, communities, and healthcare professionals [4,5]. In this context, cancer is no longer an acute disease, but a chronic one that must be managed until the end of the patient’s life [6]. Here, behavior and behavioral changes are the central elements of self-management. For instance, Bodenheimer et al [7] argued that patients with a chronic disease are active health managers rather than passive implementers. In this way, being the main agent of self-care improves health outcomes. Good self-care can thus become the difference which allows cancer patients to enjoy a good quality of life whilst maintaining optimal health and a functional condition.
- Self-determination theory explains the factors that help an individual to select and maintain a healthy behavior. It is assumed that autonomy, competence, relatedness, and the socioenvironmental factors that support autonomy are increasingly internalized, and thus influence the onset and continuity of autonomous behavior [8]. In the same context, a behavior is initiated and sustained for long periods of time through self-determined motivation, based on the degree to which the basic psychological needs of autonomy, competence, and relationship engagement are fulfilled. These basic psychological needs are further influenced by the level of autonomy support available from an individual’s healthcare provider [8,9]. The natural tendency is for people to pursue physical and psychological health. As such, unhealthy behaviors are restricted in favor of healthy behaviors when basic needs are met. The self-determination theory can therefore be used to examine sustained self-management behaviors among patients with chronic illnesses (e.g., diabetes or hypertension), and/or those suffering from conditions related to alcohol abuse, or obesity [9–11]. The self-determination theory was considered in this study whilst investigating the self-management practices of cancer survivors who live with cancer and/or chronic disease risks throughout their lives.
- Autonomy support entails that healthcare providers help patients with chronic illnesses to acquire long-term self-care skills [12]. A previous study among patients with chronic illnesses reported that healthcare support encouraged them to take control of their own health needs by enhancing the motivation required to conduct health and self-management practices by using their problem-solving skills [13,14]. Effective self-management support programs are extremely important in this context. Science-based support programs are also needed to accurately identify the factors that maximize health outcomes. However, few Korean studies have identified how these factors affect the self-management practices of cancer survivors. Previous studies of liver transplant recipients, and diabetic patients showed that autonomy support of healthcare providers affects self-management behavior through autonomy and competence [11,15]. Based on the theory of self-determination, the mediating effects of autonomy, competence, and relationship between autonomy support and self-management for cancer survivors can be estimated.
- This study identified the requisite degree of autonomy support needed from healthcare providers, and the basic psychological requirements for ensuring that cancer survivors can effectively engage in self-care practices. This approach specifically involved an investigation into the mediating effects of basic psychological needs between autonomy support from healthcare providers and self-management, thus providing the basic data needed to develop the related interventions.
Introduction
- 1. Study design
- This study adopted a cross-sectional self-reporting survey design to examine the mediating effects of basic psychological needs between autonomy support from healthcare providers, and self-management among cancer survivors.
- 2. Participants
- This study’s participants were individuals aged 19 years or older who had been diagnosed with cancer, and gave written, informed consent following a description of the study purpose and methods. The required sample size was calculated to be 143 individuals according to a multiple regression analysis with a significance level of 0.05, a medium-effect size of 0.15, a power of 80.0%, and 16 predictors (i.e., 12 demographic characteristics, autonomy support from healthcare providers, autonomy, competence, and relatedness). The effect size was estimated from similar studies that had previously reported a method of determining the effect size [16]. The analysis was conducted using the G-power 3.1.9.2 software program (Heinrich Heine University, Dusseldorf, Germany). Of the 153 surveys distributed, a total of 148 were suitable for further analysis (5 were excluded due to missing values).
- 3. Measurements
- Autonomy support requires an atmosphere in which persons other than healthcare professionals, can choose and control the desired course of action whilst forming therapeutically supportive relationships [17]. In this context, autonomy support from health providers was measured according to the healthcare climate questionnaire [17], which was translated into Korean [11]. The original tool was developed to measure individuals who control their weight. It was later used in patients with diabetes, and neuropathy, and it was verified as reliable. The healthcare climate questionnaire is comprised of 15 items, that are divided into 8 items of “information and choice” and 7 items of “non-judgmental and positive feedback” [11]. As a result of confirmatory factor analysis, the standard regression coefficient for all items was over 0.50 which ensured the validity of the tool. A 7-point Likert scale is used in the tool, with higher scores indicating a greater level of autonomy support. The scale had a Cronbach α score of 0.84 at the time of development [17], but later had a score of 0.89 in Seo and Choi’s study [11]. This study had a score of 0.92.
- Basic psychological needs comprise of the universal and innate desires for autonomy, competence, and relatedness which are rooted in the self-determination theory [18]. This study measured basic psychological needs according to the basic psychological need scale (BPNS) [18], which was translated into Korean [19]. The BPNS is comprised of 3 sub-components (i.e., autonomy, competence, and relatedness). Autonomy is related to the belief that the subject of one’s actions is oneself, while competence is concerned with fully using one’s abilities in the context of social interaction, and relatedness involves the feeling that interpersonal interactions are beneficial. These elements are measured through 21 items (7 for autonomy, 6 for competence, and 8 for relatedness) which were answered on a 7-point Likert scale, with higher scores indicating a greater perception of each related area. The BPNS had a Cronbach α score of 0.90 at the time of its development [18], but later had a score of 0.86 [19]. This study had a Cronbach α score of 0.87.
- Self-management is a dynamic process in which patients with a chronic disease must maintain optimal daily health through knowledge of their condition, and a comprehensive discussion of all treatment plans with their healthcare professionals. These parties can then jointly agree on an appropriate treatment course. Patients are responsible for monitoring and managing their symptoms, physical functions, emotional states, and social activities. This study measured self-management according to the Korean version of The Partners in Health (PIH) scale [20], which was developed by the Flinders Human Behavior and Health Research Unit of the University of Flinders, Australia. The PIH is comprised of 12 items that are answered using an 8-point Likert scale, with higher scores indicating better self-management. However, this study modified paragraph 7 of the PIH to read as follows: “I am constantly aware of symptoms and early warning signs related to my disease (bottles or lumps, frequent coughs, changes in anti-carcinogenic habits, persistent pain, excessive weight loss, difficulty eating food, abnormal bleeding, sudden skin changes).” The PIH had a Cronbach α score of 0.82 at the time of its development [20], but later had a score of 0.87 [15]. This study had a Cronbach α score of 0.90.
- 4. Statistical analysis
- All data were analyzed using the SPSS Version 25.0 software program (IBM Corp., Armonk, NY, USA). Participant sociodemographic and clinical characteristics were analyzed using descriptive statistics for frequency, percentage, mean, and standard deviation. Individual differences in self-management were analyzed using the Student t test, and analysis of variance according to the respective sociodemographic and clinical characteristics of each patient. In addition, a Scheffe test was conducted during the post hoc analysis, and correlations between variables were subjected to Pearson’s correlation coefficients. The mediating effects of autonomy support from healthcare providers, and self-management between autonomy, competence, and relatedness were analyzed using a 3-stage regression analysis following Baron and Kenny methods [21]. In the first stage, regression analysis of the effects of independent variables on the mediating variable, should show significant results. In the second stage, regression analysis of the effects of independent variables on the dependent variable, should have a significant effect. In the third stage, to control each variables influence, independent variables and mediating variables are tested at the same time, and then a regression analysis is performed on the effects of these on the dependent variables. The mediating variable was considered to have a full mediating effect on this relationship when the correlation between the independent and dependent variables was measured as insignificant. However, the mediating variable was considered to have a partial mediating effect on the same relationship when the correlation between the independent and dependent variables was measured as significant. The significance of the mediated effect was verified by a Sobel test.
- 5. Ethical considerations
- This study received ethical approval from the institutional review board of the Dongnam Institute of Radiological and Medical Sciences (Approval no.: D-1902-011-002). The researcher provided all participants with full details about the research purpose and ensured data confidentiality. Individuals who agreed to participate completed signed informed consent forms, which clearly stated that withdrawal was possible at any time, ensured anonymity in relation to all collected data, and stated that all content was solely used for research purposes.
Materials and Methods
3.1. Autonomy support from healthcare providers
3.2. Basic psychological needs
3.3. Self-management
- 1. Participant sociodemographic and clinical characteristics
- There were 100 female (67.6%)and 48 male (32.4%) participants. There were 57 (38.5%) who were aged 60 years or older, and 117 (79.1%) had completed their education beyond high school. Most participants lived with their spouses, and 104 (70.3%) were religious. There were 102 (68.9%) participants who were unemployed and did not participate in patient support groups. The most common types of illness were gynecological cancer, thyroid cancer, and gastrointestinal cancer, with 103 (69.6%) participants having undergone surgery. There were 34 (23.0%) participants who had been diagnosed with cancer 5 years prior to the study, and 46 (31.1%) were no longer receiving treatment. A total of 62 (41.9%) had no comorbidity (Table 1).
- 2. Autonomy support from healthcare providers, basic psychological needs, and self-management scores
- The mean participant score for autonomy support from healthcare providers was 84.64 out of a possible 105, while the basic psychological needs score was 111.01 out of 147, and the self-management score was 76.28 out of 96 (Table 2). For mean subcategory scores, relatedness scored the highest at 44.01, followed by autonomy and competence at 38.80 and 28.20, respectively.
- 3. Relationships between autonomy support from healthcare providers, basic psychological needs, and self-management
- Self-management was significantly and positively correlated with autonomy support from healthcare providers (r = 0.38, p < 0.001), autonomy (r = 0.40, p < 0.001), competence (r = 0.25, p = 0.002), and relatedness (r = 0.32, p < 0.001; Table 3).
- 4. The mediating effects of basic psychological needs between autonomy support from healthcare providers, and self-management
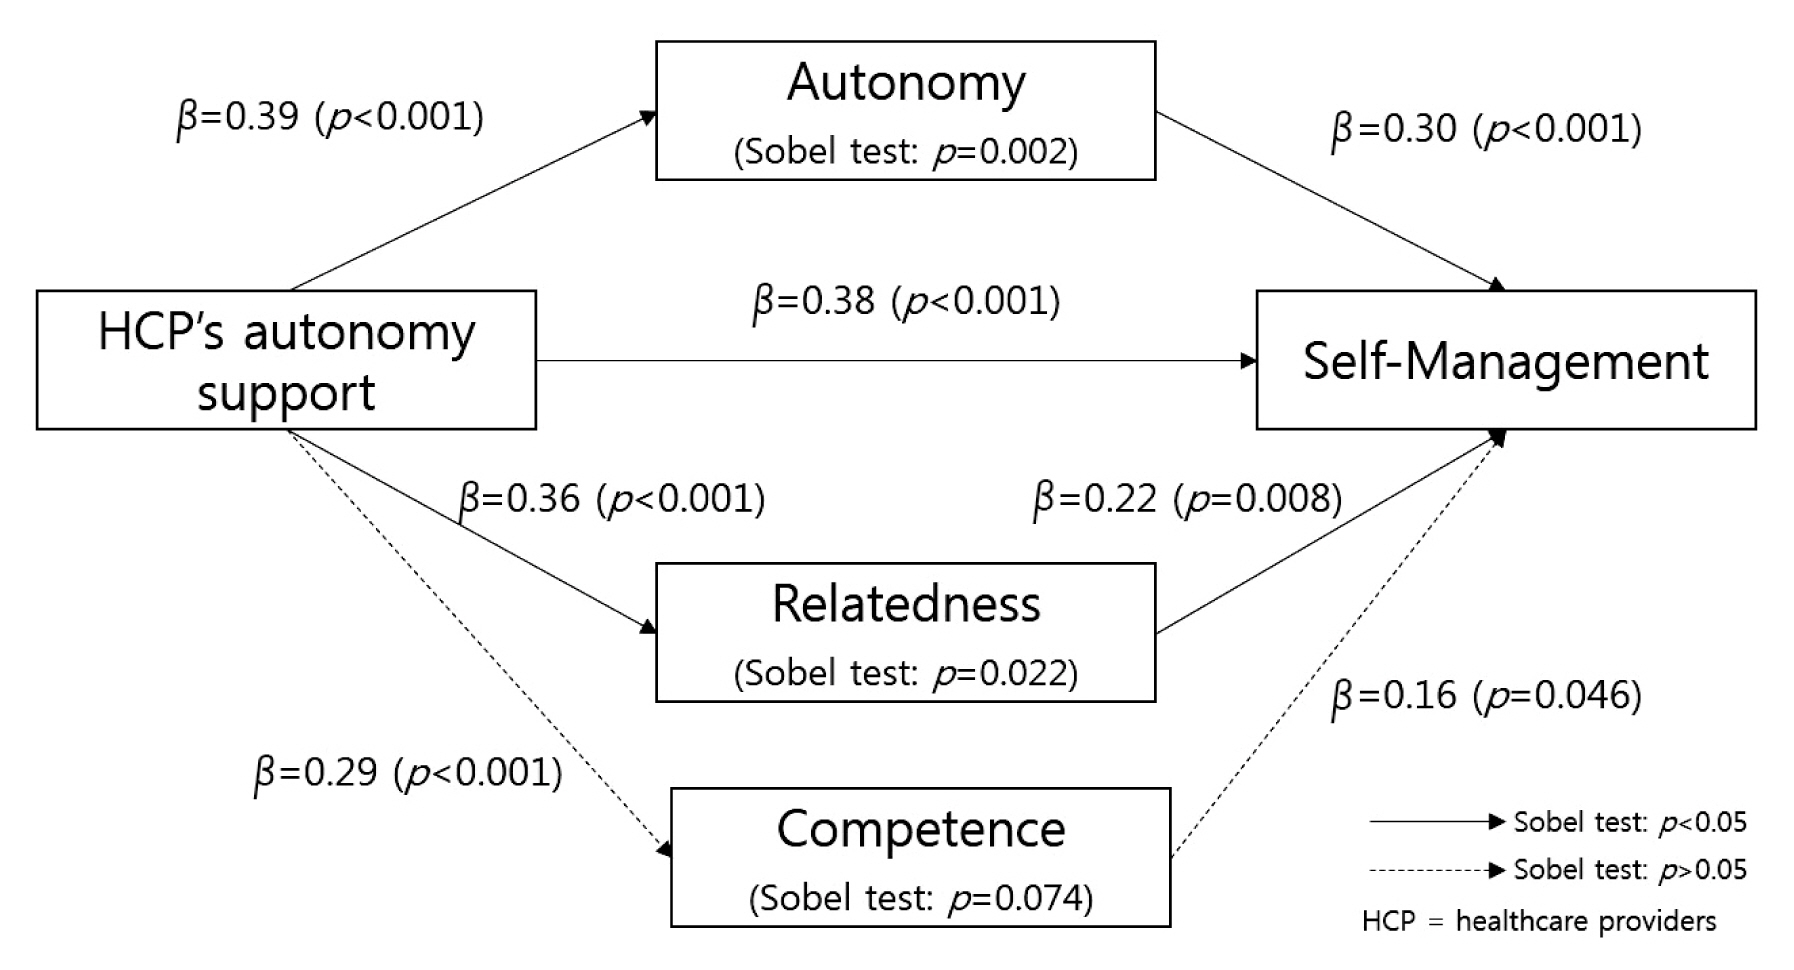
- The results of the first regression analysis examining the mediating effects of autonomy, showed that autonomy support from healthcare providers had a significant effect on autonomy (β = 0.39, p < 0.001), while the second-stage results showed that autonomy support from healthcare providers had a significant effect on self-management (β = 0.38, p < 0.001), and the third-stage results (with autonomy support from healthcare providers, and autonomy set as a predictor variable, and self-management set as the dependent variable) showed that only autonomy exerted a significant effect on self-management (β = 0.30, p < 0.001). In other words, autonomy had a partial mediating effect between autonomy support from healthcare providers, and self-management. The results of the Sobel test confirmed the significance of the medial effect of autonomy (Z = 3.13, p = 0.002).
- The results of first-stage regression analysis showed that autonomy support from healthcare providers had a significant effect on relatedness (β = 0.36, p < 0.001). In addition, the second-stage results showed that autonomy support from healthcare providers exerted a significant effect on self-management (β = 0.38, p < 0.001), and the third-stage results (with autonomy support from healthcare providers, and relatedness set as a predictor variable, and self-management set as the dependent variable) showed that only relatedness had a significant effect on self-management (β = 0.22, p = 0.008). In other words, relatedness exerted a partial mediating effect between autonomy support from healthcare providers, and self-management. A Sobel test was conducted to verify the statistical significance of the mediating effects of relatedness (Z = 2.29, p = 0.022; Table 4; Figure 1). However, no mediating effects were detected for competence between autonomy support from healthcare providers, and self-management.
Results
- This study was designed to report basic data for the development of nursing interventions to improve self-management in cancer survivors by identifying the mediating effects of basic psychological needs between autonomy support from healthcare providers, and self-management.
- Research has shown that such support of patient autonomy has a statistically significant positive effect on self-management in this context. Compared with other countries, Korea has relatively shorter interview times with doctors, and higher patient to nurse ratios during hospitalization. It is thus difficult to build trust between medical staff and patients. Nevertheless, this study’s results showed that cancer patients form close relationships with medical staff during relatively long treatment periods (e.g., those involving surgery, cancer treatment and/or radiation). These relationships are important from the moment patients are diagnosed, until the time that they are discharged and, in many cases long after. In this context, autonomy support provides psychologically vulnerable patients with the confidence and belief needed to establish and practice effective healthcare. This forms the basis for sustaining the will to engage in self-management. Previous research has shown that healthcare provider-based support, substantially contributes to positive behavioral changes among patients [22]. Cooperative patient/provider relationships improve both treatment continuity and health outcomes, in cases of chronic illness [22]. Other studies have highlighted the significance of positive relationships between healthcare professionals and patients [18,23]. That is, patients who have a familiar relationship with medical staff, tend to perform better at self-monitoring and adhering to medication regimens compared with those patients who do not become close with the medical staff [18,23]. These studies show that positive interactions between health professionals and patients, significantly influence sustained behavioral changes among patients. As such, cancer survivors and health professionals should receive effective communication training to improve overall self-management practices.
- This study identified a partial mediating effect of basic psychological needs between patient autonomy support from healthcare providers, and self-management among cancer survivors. This finding was consistent with previous studies reporting that such autonomy support has both direct, and indirect effects on health-related behaviors through basic psychological needs [24,25]. This is because healthy behaviors are initiated and maintained through external motivators related to why and how they should be implemented. These behaviors are unlike those related to pleasure (which are initiated and maintained according to internal motivations) are aimed at meeting basic psychological needs [26]. Such findings are consistent with the argument that healthcare professionals should clarify care directions and health values, provide treatment or nursing options, and correctly instruct patients on how to perform health activities, thereby satisfying their basic psychological needs and indirectly influencing self-management behaviors [27].
- Confidence in disease management may decrease immediately after completing cancer treatments. This is likely due to relatively low physical strength, various side effects, and psychological vulnerability. However, physical function is gradually restored in conjunction with the reduction of psychological anxiety. As such, self-care confidence can eventually be restored. Enhancements can also be made to patient autonomy, which is considered the principal component and regulator of self-management. Humans desire social contact and this entails a tendency to maintain intimate and meaningful interpersonal relationships. If satisfied, such relationships lead to improvements in autonomous motivation in patients, and the continuation of healthy beneficial activities [8]. Some studies have suggested that basic psychological needs most profoundly affect the continuation or maintenance of behaviors through substantial levels of competence [20,28]. However, in this current study no mediating effects for competence on self-management were detected. This was different from previous studies of liver transplant recipients, and diabetic patients [11,15]. The reason for this result is thought to be that the study participants included patients undergoing cancer treatment. Therefore, it is necessary to confirm the results through repeated research of cancer survivors after treatments. Self-determination theory proposes that if one or more of the core basic psychological needs (i.e., autonomy, competence, and relatedness) are met, then intrinsic motivation is maintained, and behavioral changes are led through self-determinism [8,27]. While individually based self-management programs are being implemented among cancer survivors, it is still necessary for healthcare providers to ensure appropriate autonomy support and guidance for patients. Such support should result in improved autonomy, competence, and relatedness in the context of patient self-management, thus ultimately contributing to quality-of-life among cancer survivors.
- This study had several limitations. Firstly, it did not include all carcinoma patients, thus limiting generalizability of the results. Furthermore, 67.6% of all participants were females. As such, further studies may be needed before these findings can be applied to males. Secondly, many (41.9%) participants had other chronic diseases (e.g., high blood pressure and/or diabetes). These conditions should be considered when interpreting the results as they may have affected autonomy support, basic psychological needs, and self-management. Thirdly, study participants were recruited from 1 institution in region B. This also affects generalizability to cancer survivors in other regions of Korea.
- This study implemented concepts from the theory of self-determination to examine the relationship between autonomy support for patients from healthcare providers and patient self-management in cancer survivors. Specifically, it identified the mediating effects of basic psychological needs (i.e., autonomy, competence, and relatedness) in this context. The results of this study showed that autonomy and relatedness partially mediated the relationship between autonomy support from healthcare providers and self-management. Thus, it is suggested that programs designed to improve self-management in cancer survivors should include effective strategies that can enhance autonomy support from healthcare providers, autonomy, and relatedness. These findings provide directions for related research in the future. There is a lack of research on the degree of self-management and associated factors among cancer survivors and more studies should be conducted among survivors of various types of cancers. In addition, related effects need to be identified by developing and applying self-management programs designed to enhance autonomy and relatedness in this context.
Discussion
-
Acknowledgements
- This work was supported by a Research Grant of Pukyong National University (2019).
Acknowledgments
-
Conflicts of Interest
The authors declare that they have no conflicts of interest.
Article information
- 1. National Cancer Center [Internet]. Cancer statistics [cited 2019 Aug 19]. Available from: https://www.cancer.go.kr/lay1/S1T648C650/contents.do.
- 2. Kim HS, Jang H, Yi M, et al. Cancer survivorship care among oncology nurses in Korea. Asian Oncol Nurs 2017;17(2). 124−32. PMID: 10.5388/aon.2017.17.2.124.Article
- 3. Lee ES, Park JS. The comparison of health promotion behavior, post traumatic growth and quality of life according to stages of survivorship in patients with female genital neoplasm. Korean J Adult Nurs 2013;25(3). 312−21. PMID: 10.7475/kjan.2013.25.3.312.Article
- 4. Barlow J, Wright C, Sheasby J, et al. Self-management approaches for people with chronic conditions: A review. Patient Educ Couns 2002;48(2). 177−87. PMID: 10.1016/S0738-3991(02)00032-0. PMID: 12401421.ArticlePubMed
- 5. Lorig KR, Holman HR. Self-management education: History, definition, outcomes, and mechanisms. Ann Behav Med 2003;26(1). 1−7. PMID: 10.1207/S15324796ABM2601_01. PMID: 12867348.ArticlePubMed
- 6. Jang S, Lee H, Yeu H, et al. The effects of posttraumatic growth and meaning in life on health promotion behavior in cancer patients. Asian Oncol Nurs 2014;14(2). 100−8. PMID: 10.5388/aon.2014.14.2.100.Article
- 7. Bodenheimer T, Lorig K, Holman H, et al. Patient self-management of chronic disease in primary care. JAMA 2002;288(19). 2469−75. PMID: 10.1001/jama.288.19.2469. PMID: 12435261.ArticlePubMed
- 8. Deci EL, Ryan RM. The” what” and” why” of goal pursuits: Human needs and the self-determination of behavior. Psychol Inq 2000;11(4). 227−68. PMID: 10.1207/S15327965PLI1104_01.Article
- 9. Williams GC, Lynch M, Glasgow RE. Computer-assisted intervention improves patient-centered diabetes care by increasing autonomy support. Health Psychol 2007;26(6). 728−34. PMID: 10.1037/0278-6133.26.6.728. PMID: 18020845.ArticlePubMedPDF
- 10. Schmidt K, Gensichen J, Petersen JJ, et al. Autonomy support in primary care: validation of the German version of the Health Care Climate Questionnaire. J Clin Epidemiol 2012;65(2). 206−11. PMID: 10.1016/j.jclinepi.2011.06.003.ArticlePubMed
- 11. Seo YM, Choi WH. A predictive model on self-care behavior for patients with type 2 diabetes: Based on self-determination theory. J Korean Acad Nurs 2011;41(4). 491−9. PMID: 10.4040/jkan.2011.41.4.491. PMID: 21964224.ArticlePubMed
- 12. Bodenheimer T, Wagner EH, Grumbach K. Improving primary care for patients with chronic illness. JAMA 2002;288(14). 1775−9. PMID: 10.1001/jama.288.14.1775. PMID: 12365965.ArticlePubMed
- 13. Barlow JH, Wright CC, Turner AP, et al. A 12-month follow-up study of self-management training for people with chronic disease: Are changes maintained over time? Br J Health Psychol 2005;10(Pt 4). 589−99. PMID: 10.1348/135910705X26317. PMID: 16238867.ArticlePubMed
- 14. Lorig KR, Sobel DS, Ritter PL, et al. Effect of a self-management program on patients with chronic disease. Eff Clin Pract 2001;4(6). 256−62.PubMed
- 15. Jeon M, Park Y. Structural equation modeling of self-management of liver transplant recipients. J Korean Acad Nurs 2017;47(5). 663−75. PMID: 10.4040/jkan.2017.47.5.663. PMID: 29151563.ArticlePubMed
- 16. Polit DF, Sherman RE. Statistical power in nursing research. Nurs Res 1990;39(6). 365−9. PMID: 10.1097/00006199-199011000-00010. PMID: 2092311.ArticlePubMed
- 17. Williams GC, Grow VM, Freedman ZR, et al. Motivational predictors of weight loss and weight-loss maintenance. J Pers Soc Psychol 1996;70(1). 115−26. PMID: 10.1037/0022-3514.70.1.115. PMID: 8558405.ArticlePubMedPDF
- 18. Deci EL, Ryan RM. Self-determination theory: a macrotheory of human motivation, development, and health. Canadian Psychology 2008;49(3). 182−5. PMID: 10.1037/a0012801.Article
- 19. Lee E, Park J. A structural equation model on health behavior adherence for elders with prehypertension: Based on self-determination theory. J Korean Acad Fundam Nurs 2012;19(3). 343−52. PMID: 10.7739/jkafn.2012.19.3.343.ArticlePDF
- 20. Petkov J, Harvey P, Battersby M. The internal consistency and construct validity of the partners in health scale: Validation of a patient rated chronic condition self-management measure. Qual Life Res 2010;19(7). 1079−85. PMID: 10.1007/s11136-010-9661-1. PMID: 20437206.ArticlePubMedPDF
- 21. Baron RM, Kenny DA. The moderator-mediator variable distinction in social psychological research: conceptual, strategic, and statistical considerations. J Pers Soc Psychol 1986;51(6). 1173−82. PMID: 10.1037/0022-3514.51.6.1173. PMID: 3806354.ArticlePubMedPDF
- 22. Lee SG, Bae SS. The relationship between treatment intention and compliance in newly detected hypertensive patients. J Prev Med Public Health 2001;34(4). 417−26.
- 23. Ciechanowski PS, Katon WJ, Russo JE, et al. The patient-provider relationship: attachment theory and adherence to treatment in diabetes. Am J Psychiatry 2001;158(1). 29−35. PMID: 10.1176/appi.ajp.158.1.29. PMID: 11136630.ArticlePubMed
- 24. Ryan RM, Patrick H, Deci EL, et al. Facilitating health behaviour change and its maintenance: Interventions based on self-determination theory. Eur Health Psychol 2008;10(1). 2−5.
- 25. Park AR. A structural model of health behavior compliance in patients with percutaneous coronary intervention based on self-determination theory. J East West Nurs Res 2018;24(2). 101−9.
- 26. Ng JY, Ntoumanis N, Thøgersen-Ntoumani C, et al. Self-determination theory applied to health contexts: A meta-analysis. Perspect Psychol Sci 2012;7(4). 325−40. PMID: 10.1177/1745691612447309. PMID: 26168470.ArticlePubMed
- 27. Halvari AEM, Halvari H. Motivational predictors of change in oral health: An experimental test of self-determination theory. Motiv Emotion 2006;30(4). 295−306. PMID: 10.1007/s11031-006-9035-8.ArticlePDF
- 28. La Guardia JG, Ryan RM, Couchman CE, et al. Within-person variation in security of attachment: A self-determination theory perspective on attachment, need fulfillment, and well-being. J Pers Soc Psychol 2000;79(3). 367−84. PMID: 10.1037/0022-3514.79.3.367. PMID: 10981840.ArticlePubMedPDF
References
Figure 1Autonomy and relatedness have been shown to have a mediating effect in the relationship between healthcare provider’s autonomy support and self-management.

Table 1Difference in self-management according to sociodemographic and clinical characteristics of participants (N = 148).
| Characteristics | Categories | n (%) | Mean ± SD | t or F (p) |
|---|---|---|---|---|
| Gender | Men | 48 (32.4) | 77.48 ± 14.38 | 0.69 (0.490) |
| Women | 100 (67.6) | 75.71 ± 14.65 | ||
|
|
||||
| Age (y) | < 60 | 91 (61.5) | 77.03 ± 14.77 | 0.79 (0.430) |
| ≥ 60 | 57 (38.5) | 75.09 ± 14.21 | ||
|
|
||||
| Education | ≤ Middle school | 31 (20.9) | 72.42 ± 16.08 | −1.67 (0.096) |
| ≥ High school | 117 (79.1) | 77.31 ± 14.00 | ||
|
|
||||
| Spouse | Yes | 113 (76.4) | 76.12 ± 14.80 | −0.25 (0.801) |
| No | 35 (23.6) | 76.83 ± 13.86 | ||
|
|
||||
| Religion | Yes | 104 (70.3) | 78.35 ± 12.49 | 2.36 (0.022) |
| No | 44 (29.7) | 71.41 ± 17.74 | ||
|
|
||||
| Job | Yes | 46 (31.1) | 76.20 ± 15.56 | −0.05 (0.961) |
| No | 102 (68.9) | 76.32 ± 14.14 | ||
|
|
||||
| Patient’s support group | Yes | 19 (12.8) | 77.63 ± 10.52 | 0.43 (0.667) |
| No | 129 (87.2) | 76.09 ± 15.06 | ||
|
|
||||
| Cancer type | Breast | 21 (14.2) | 74.52 ± 14.38 | 1.80 (0.117) |
| Thyroid | 31 (20.9) | 70.65 ± 16.58 | ||
| Gynecological | 43 (29.1) | 76.70 ± 14.43 | ||
| Gastrointestinal | 30 (20.3) | 78.93 ± 13.79 | ||
| Lung | 11 (7.4) | 80.45 ± 12.60 | ||
| Other* | 12 (8.1) | 82.00 ± 9.54 | ||
|
|
||||
| Treatment | Surgery | 26 (17.6) | 76.00 ± 16.22 | 0.61 (0.720) |
| Chemotherapy | 26 (17.6) | 77.31 ± 15.60 | ||
| Radiation therapy | 7 (4.7) | 75.57 ± 14.03 | ||
| Sur+Che | 31 (20.9) | 77.16 ± 14.02 | ||
| Sur+Rad | 18 (12.2) | 71.00 ± 13.61 | ||
| Che+Rad | 12 (8.1) | 80.67 ± 14.59 | ||
| Sur+Che+Rad | 28 (18.9) | 76.63 ± 13.69 | ||
|
|
||||
| Duration of diagnosis (y) | < 2 | 57 (38.5) | 76.70 ± 13.70 | 0.53 (0.591) |
| 2–5 | 57 (38.5) | 77.37 ± 15.21 | ||
| > 5 | 34 (23.0) | 74.06 ± 15.72 | ||
|
|
||||
| Current treatment | Yes | 102 (68.9) | 76.58 ± 15.17 | 0.37 (0.715) |
| No | 46 (31.1) | 75.63 ± 13.17 | ||
|
|
||||
| Comorbid disease | Yes | 62 (41.9) | 76.06 ± 12.73 | −0.16 (0.877) |
| No | 86 (58.1) | 76.44 ± 15.79 | ||
Table 2Descriptive statistics of healthcare provider’s autonomy support, basic psychological needs, and self-management (N = 148).
Table 3Correlations among healthcare provider’s autonomy support, basic psychological needs, and self-management (N = 148).
Table 4Mediating effect of basic psychological needs in relationship between healthcare provider’s autonomy support and self-management (N = 148).
Figure & Data
References
Citations
Citations to this article as recorded by 
- Validation of the Korean Version of the Health Care Climate Questionnaire among Cancer Survivors
Hyun-E Yeom, Jungmin Lee, Young-Joo Kim
Healthcare.2024; 12(3): 323. CrossRef - Development of Integrated Supportive Care Nursing Competence Scale for Cancer Survivors
Eun-Jung Bae, Yun-Hee Kim
Healthcare.2024; 12(7): 755. CrossRef - Factors associated with self‐management after hybrid revascularization in patients with peripheral artery disease: A structural equations model
So‐Young Kim, Yun Mi Lee, Youn‐Jung Son
Journal of Advanced Nursing.2023; 79(1): 170. CrossRef - Structural equation modeling for associated factors with self-care behavior among young and middle-aged hypertensive patients: a cross-sectional study
Nam Jo Kim, Myung Kyung Lee
Contemporary Nurse.2023; 59(2): 99. CrossRef - Integrated, cross-sectoral psycho-oncology (isPO): a new form of care for newly diagnosed cancer patients in Germany
Michael Kusch, Hildegard Labouvie, Vera Schiewer, Natalie Talalaev, Jan C. Cwik, Sonja Bussmann, Lusine Vaganian, Alexander L. Gerlach, Antje Dresen, Natalia Cecon, Sandra Salm, Theresia Krieger, Holger Pfaff, Clarissa Lemmen, Lisa Derendorf, Stephanie St
BMC Health Services Research.2022;[Epub] CrossRef - Interaction styles of health care professionals supporting patients with chronic conditions in general hospitals towards self-management: one-year follow-up data from a brief educational intervention
Davy Vancampfort, James Mugisha
International Journal of Health Promotion and Educ.2022; : 1. CrossRef
 PubReader
 ePub Link
 Cite
Cite