
Articles
- Page Path
- HOME > Osong Public Health Res Perspect > Volume 5(6); 2014 > Article
-
Original Article
Antihematotoxic Role ofBunium persicum Seed Differential Extracts in Animal Model: Reactive Oxygen Species Might Be a Contributor - Tahir Ali, Kamran Saeed, Muhammad Abdullah, Iram Murtaza
-
Osong Public Health and Research Perspectives 2014;5(6):358-363.
DOI: https://doi.org/10.1016/j.phrp.2014.11.005
Published online: November 20, 2014
Signal Transduction Laboratory, Department of Biochemistry, Quaid-i-Azam University, Islamabad, Pakistan
- ∗Corresponding author. iram_murtaza@hotmail.comirambch@qau.edu.pk
• Received: August 11, 2014 • Revised: September 15, 2014 • Accepted: October 1, 2014
© 2014 Published by Elsevier B.V. on behalf of Korea Centers for Disease Control and Prevention.
This is an Open Access article distributed under the terms of the CC-BY-NC License (http://creativecommons.org/licenses/by-nc/3.0).
Abstract
-
Objectives
- Humans have been using plants as natural medicines since prehistoric times. Bunium persicum is a rich source of oils with different biological activities such as antioxidative and antimicrobial activities. The aim of this study is to evaluate the antihematotoxic and antioxidative effects of the differential extracts of B. persicum against leukemic blood induced hematotoxicity in an animal model.
-
Methods
- This study was performed on animals, which were divided into several groups: normal control, disease control, and groups that were administered with differential extracts of plants. We measured the concentration of free radical [reactive oxygen species (ROS)] and hematological parameters as blast cells from the tibia and femur in different groups.
-
Results
- The ROS level and blast cells count were higher in disease control groups than in groups treated with varying amounts of B. persicum extract and the normal group. Moreover, there was an imbalance in hematological parameters in untreated and treated groups with a correlation between free radicals and plant extract administration.
-
Conclusion
- These findings may indicate a possible link between free radicals and hematotoxicity and blast cells, while depicting a potential therapeutic role for B. persicum against ROS-induced hematotoxicity.
- Plants have been used as medicines since the dawn of civilization [1]. Bunium persicum is a high-value herbaceous spice of the parsley family (Apiaceae) used as a spice to add flavor to certain dishes and delicacies, and bakery perennial aromatic and medicinal umbel lifer [2]. B. persicum, also known as “black cumin” in English, is a common plant that is widely distributed in Gilgit, Baltistan, Chitral, Swat, Hazara, and Baluchistan in Pakistan [2,3].
- B. persicum is a rich source of essential oils including terpenoids and alkaloids with different biological activities such as antioxidant and antimicrobial effects [4]. Essential oils found in B. persicum have antifungal [5] and antimicrobial activities [6]. Seeds of B. persicum are rich in phenolic compounds and γ-terpinene, which exhibit potential antioxidant properties and can act as efficient free radical scavengers [7].
- Reactive oxygen species (ROS) are produced during natural metabolic processes in the form of superoxide (O2−), hydrogen peroxide (H2O2), hydroxyl radical (OH.), and singlet oxygen (1O2), which attack biological molecules leading to cell or tissue injury [8]. ROS have a pivotal role in signal transduction but in excess can contribute to fetal toxicity by deregulation of signal transduction and/or by oxidative damage to cellular macromolecules such as lipids, proteins, DNA, and RNA. Oxidative stress can lead to a number of human diseases such as atherosclerosis, inflammatory diseases, neurodegenerative disorders, and different types of cancers [9,10]. Wan and Winn [11] have reported that ROS play a major role in benzene-mediated fetal hematotoxicity in mice.
- These oxidative stresses are encountered by antioxidant compounds that prevent or delay the peroxidation of fats. Different types of synthetic antioxidants such as butylatedhydroxytoluene, butylatedhydroxyanisole, propyl gallate, and tertbutylhydroquinone are used as additives in food industries. These antioxidants, however, have been reported by researchers to be potential carcinogens and can cause external and internal bleeding and finally death owing to their effects on the blood coagulation factor [12]. Because of the hazardous effects of synthetic antioxidant additives, consumers have shown an increasing tendency to use additives from natural resources such as plant essential oils in foods, beverages, and cosmetics. The seeds of B. persicum are rich in essential oils, which have a potent antioxidant activity and can be used as natural antioxidants [13].
- In the present study, we examined the effects of different fractions of B. persicum seed extracts in leukemic blood induced hematotoxicity in rats. To achieve this goal, different seed fractions of B. persicum as well as ethyl acetate, butanol, hexane, and aqueous fractions were used, and their effects on various parameters including hematological parameters, ROS, aberrant protein expression, and blast cells of bone marrow were studied.
Introduction
- 2.1 Plant materials
- Plant materials (seeds) were purchased from a market in Rawalpindi, Pakistan. They were cleaned, washed, and dried under the shade. The seeds were then ground into fine powder with a grinder.
- 2.2 Preparation of crude extract and fractionation
- The procedure described by Wube et al [14] was followed for extraction. Briefly, the powdered residue (3 kg) was kept in a closed container and extracted with methanol by maceration for 4 days to obtain the crude extract (175 g). The solvent containing the crude extract was filtered with a Whatman filter paper (Number 1) and evaporated under reduced pressure using a rotary evaporator and allowed to dry at room temperature. The maceration process was repeated three times. The dried extract obtained was suspended in water and extracted with hexane, ethyl acetate, and butanol solvents subsequently using a separating funnel to obtain the ethyl acetate, butanol, hexane, and aqueous fractions. The solvent from each fraction was evaporated and allowed to dry. The dried fractions were kept at −2°C in dark glass bottles for experimentation.
- 2.3 Ethical considerations
- This study was carried out with the approval and under the strict guidelines of the institutional ethics committee for the handling of animals.
- 2.4 Experimental models
- Twenty-four albino neonate rats (birth age < 24 hours) were obtained from the Animal House of the Department of Biological Sciences, Quaid-i-Azam University, Islamabad, Pakistan, and randomly divided into six groups. One group was designated as the control normal group (Group C), whereas the other five groups (A, B, D, E, H) were injected intraperitoneally (i.p.) with fresh leukemic (acute myeloid leukemia) blood (0.2 mL; age, ≤ 24 hours) to induce hematotoxicity within 13–38 days [15].
- 2.5 Experimental design and treatment
- After the 40th day of injection, the weight of each rat was accurately measured, and rats were treated as follows: Group A, 300 mg/kg/d aqueous fraction in 0.5 mL Tween; Group B, 300 mg/kg/d butanol fraction in 0.5 mL Tween; Group C, 0.5 mL/d of 5% Tween; Group D, normal with leukemic blood treated, 0.5 mL/d of 5% Tween; Group H, 300 mg/kg/d hexane fraction in 0.5 mL Tween; Group E, 300 mg/kg/d of rat body weight ethyl acetate fraction in 0.5 mL Tween. The dosages were given as i.p. injections for 9 consecutive days. Table 1 shows the treatment schedule.
- 2.6 Hematological parameters
- After the treatment with plant differential extracts was completed, all rats were sacrificed on the 10th day by decapitation, and blood was collected and sent to North Western Laboratory Peshawar, Pakistan, to determine the blood parameters: white blood cells differential (monocytes, basophils, eosinophils, and neutrophils), red blood cells (RBCs; g/dL), and number of platelets.
- 2.7 Collection of bone marrow
- The bone marrow was collected from the both the tibia and the femur within hours after the rats were sacrificed. The bones were cleaned from the tissue, and the tips of each bone were cut down from one side and flushed out from the other side with 25-gauge needle with phosphate buffer saline into a falcon tube. The flushing was repeated several times until the bone turned pale. The filtrate was centrifuged at 1000 rpm for 10 minutes, and the supernatant was discarded. The fixative (1:3) acetic alcohol was added to the falcon tube and was gently mixed then centrifuged again to obtain a fresh cell button end; next, fresh fixative was added to obtain cell suspension. A drop was made from the cell suspension into a clear slide and allowed to dry. The air-dried smears of bone marrow aspirate were fixed in methanol for 8 minutes. The slides were then immersed in Giemsa stain for 10 minutes and washed with distilled water to remove the extra stain. Slides were observed under a light microscope (Meiji Techno MT6200) at 100× magnification.
- 2.8 ROS measurement
- The protocol described by Hayashi et al [16] was followed for the standard curve formation and ROS detection in all groups using spectrometric methods. To make standard solutions, in 0.1M sodium acetate buffer (pH 4.8), DEPPD (R1) was dissolved to obtain a final concentration of 100 μg/mL, and ferrous sulfate (R2) was dissolved in sodium acetate buffer to attain a final concentration of 4.37μM. R1 and R2 were mixed at a ratio of 1:25 prior to use to make a mixed solution. Then, 1200 μL of the mixed solution was added as a starter in a 3-mL cuvette followed by adding 1000 μL sodium acetate buffer and 60 μL hydrogen peroxide (H2O2) as positive control. Instead of H2O2, serum was used for ROS detection in the rat blood serum. After free incubation of 1 minute, absorbance at 505 nm was observed using the Agilent 8453 UV–Visible Spectrophotometer (UK).
- 2.9 Statistical analysis
- Data are expressed as mean ± standard deviation. SPSS version 16 (SPSS Inc., Chicago, IL, USA) was used for all statistical analyses. A p value < 0.05 was considered statistically significant.
Materials and methods
- 3.1 Hematological parameters and plant extracts
- Hematological parameters in various study groups treated with differential extracts of B. persicum seeds are presented in Table 2 and Figure 1. Group D (disease control group) showed an increase in monocytes, basophils, and eosinophils % values and a decrease in % neutrophils, RBC (g/dL), and platelets count when compared with their corresponding values among normal rats. Among the treated (butanol, ethyl acetate fraction) groups, % monocytes and % basophils decreased significantly when compared to Group D (normal leukemic blood induced group). Similarly, a significant increase was observed in RBCs (g/dL) and platelet concentration/counts compared with those of disease controls (Table 2, Figure 1). In the case of Group A (leukemic treated with aqueous fraction), platelet levels were observed to be elevated compared to the disease control group (Group D; Table 2, Figure 1), whereas % of monocytes and RBCs decreased.
- 3.2 Effects of plant extracts on ROS level
- Elevated concentrations of free radicals are considered toxic for biological systems.
- The level of free radicals in the hematotoxic group (Group D) was high compared with that of normal rats in Group C (Table 2). After the administration of plant extracts, a significant decrease in ROS was observed only in Group E, whereas in Group B the decrease was nearly significant (p = 0.059).
- 3.3 Effects of plants extracts on blast cells
- Large numbers of blast cells were observed in the disease control group as compared with the normal control group. The number of blast cells seen in EFT and BFT was lower compared with that of the disease control group but higher than that of the normal control group (Figure 2).
Results
- Regulation of ROS level is essential for maintenance of normal populations of hematopoietic stem cells and their differentiation in normal hemopoetic cell lines [17,18]. ROS in cancer can be targeted by the use of antioxidant molecules to suppress the high levels of ROS [19]. B. persicum is a rich source of essential oils including terpenoids, phenolic compounds, and alkaloids, and is known to have antioxidant and antimicrobial properties [4,7]. Different types of synthetic antioxidants such as butylatedhydroxytoluene, butylatedhydroxyanisole, propyl gallate, and tertbutylhydroquinone are used as additives in food industries. However, researchers have shown that these antioxidants are potential carcinogens and can cause internal and external bleeding and even death owing to their effects on blood coagulation factor. Because of these health-threatening effects of synthetic antioxidants, it becomes crucial to explore natural antioxidant compounds as safer substitutes. The seeds of B. persicum are rich in essential oils, which have a potent antioxidant activity [12]. Based on the antioxidant activity of B. persicum, we hypothesize that plant extracts may have antihematotoxic effects via an oxygen species-dependent mechanism.
- In the present investigation, our finding of increased ROS level compared to the normal group is in agreement with previous reports. The treatment using plant extracts such as EFT and BFT reduced the ROS level, suggesting that B. persicum plant extracts have a strong potential as antioxidants against free radicals. Surprisingly, we found decreased blast cell populations in EFT- and BFT-treated animals compared to the disease control animals. This showed a correlation of free radicals and blast cells; however, this concept may require further study.
- Blood is an important index of physiological and pathological status in man and animals, and the parameters usually measured are differential leukocyte (white blood cell) count, RBC count, and platelet counts [20,21]. In the present study, an imbalance in the blood picture was observed under diseased conditions. After the treatment, the action performed by B. persicum extracts in the regulation of monocytes, eosinophils, neutrophils, basophils, and RBCs under toxic conditions, showed their potential against toxicity.
- In summary, we have shown for the first time that B. persicum plant differential extracts possess antitoxic and antioxidative properties against leukemic blood induced hematotoxicity and free radicals, respectively. These findings suggest and emphasize that ethyl acetate and butanol fractions from the seed extract of B. persicum could be further characterized as a valuable therapeutic candidate for the treatment of patients with AML.
Discussion
- None.
Conflicts of interest
-
Acknowledgements
- Part of this research was funded by TWAS-COMSTECH research grant number: (RGA) No: 09-061 RG/PHA/AS_C-UNESCO FR: 3240220990.
Acknowledgments
-
This is an Open Access article distributed under the terms of the Creative Commons Attribution Non-Commercial License (http://creativecommons.org/licenses/by-nc/3.0) which permits unrestricted non-commercial use, distribution, and reproduction in any medium, provided the original work is properly cited.
Article information
- 1. Koehn F.E., Carter G.T.. The evolving role of natural products in drug discovery. Nat Rev Drug Discov 4(3). 2005 Mar;206−220. PMID: 15729362.ArticlePubMed
- 2. Sher H., Ali H., Rehman S.. Identification and conservation of important plant areas (IPAs) for the distribution of medicinal, aromatic and economic plants in the Hindukush–Himalaya mountain range. Pak J Bot 44:2012;187−194.
- 3. Panwar , Kalazeera K.. A low volume, high price crop for dry temperate hills. Ind Farmers Digest 25:1992;21−23.
- 4. Sharififar F., Yassa N., Mozaffarian V.. Bioactivity of major components from the seeds of Bunium persicum (Boiss.) Fedtch. Pak J Pharm Sci 23(3). 2010 Jul;300−304. PMID: 20566444.PubMed
- 5. Sardari S., Armin G.R., Micetich R.G., Daneshtalab M.. Phytopharmaceuticals: Part 1. Antifungal activity of selected Iranian and Canadian plants. Pharm Biol 36(3). 1998;180−188.Article
- 6. Oroojalian F., Kasra-Kermanshahi R., Azizi M., Bassami M.R.. Phytochemical composition of the essential oils from three Apiaceae species and their antibacterial effects on food-borne pathogens. Food Chem 120(3). 2010 Jun;765−770.Article
- 7. Shahsavari N., Barzegar M., Sahari M.A., Naghdibadi H.. Antioxidant activity and chemical characterization of essential oil of Bunium persicum. Plant Foods Hum Nutr 63(4). 2008 Dec;183−188. PMID: 18810640.ArticlePubMed
- 8. Gülçin I., Küfrevioglu O.I., Oktay M., Büyükokuroglu M.E.. Antioxidant, antimicrobial, antiulcer and analgesic activities of nettle (Urtica dioica L). J Ethnopharmacol 90:2004;205−215. PMID: 15013182.ArticlePubMed
- 9. Kukic J., Petrovic S., Niketic M.. Antioxidant activity of four endemic Stachys taxa. Biol Pharm Bull 29(4). 2006 Apr;725−729. PMID: 16595907.ArticlePubMed
- 10. Sinenko S.A., Hung T., Moroz T.. Genetic manipulation of AML1-ETO-induced expansion of hematopoietic precursors in a Drosophila model. Blood 116(22). 2010 Nov;4612−4620. PMID: 20688956.ArticlePubMed
- 11. Wan J., Winn L.M.. In utero exposure to benzene increases embryonic c-Myb and Pim-1 protein levels in CD-1 mice. Toxicol Appl Pharmacol 228(3). 2008 May;326−333. PMID: 18281070.ArticlePubMed
- 12. Juntachote T., Berghofer E.. Antioxidative properties and stability of ethanolic extracts of Holy basil and Galangal. Food Chem 92(2). 2005 Sep;193−202.Article
- 13. Zangiabadi M., Sahari M.A., Barzegar M.. Naghdi Badi H. Zataria multiflora and Bunium persicum essential oils as two natural antioxidants. J Med Plant 11(41). 2012 Mar;8−21.
- 14. Wube A.A., Streit B., Gibbons S., Asres K., Bucar F.. In vitro12(S)-HETE inhibitory activities of naphthoquinones isolated from the root bark of Euclea racemosa ssp. schimperi. J Ethnopharmacol 102(2). 2005 Nov;191−196. PMID: 16019177.ArticlePubMed
- 15. Huggins C.B., Sugiyama T.. Production and prevention of two distinctive kinds of destruction of adrenal cortex. Nature 206(991). 1965 Jun;1310−1314. PMID: 5838240.ArticlePubMed
- 16. Hayashi I., Morishita Y., Imai K., Nakamura M., Nakachi K., Hayashi T.. High-throughput spectrophotometric assay of reactive oxygen species in serum. Mutat Res 631(1). 2007 Jul;55−61. PMID: 17499011.ArticlePubMed
- 17. Tothova Z., Kollipara R., Huntly B.J.. FoxOs are critical mediators of hematopoietic stem cell resistance to physiologic oxidative stress. Cell 128(2). 2007 Jan;325−339. PMID: 17254970.ArticlePubMed
- 18. Hole P.S., Darley R.L., Tonks A.. Do reactive oxygen species play a role in myeloid leukemias? Blood 117(22). 2011 Jun;5816−5826. PMID: 21398578.ArticlePubMed
- 19. Mochizuki T., Furuta S., Mitsushita J.. Inhibition of NADPH oxidase 4 activates apoptosis via the AKT/apoptosis signal-regulating kinase 1 pathway in pancreatic cancer PANC-1 cells. Oncogene 25(26). 2006 Jun;3699−3707. PMID: 16532036.ArticlePubMed
- 20. Olson H., Betton G., Robinson D.. Concordance of the toxicity of pharmaceuticals in humans and in animals. Regul Toxicol Pharmacol 32(1). 2000 Aug;56−67. PMID: 11029269.ArticlePubMed
- 21. Saha S., Mukhopadhyay M.K., Ghosh P.D., Nath D.. Effect of methanolic leaf extract of Ocimum basilicum L. on benzene-induced hematotoxicity in mice. Evid Based Complement Alternat Med 2012:2012;176385PMID: 22988471.ArticlePubMedPMCPDF
References
Figure 1Effect of differential fractions extracted from the seeds of Bunium persicum on different hematological parameters compared from CBC results and free radical concentration in serum. Groups A, B, E, and H were administered intraperitoneally (i.p.) with nontoxic dose of 300 mg/kg of rat body weight of each fraction in 5% Tween solution for 9 consecutive days. Groups C and D were assigned as vehicle controls and were only injected (i.p.) with 0.5 mL/d of 5% Tween solution. Mean values were compared using one-way ANOVA followed by Tukey test. *A p value < 0.05 indicates significant difference from the control disease (group D) values. (A) Percentage of basophils in different groups. (B) % of eosinophils. (C) % of neutrophils. (D) Numbers of platelets. (E) RBC counts. (F) % of monocytes. (G) Level of ROS in different groups. ANOVA = analysis of variance; CBC = complete blood count; RBC = red blood cell; ROS = reactive oxygen species.
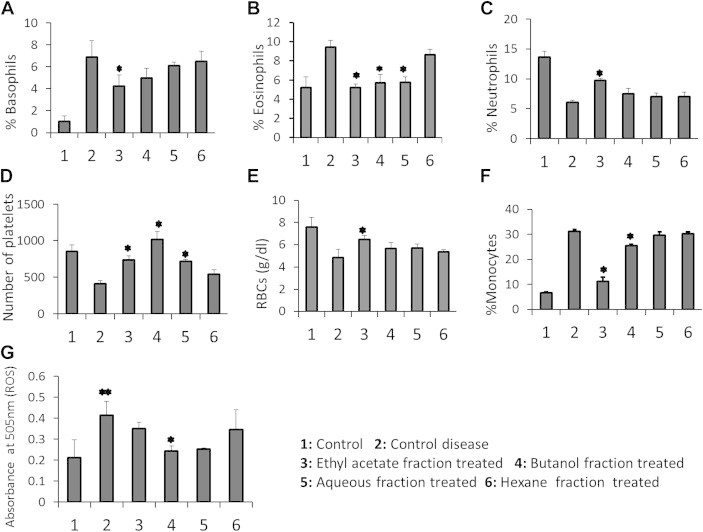
Figure 2Bone marrow smear stained with Giemsa stain. The blast cells are indicated by an arrow in each figure. (A) Control disease. (B) normal. (C) Blast cell in EFT. (D) Blast cells in BFT. BFT = .

Table 1Treatment schedule.
Table 2Variation of differential blood parameters and comparative analysis of ROS mean values among normal control, disease control, and treated groups.
Figure & Data
References
Citations
Citations to this article as recorded by 
- A Comprehensive Review of Bunium persicum: A Valuable Medicinal Spice
Sangita Bansal, Kanika Sharma, Vikrant Gautam, Ajaz Ahmad Lone, Era Vaidya Malhotra, Sandeep Kumar, Rakesh Singh
Food Reviews International.2023; 39(2): 1184. CrossRef - A Concise Overview of Phytochemistry, Pharmacology and Clinical Aspects of Persian Cumin; Bunium persicum (Boiss.) B.Fedtsch.
Mahkameh Moradi Mehrabadi, Mohammad M. Zarshenas
Current Drug Discovery Technologies.2021; 18(4): 485. CrossRef - The Effect of Bunium persicum (Boiss.) B. Fedtsch. Consumption on Metabolic Syndrome Indices, Muscle Strength, and Cardio-respiratory Function in Active Middle-aged Women: A Randomized Clinical Trial
Maryam Ahmadzadeh, Fatah Moradi, Saman Pashaei
Journal of Medicinal Plants.2020; 4(72): 143. CrossRef - Screening in vivo antioxidant and haematological properties of sumac and acorn bioactive rich extracts
Abdullah Dalar, Abdulahad Dogan, Aydin Sukru Bengu, Muzaffer Mukemre, Ismail Celik
Industrial Crops and Products.2018; 124: 20. CrossRef
 PubReader
 Cite
Cite

