
Articles
- Page Path
- HOME > Osong Public Health Res Perspect > Volume 6(2); 2015 > Article
-
Original Article
Gastric and Esophageal Cancers Incidence Mapping in Golestan Province, Iran: Using Bayesian–Gibbs Sampling - Atefeh-Sadat Hosseintabar Marzonia, Abbas Moghimbeigib, Javad Faradmalb
-
Osong Public Health and Research Perspectives 2015;6(2):100-105.
DOI: https://doi.org/10.1016/j.phrp.2015.01.004
Published online: February 19, 2015
aGolestan Research Center of Gastroenterology and Hepatology, Golestan University of Medical Sciences, Golestan, Iran
bModeling of Noncommunicable Diseases Research Center, Department of Biostatistics and Epidemiology, School of Public Health, Hamadan University of Medical Sciences, Hamadan, Iran
- ∗Corresponding author. moghimb@yahoo.commoghimbeigi@umsha.ac.ir
© 2015 Published by Elsevier B.V. on behalf of Korea Centers for Disease Control and Prevention.
This is an Open Access article distributed under the terms of the CC-BY-NC License (http://creativecommons.org/licenses/by-nc/3.0).
Abstract
-
Objectives
- Recent studies of esophageal cancer (EC) and gastric cancer (GC) have been reported to have high incidence rates of these cancers in Golestan Province of Iran. The present study describes the geographical patterns of EC and GC incidence based on cancer registry data and display statistically significant regions within this province.
-
Methods
- In order to map the distribution of upper gastrointestinal cancer, relative risk (RR) were calculated. Therefore, to estimate a more reliable RR, Poisson regression models were used. The adjusted models (adjusted to urban–rural area, sex, and grouped age proportion) were utilized. We considered two-component random effects for each observation, an unstructured (noncorrelated) and a group of “neighbor” (correlated) heterogeneities. We estimated the model parameters using Gibbs sampling and empirical Bayes method. We used EC and GC data that were registered with Golestan Research Center of Gastroenterology and Hepatology in the years 2004–2008.
-
Results
- The EC and GC maps were drawn for 2004–2008 in the province. Kalaleh and Minoodasht counties have a high RR of EC and GC in the years of study. In almost all years, the areas with a high RR were steady.
-
Conclusion
- The EC and GC maps showed significant spatial patterns of risk in Golestan province of Iran. Further study is needed to multivariate clustering and mapping of cancers RRs with considering diet and socioeconomic factors.
- About 70,000 new cases of cancer were diagnosed in the Iranian population in 2008 [1]. Esophageal cancer (EC) is the second and the third most common malignancy in Iranian men and women, respectively [2]. Also, gastric cancer (GC) is a major problem in the world and it is the second leading cause of cancer deaths [3]. The incidence rate of EC/GC is 6.25/8.89 and 5.83/15.21 for women and men, respectively (during the period 2005–2006) [4]. The northeastern part of Iran is known as the high-risk regions of the EC and GC in both male and female sexes [5]. Golestan is one of the northern provinces of Iran. The age-standardized incidence rate (ASR) per 100,000 person–years of EC in Gonbad (a county in Golestan, Iran) is > 100 and this city is one of the high risk areas in the world [2]. The estimations of ASR (per 100,000) of EC are 17.6 and 14.4 in Iran [6] and 43.3 and 36.3 in the province for men and women, respectively [2]. Preliminary research carried out by the Iran cancer institute has shown that EC accounts for about 9% of all cancers and 27% of digestive cancers, and its prevalence in men is about 1.7 times higher than in women [4]. Recent research has reported that ASR (per 100,000) of GC in Iran is about 26.1 in and 11.1 in women [6].
- In recent years, several studies have been conducted to map the geographical spread of EC and GC incidence using adjusted age-specific standardized incidence ratio (SIR) in the southwest of the Caspian Sea from 2001 to 2005 [7,8]. The previous studies have considered counties of northern provinces of Iran as clustered. Most counties of Golestan are in the high-risk incidence rate cluster [7,8]. However, the incidences of these cancers are not the same in all regions of the province, despite being in a high-risk cluster. The purpose of this study is to evaluate and adjust EC and GC for contextual risk factors from 2004 to 2008, then identify counties in Golestan province that have the highest observed count/expected count of these cancers compared with other regions within this province. Comparison with the results of other studies over the years can also be valuable.
Introduction
- 2.1 Study population
- The population this study was residents of Golestan province. The estimated midyear population between 2004 and 2008 that are stratified by sex, age (≤ 69 years and > 69 years), and place of residence (urban or rural) was obtained from the statistical center of Iran. The occurrences of new cases of EC and GC during a period of 4 years (2004–2008) were established from Golestan Research Center of Gastroenterology and Hepatology. The cancers were registered with procedures that are widely established throughout the world by the International Agency for Research on Cancer, the International Association of Cancer Registries, and the World Health Organization.
- 2.2 Statistical analysis
- In many studies, the response variable is the counts of rare events, such as the number of new cancer cases in the population during a specified time. In such cases it is assumed that the response variable has a Poisson distribution [9]. In this study, SIR, the ratio of observed new cases (
- The SIR is a crude estimate of underlying regional-specific relative risks (RR). Hence smoothed estimates of RR for disease mapping were calculated using empirical Bayes method. We suppose that
- In the model for RR to account heterogeneity, we considered two-component random effects for each observation, an unstructured (noncorrelated heterogeneity) and a group of “neighbor” (correlated heterogeneity) random effects [10–12]. This model has been presented and extended for disease mapping and clustering [13,14]. It is formulated as follows:where
- The RR adjusted for the effect of the residential area (rural = 0; urban = 1), sex (male = 0; female = 1), and grouped age (< 69 years = 0; ≤ 69 years = 1) as:
- We used OpenBUGS version 3.1.2 (produced by Medical Research Council (MRC) and Imperial College, UK), the Bayesian analysis of complex statistical software to estimate parameters of the model with the Gibbs–Bayesian method. We considered two independent Markov chains. To ensure the convergence of chains, after visual inspections, we used Gelman–Rubin, Geweke, Raftery–Lewis, and Heidelberg–Welch diagnostic tests via R using the coda package [12,15]. After a sufficient (10,000) burn-in to remove the effects of the initials, the following 100,000 iterations were sampled from each of the two chains choosing lag = 10 to avoid possible autocorrelation. We considered multivariate normal as a prior for
Materials and methods
- The total numbers of new cases of the EC and GC during the study period (2004–2008) were 1100 and 1122, respectively. The mean (standard deviation) age of EC and GC cases were 64.96 (11.919) and 65.16 (12.975), respectively. 56.6% of EC and 70.9% of GC cases were male and 32.7% of EC and 42.2% of GC cases were resident in urban areas.
- Adjustment models by area (urban–rural), sex, and age effects to log (RR) fitted. Table 1 shows 2.5%, median and 97.5% of posterior distributions of model parameters in the years. This reveals that none of the covariates significantly affects the (logarithm of) RR of EC and GC.
- Table 2 shows the median, and 2.5 percentile and 97.5 percentile in the RR (observed counts/expected counts) of diseases. In Kalaleh, the RR of EC is higher than other counties, such that the 2.5 percentile of the RR is > 1 in every year. Figure 1 shows geographic boundaries of the province. As adjusted models show (Table 2) the covariates of study are not significant and when we mapped RR of GC and EC separately for both genders, the results were similar. We decided to map RR separately in years. Figures 2 and 3 show geographical patterns of EC and GC in the province. In these figures the counties were clustered into four groups; counties with: RR < 0.6, 0.6 ≤ RR < 0.75, 0.75 ≤ RR < 0.90, 0.9 ≤ RR < 1.3, and RR > 1.3. It is clearly shown that Kalaleh, Minoodasht, and Gonbad have a higher RR of EC and GC than other counties in almost all years.
Results
- In this study, we have created separate maps of EC and GC disease in the counties of Golestan province during 2004–2008. For comparison of incidence rates in the counties, we adjusted RR with sex (male, female), age (< 69 years, ≥ 69 years) resident in the region (rural, urban) populations. Based on the results of modeling and mapping for RR of EC and GC, it has been observed, the RR is higher for some counties and it highlights the possible role of geographical and cultural differences. According to Figure 2, Kalaleh and Minoodasht (except in 2007) have experienced a higher risk of incidence of EC than expected. After these two counties, Gonbad has a high RR of EC. In the previous study in the Caspian region of Iran (Mazandaran and Golestan provinces) using data collected during 2001–2005, Kalaleh, Minoodasht, Azadshahr, and Gonbad have higher risk of incidence of EC (≥ 1.33 times the expected) in both sexes [7]. In a recent study, adjusted on a diet and socioeconomic factors, it was found that all regions of Golestan province have high standardized incidence rates of EC/GC [8]. We found that Gonbad has the highest; and Kalaleh and Minoodasht have a high RR of GC in both genders. Also, almost in all years, the areas with a high RR have been steady.
- Our study investigated the geographical distributions of new GC/EC cases to determine the counties at a high risk of cancer incidence. Our results are somewhat similar to the previous studies that include this province or neighborhood provinces [7]. Mohebbi et al [8] have adjusted the RR of EC and GC to diet and socioeconomic factors in the province and neighboring areas. Multivariate clustering and mapping of cancers RRs with considering diet and socioeconomic factors are interesting for future studies.
Discussion
- The authors declare that they have no conflicts of interest.
Conflicts of interest
-
Acknowledgements
- We would like to thank Golestan Research Center of Gastroenterology and Hepatology, Golestan University of Medical Sciences on data handling. This study was a part of the MSc student's dissertation (Atefeh-Sadat Hosseintabar Marzoni) in Hamadan University of Medical Sciences.
Acknowledgments
-
This is an Open Access article distributed under the terms of the Creative Commons Attribution Non-Commercial License (http://creativecommons.org/licenses/by-nc/3.0) which permits unrestricted non-commercial use, distribution, and reproduction in any medium, provided the original work is properly cited.
Article information
- 1. Ramezani Gourabi B.. Recognition of geographical diffusion esophagus cancer in southwestern of Caspian Sea. Am J Sci 7(2). 2011 Feb 25;297−302.
- 2. Sadjadi A., Marjani H., Semnani S.. Esophageal cancer in Iran: a review. Mid E J Cancer 1(1). 2010 Jan;5−14.
- 3. Kamangar F., Dores G.M., Anderson W.F.. Patterns of cancer incidence, mortality, and prevalence across five continents: defining priorities to reduce cancer disparities in different geographic regions of the world. J Clin Oncol 24(14). 2006 May 10;2137−2150. PMID: 16682732.Article
- 4. Kolahdoozan S., Sadjadi A., Radmard A.. Five common cancers in Iran. Arch Iran Med 13(2). 2010 Mar;143−146. PMID: 20187669.PubMed
- 5. Mahboubi E., Kmet J., Cook P.J.. Oesophageal cancer studies In the Caspian Littoral of Iran: the Caspian cancer registry. Br J Cancer 28(3). 1973 Sep;197−214. PMID: 4743904.ArticlePubMed
- 6. Sadjadi A., Nouraie M., Mohagheghi M.A.. Cancer occurrence in Iran in 2002, an International perspective. Asian Pacific J Cancer Prev 6(3). 2005 Jul–Sep;359−363.
- 7. Mohebbi M., Mahmoodi M., Wolfe R.. Geographical spread of gastrointestinal tract cancer incidence in the Caspian Sea region of Iran: Spatial analysis of cancer registry data. BMC Cancer 8:2008 May 14;137PMID: 18479519.Article
- 8. Mohebbi M., Wolfe R., Jolley D.. The spatial distribution of esophageal and gastric cancer in Caspian region of Iran: An ecological analysis of diet and socio-economic influences. Int J Health Geogr 10:2011 Feb 15;13PMID: 21324144.Article
- 9. Agresti A.. An introduction to categorical data analysis. Second ed.2007. John Wiley& Sons.
- 10. Lawson A., Browne W., Rodeiro C.. Disease Mapping with Winbugs and MLwiN. 2003. John Wiley & Sons.
- 11. Lawson A., Williams F.. An introduction guide to disease mapping. 2001. John Wiley& Sons.
- 12. Ntzoufras I.. Bayesian modeling using WinBUGS. 2009. Wiley.
- 13. Clayton D., Kaldor J.. Empirical Bayes estimates of age-standardized relative risks for use in disease mapping. Biometrics 43(3). 1987 Sep;671−687. PMID: 3663823.ArticlePubMed
- 14. Besag J., Newell J.. The detection of clusters in rare diseases. J R Stat Soc Series A Stat Soc 154:1991;143−155.Article
- 15. Plummer M., Best N., Cowles K.. CODA: Convergence diagnosis and output analysis for MCMC. R News 6(1). 2006;7−11.
References
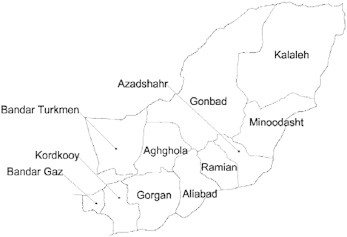
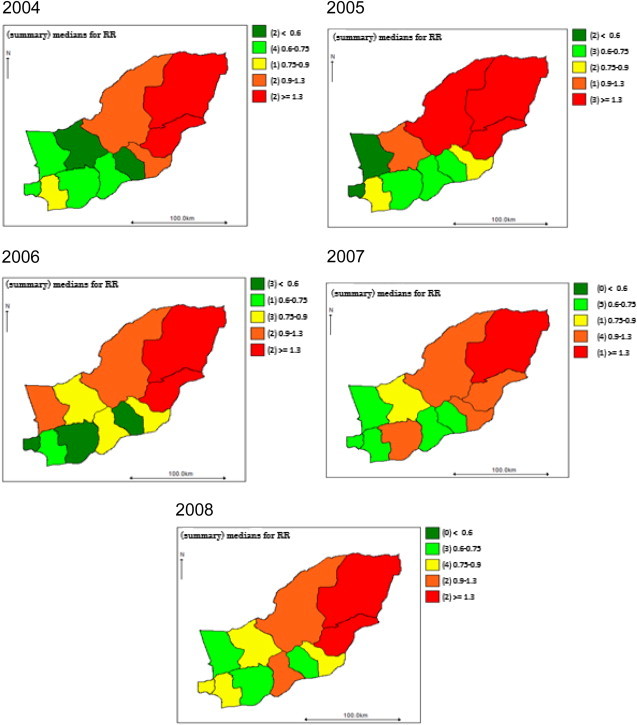
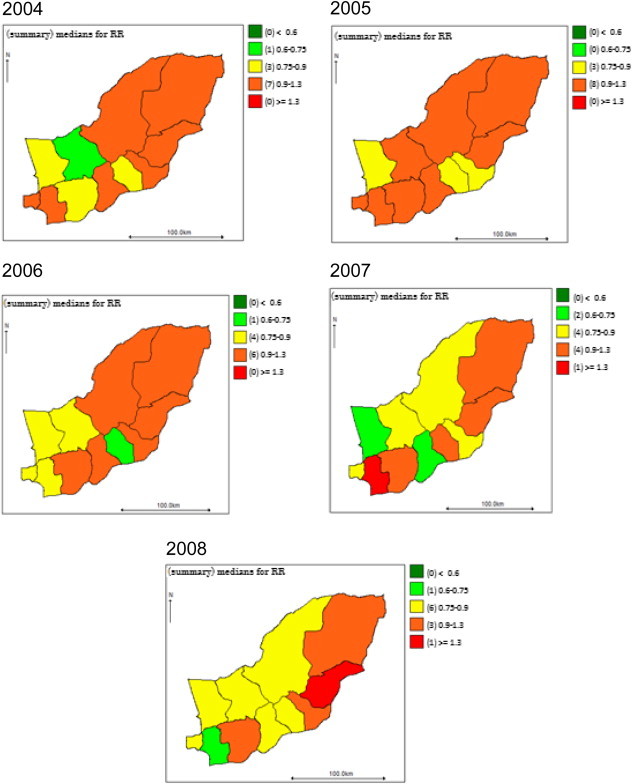
Figure & Data
References
Citations
- Design of risk prediction model for esophageal cancer based on machine learning approach
Raoof Nopour
Heliyon.2024; 10(2): e24797. CrossRef - Meat consumption and risk of esophageal and gastric cancer in the Golestan Cohort Study, Iran
Giulia Collatuzzo, Arash Etemadi, Masoud Sotoudeh, Arash Nikmanesh, Hossein Poustchi, Masoud Khoshnia, Akram Pourshams, Maryam Hashemian, Gholamreza Roshandel, Sanford M. Dawsey, Christian C. Abnet, Farin Kamangar, Paul Brennan, Paolo Boffetta, Reza Malek
International Journal of Cancer.2022; 151(7): 1005. CrossRef Epidemiologic Study of Gastric Cancer in Iran: A Systematic Review
Khadijeh Kalan Farmanfarma, Neda Mahdavifar, Soheil Hassanipour, Hamid Salehiniya
Clinical and Experimental Gastroenterology.2020; Volume 13: 511. CrossRef- Building cancer registries in a lower resource setting: The 10-year experience of Golestan, Northern Iran
Gholamreza Roshandel, Shahryar Semnani, Abdolreza Fazel, Mohammadreza Honarvar, MohammadHossein Taziki, SeyedMehdi Sedaghat, Nafiseh Abdolahi, Mohammad Ashaari, Mohammad Poorabbasi, Susan Hasanpour, SeyedAhmad Hosseini, SeyedMohsen Mansuri, Ataollah Jahan
Cancer Epidemiology.2018; 52: 128. CrossRef
 PubReader
 Cite
Cite


