
Articles
- Page Path
- HOME > Osong Public Health Res Perspect > Volume 11(4); 2020 > Article
-
Original Article
Secondhand Smoking Among Children in Rural Households: A Community Based Cross-Sectional Study in Bangladesh - Rishad Choudhury Robina, Narongsak Noosornb, Sheikh Mohammad Alifc
-
Osong Public Health and Research Perspectives 2020;11(4):201-208.
DOI: https://doi.org/10.24171/j.phrp.2020.11.4.09
Published online: August 31, 2020
aDepartment of Community Health, Faculty of Public Health, Naresuan University, Phitsanulok, Thailand
bFaculty of Public Health, Naresuan University, Phitsanulok, Thailand
cepartment of Epidemiology and Preventive Medicine, School of Public Health and Preventive Medicine, Monash University, Melbourne, Australia
- *Corresponding author: Rishad Choudhury Robin, Department of Community Health, Faculty of Public Health, Naresuan University, Phitsanulok, Thailand, Email: rcrobinbd@yahoo.com
• Received: December 26, 2019 • Revised: February 27, 2020 • Accepted: March 20, 2020
Copyright ©2020, Korea Centers for Disease Control and Prevention
This is an open access article under the CC BY-NC-ND license (http://creativecommons.org/licenses/by-nc-nd/4.0/).
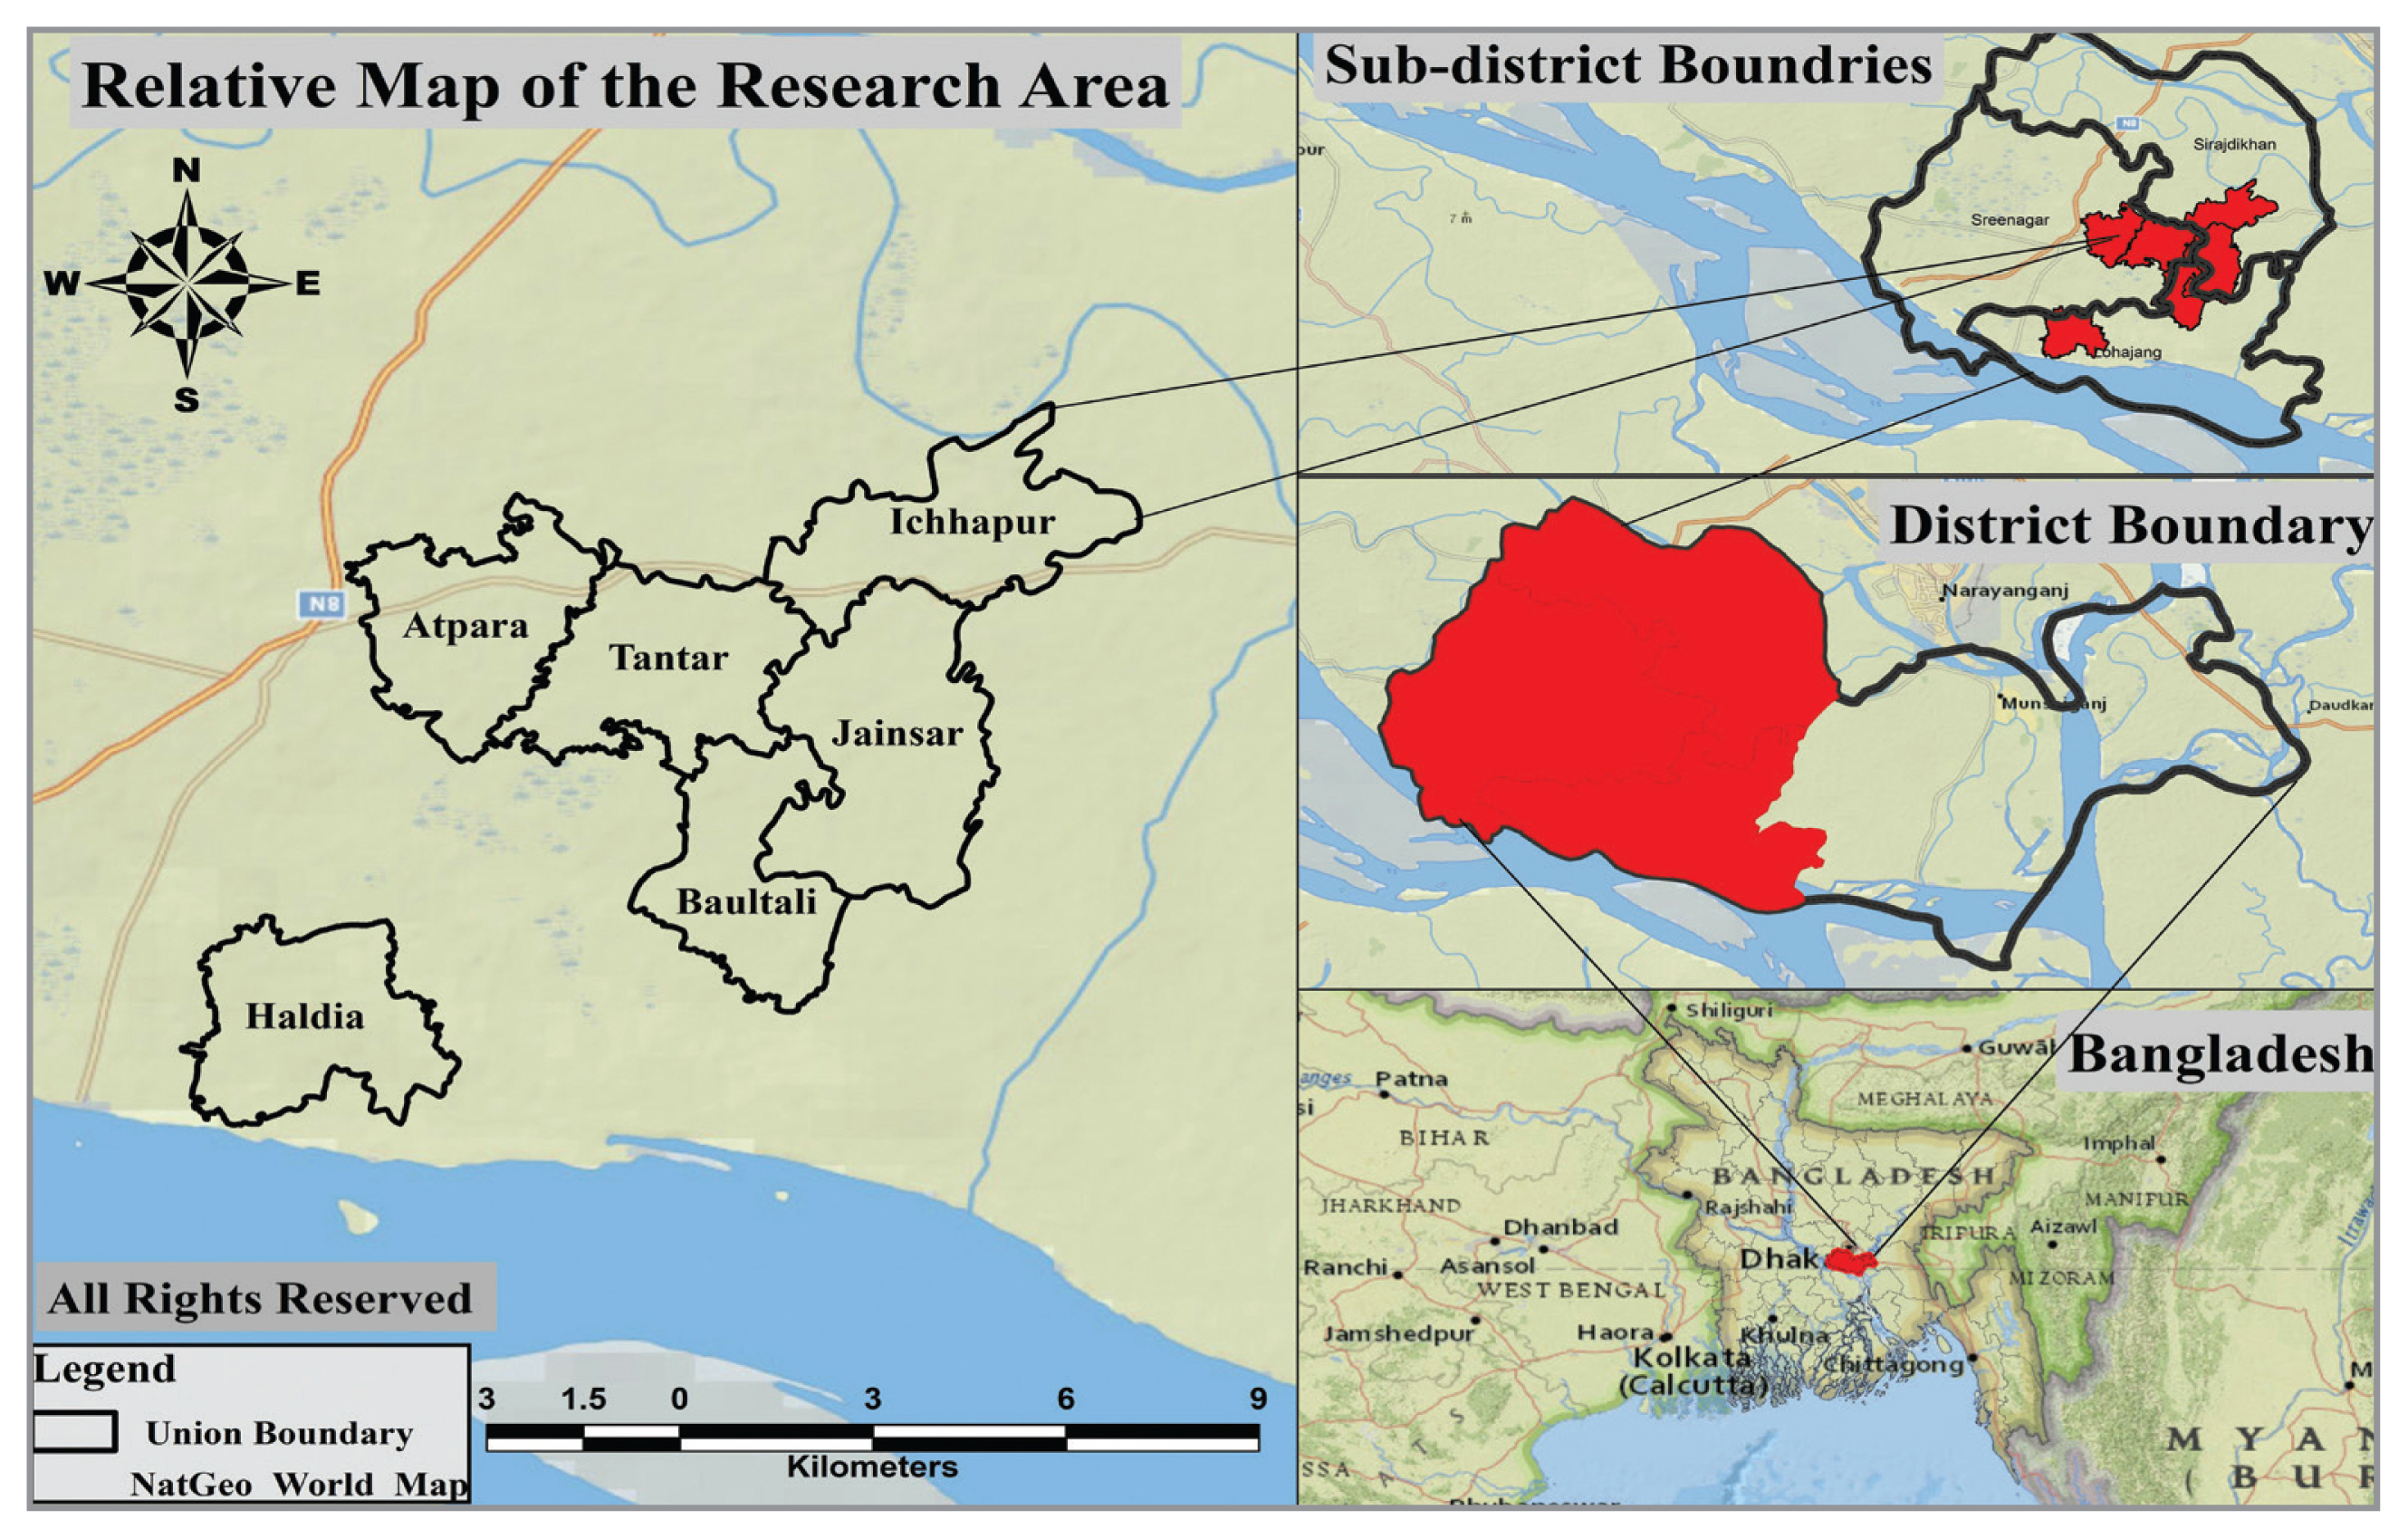
Figure & Data
References
Citations
Citations to this article as recorded by 
- Second Hand Smoke Exposure among Children in Indian Homes: Findings from the Global Adult Tobacco Survey
Jaya Prasad Tripathy
Behavioral Medicine.2024; 50(1): 75. CrossRef - Exposure to secondhand smoke is associated with poor sleep quality among non-smoking university students in Bangladesh: a cross-sectional survey
Md. Hasan Al Banna, Keith Brazendale, Mohammad Hamiduzzaman, Bright Opoku Ahinkorah, Mohammad Tazrian Abid, M. A. Rifat, Mst. Sadia Sultana, Justice Kanor Tetteh, Satyajit Kundu, Md Shaheenur Rahman Shekhar, Md Khaleduzzaman, Md. Nazmul Hassan
Scientific Reports.2023;[Epub] CrossRef - Need for sensitization on serious threats of second-hand smoke: Findings from a national study in Mauritius, a small island developing state in the Indian Ocean
Marie Chan Sun, Urmila D. Beeharry Panray, Jayrani Cheeneebash, Raj Gunesh
Preventive Medicine Reports.2022; 25: 101667. CrossRef - Muslim Communities Learning About Second-hand Smoke in Bangladesh (MCLASS II): a combined evidence and theory-based plus partnership intervention development approach
Ian Kellar, Zunayed Al Azdi, Cath Jackson, Rumana Huque, Noreen Dadirai Mdege, Kamran Siddiqi
Pilot and Feasibility Studies.2022;[Epub] CrossRef - Social measures for reducing exposure to secondhand
smoke in migrant workers of sugarcane harvest in the lower
northern region of Thailand
Narongsak Noosorn, Anukool Manoton, Rishad Choudhury Robin
Tobacco Induced Diseases.2021; 19(September): 1. CrossRef
 PubReader
 ePub Link
 Cite
Cite
