Skip Navigation
Skip to contents

PHRP : Osong Public Health and Research Perspectives

OPEN ACCESS
SEARCH
Search

Articles

Page Path
HOME > Osong Public Health Res Perspect > Volume 11(4); 2020 > Article
Original Article
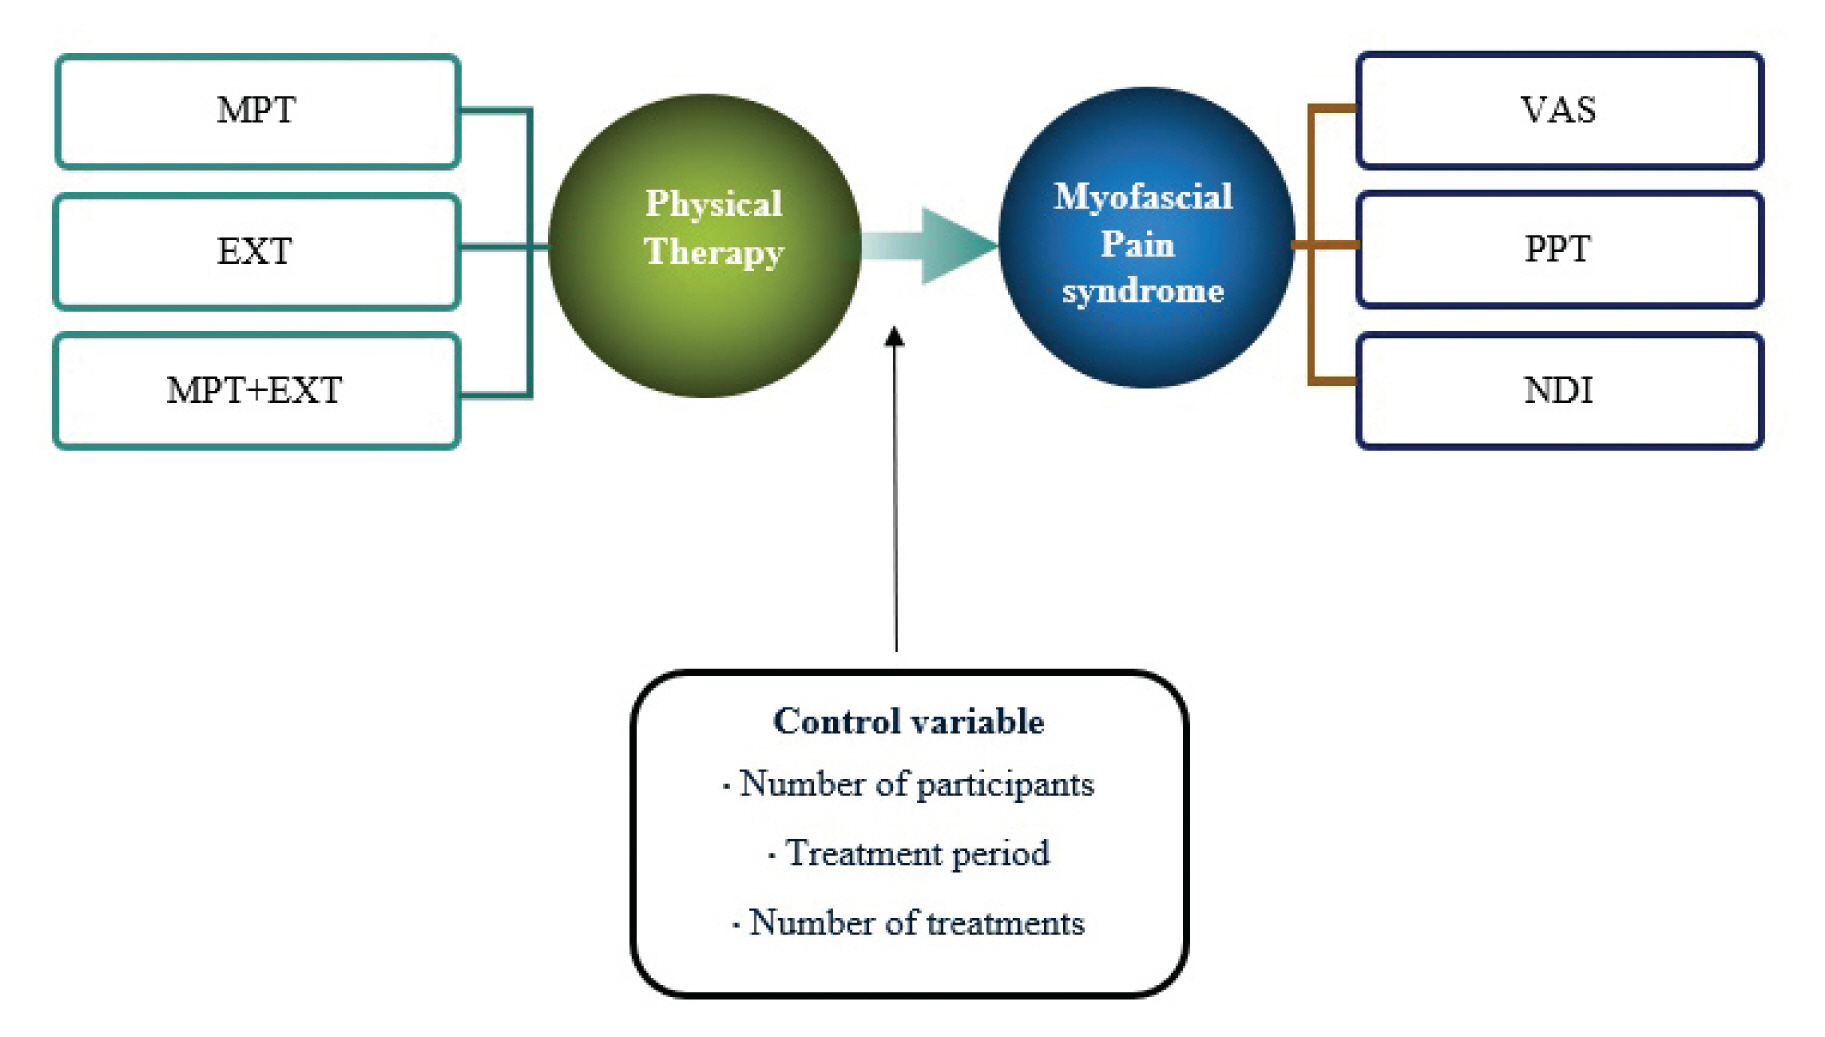
Meta-Analysis of the Effects of Physical Modality Therapy and Exercise Therapy on Neck and Shoulder Myofascial Pain Syndrome
Chan-Myeong Kima, Ji-Won Parkb
Osong Public Health and Research Perspectives 2020;11(4):251-258.
DOI: https://doi.org/10.24171/j.phrp.2020.11.4.15
Published online: August 31, 2020

aKorea Safety Health Environment Foundation. Work Environment Health Center, Cheongju, Korea

bDepartment of Physical Therapy, College of Medical Science, Catholic University of Daegu, Gyeongsan, Korea

*Corresponding author: Ji-Won Park, Department of Physical Therapy, College of Medical Science, Catholic University of Daegu, Gyeongsan, Korea, E-mail: mylovept@daum.net
• Received: March 13, 2020   • Revised: April 30, 2020   • Accepted: May 19, 2020

Copyright ©2020, Korea Centers for Disease Control and Prevention

This is an open access article under the CC BY-NC-ND license (http://creativecommons.org/licenses/by-nc-nd/4.0/).

  • 6,490 Views
  • 144 Download
  • 1 Web of Science
  • 2 Crossref
  • 1 Scopus
  • Objectives
    The main purpose of this study was to identify the effects of physical therapy modalities and exercise therapy on myofascial pain syndrome by assessing the degree of effect size (ES) and related variables.
  • Methods
    Related studies published between 1st January 2008 and 31st December 2019were retrieved from national [KCI, RISS, National Assembly Library and DBpia (n = 405)] and international [PubMed, Embase, Google Scholar and Cochrane library (n = 1,600)] databases. According to the selection criteria, 25 studies were selected for review.
  • Results
    The degree of ES in the physical therapy and exercise therapy combined group (1.83) showed the largest mean ES. The size of the effect according to the number of people to be treated was 41 or more (1.64), and showed the largest mean ES. The size of the effect according to treatment period was 16 to 30 days (1.41). The size of the effect for 6 to 10 treatments (1.51) showed the largest mean ES. Trim and fill results showed that the calibration ES was 0.67.
  • Conclusion
    Physical therapy modalities and exercise therapy had a great effect on myofascial pain syndrome in the neck and shoulders, and the effect differed according to the methods of intervention, and the methods of evaluation.
Modern people live quickly and conveniently with the development of computers and smartphones, but the lack of exercise or being overweight has led to increased levels of obesity and an imbalance in the body due to sitting. In addition, cases of musculoskeletal-related conditions related to necks or shoulders are increasing [1]. These musculoskeletal-related illnesses account for the largest portion of occupational conditions/diseases, and have become an important consideration for the protection of workers health [2].
Pain caused by musculoskeletal-related conditions diseases increases fatigue with the onset of sleep disorders, and causes psychological stress such as emotional symptoms, and physical symptoms associated with the body [3]. In addition, body imbalances and various types of stress resulting from incorrect posture and bad habits cause muscle strain or muscle pain. Standing or sitting in the same position for a long time has a detrimental effect on muscles or joints. Furthermore, if a bad position is adopted whilst working, adverse effects such as muscle tension and muscle pain may worsen [4]. Myofascial pain syndrome, is a common musculoskeletal pain condition that may be experienced more than once in a lifetime. Myofascial pain syndrome has the potential to trigger pain but it also affects 54% of the adult female population and 45% of males without symptoms [5]. In those people where pain is reported, 50% to 85% report chronic pain caused by myofascial pain syndrome [6]. It has been reported that 55% of patients with chronic neck pain and headaches were primarily attributed to myofascial pain syndrome [7].
The Korean Standard Disease Classification Code M79, 110, indicated that parietal pain syndrome is a type of myofascial pain surrounding the muscle, characterized by associated pain in certain areas depending on the location of the point at which pain is caused [8]. Pain triggers tend to be formed mainly along the back and are typically formed in the upper part of the neck and shoulders. During muscle contraction and relaxation, since both the head and neck have many muscles, it is very important to identify the pain and treat these areas of the body, which may help to relax other parts of the body [9].
Myofascial pain syndrome is an important condition that a physical therapist and rehabilitation specialist must strive to address and provide the best treatment to patients. Systematic scientific evidence-oriented treatment must be performed. So far, many empirical studies have been conducted on the treatment of myofascial pain syndrome, but studies have mainly been performed to compare the effects of some treatments by applying them to limited groups. It is imperative to accumulate the results of a wide range of studies systematically and consistently. Therefore, through meta-analysis, myofascial pain syndrome in the neck and shoulders was systematically examined and effectiveness in mediating and evaluating treatment was analyzed to identify the relevant variables.
1. Design of research and procedures of research
Patients, intervention, comparison, and outcomes (PICO) of treatment for myofascial pain syndrome in the neck and shoulders, were considered in the experimental design of this pre-post meta-analysis study. Physical therapy intervention outcomes were compared and assessed using a visual measure of pain, the threshold for pressure pain, and the index for neck disorders.

1.1. A model of research

The model of this study was chosen to obtain the ES for the overall mean of physical therapy, review the effect on myofascial pain syndrome in the neck and shoulders, and to conduct a control effect and subgroup analysis to determine the difference in size of the effects of independent variables on dependent variables (Figure 1) [10].
2. Selection of data
The key question of the meta-analysis was “What are the relevant variables of physical therapy for myofascial pain syndrome?”

2.1. Criteria for selection

A study was included if patients were diagnosed with myofascial pain in the neck and shoulders and were undergoing physical therapy for myofascial pain syndrome, or an experimental study of pre- and post-design method, between January 1st, 2008 and December 31st, 2019.

2.2. Criteria for exclusion

A study was excluded if it applied diagnosis, medication, injection, acupuncture, and surgery to myofascial pain syndrome, was not a pre-post design method, did not present statistical analysis, or did not have full text in Korean or English.

2.3. Literature retrieval

The literature selection was conducted as a systematic literature review following the flow chart of preferred reporting items for systematic reviews and meta-analysis (PRISMA), with the research studies selected during the period from 1st January 2008 to 31st December 2019 [11].
The literature search involved 4 national databases (KCI, RISS, National Assembly Library and DBpia; N = 405), and 4 international databases (PubMed, Embase, Google Scholar and Cochrane library; N = 1,600) where myofascial pain was the medical subject heading.

2.4. Selection and management of literature

The selection process of the data was conducted by researchers and experts in the field of physical therapy. The management of the retrieved literature was entered into the literature management program Mendeley and Microsoft Excel 2019, and the primary confirmation was made through the title before the study was reviewed in detail, in full text, according to the selection criteria and exclusion criteria to confirm the selection of the literature.
A total of 2,005 studies were retrieved and reviewed during the primary search, and 183 were reviewed in full. There were 158 studies excluded (63 duplicate studies, 19 studies on other diseases, 38 studies whose results were inconsistent with the design of this study, 9 studies that were not available as full text, 10 studies that were not randomized clinical trials, and 19 studies that were not physical therapy). A total of 25 studies were included in the meta-analysis for this current study. The process of searching and selecting data was performed according to the PRISMA flow chart by summarizing characteristics and the process of searching and selecting data was conducted with a physical therapy specialist (Figure 2).
3. Risk of bias evaluation of research
The included 25 studies were assessed for risk of bias using verification tools and Review Manager programs (Version 5.3, Cochrane Collaboration). For each of the 7 items of risk of bias, the risk was shown as high (+), uncertain (?), and low (−) risk, and the study’s summary of the risk of bias (Figure 3).
4. Data coding
To determine the magnitude of the effect of the finally selected studies, a meta-analysis of a single group (pre-postmortem) was used, and only studies with values of the pre-average, post-average, and standard deviation were chosen. In addition, the data collected consisted of sheets of coding by entering the name of the researcher, type of treatment, type of intervention, method of assessment, number of patients, duration of treatment, number of years of treatment, published year, and study title, and the coding data was converted into the form of a csv file for use in the R program and used for analysis.
The assessment, which is a dependent variable of this study, consists of assessments that indicate the results of static (positive) and amulet (negative) effects. For the dependent variable pressure pain threshold (PPT), the number of post-mediation effect increases, so the magnitude of the effect shows positive results. In the case of dependent visual analogue scale (VAS) and neck disability index (NDI), negative results were shown in the size of the effect, since the number of post-mediation effects would be lower. In this case, the mixture of negative and positive results was an unreliable result. In addition, if the metadata analysis was carried out separately, the results were presented separately, so comprehensive conclusions of the metadata analysis could not be drawn.
To address this, the study calculated that the magnitude of the effects were all positive by changing the pre-average and standard deviation with the post-average and standard deviation values for VAS and NDI, which were assessments that show negative results, to address the problem and draw a comprehensive conclusion.
5. Analysis of data

5.1. Processing statistics

Statistics used “meta” and “metafor” in packages of the R Project for Statistical Computing Version 3.5.3. This study calculated the magnitude of the effect by applying a radio effect model, as each of the different arbitrarily types of studies of different researchers and acknowledged that diversity in risk of biases, methods of intervention, evaluation methods, number of patients, treatment period, number of treatments, age, gender, etc. existed. In addition, categorical variables were selected as Meta-ANOVA depending on the type of variable, and continuous variables were also analyzed for adjustment effects with Meta-Regulation.

5.2. Analysis of ES

The magnitude of the effect produced in this study was interpreted as a difference in the standardized mean, and the magnitude of the corrected effect is the same as that of Cohen’s. The ES of the standardized average difference was interpreted as a small ES for less than 0.20, and a medium effect for less than 0.20 and less than 0.80, and a large ES for more than 0.80 in size.
Cohen’s criteria for analyzing ES small ES: ESsm ≤ 0.20
medium ES: 0.20 < ESsm < 0.80
large ES: ESsm ≥ 0.80

5.3. Heterogeneity verification

Heterogeneity refers to the extent to which the magnitude of the effects of each study were distributed and the magnitude of the effects between studies were inconsistent. Thus, the goal of a meta-analysis is not to derive an average of the magnitude of the effect, but to understand the heterogeneity of the magnitude of the effect, or the overall pattern [12]. Values of Q and df are used to verify equivalence of the magnitude of effects among studies, the ratio of heterogeneity is represented by I2, and the statistics from I2 indicate the ratio of variances between actual studies of overall variability, and the degree of heterogeneity of ESs produced by individual studies [13].
I2 represents the ratio of actual (between studies) variances to total variances (total observational variances) and generally translates to a small degree of heterogeneity with I2 of 25%, and moderate heterogeneity with over 75% [13].
1. Overall ES of physical therapy modality and exercise therapy
The overall ES (1.32) of physical therapy modality and exercise therapy was large, according to the criteria presented by Cohen [14], and the ES was statistically significant at the 95% confidence intervals (CI) where the lower limit was 1.11 and upper limit was 1.54. The heterogeneity of the overall ES was significant (p < 0.0001). The expected variance value based on the effect of the population had a Q value of 423.13 with an expected variance value (df) of 62, and the actual variance ratio for between study variance value I2 was 85.3% or more (Table 1).
2. ES according to the type of treatment intervention
Analysis of the ES according to the type of treatment intervention are shown in Table 2. The number of cases is in the order of modality of physical therapy (MPT) (k = 28), exercise therapy (EXT) (k = 19), EXT+MPT (k = 16), and the magnitude of the effect is in the order of EXT+MPT (ES = 1.83), EXT (ES = 1.18) and MPT (ES = 1.13) all of which are of large ESs. In all cases at the 95% CIs, the difference in magnitude of the effect Q was 4.80 [df = 2 (p < 0.0907)] which was not statistically significant (Table 2).
3. ES according to the evaluation method
The magnitude of ES according to the methods of evaluation of physical therapy is shown in Table 3. The number of cases is in the order of VAS (k = 29), PPT (k = 23), and NDI (k = 11), and the ES is in the order of VAS (ES = 1.59), NDI (ES = 1.35), PPT (ES = 0.94), all of which are of large ESs. In all cases at the 95% CIs, the difference in magnitude of the effect Q was 8.19 [df = 2 (p < 0.0167)] which was statistically significant (Table 3).
4. Treatment ES according to the control variable

4.1. ES according to the number of participants

A large heterogeneity of the magnitude of the effect among physical therapy studies is shown, and the results of an analysis of the modulating variables according to the number of people to be treated are as shown in Table 4. The number of cases is not more than 20 (k = 47), 21 to 40 (k = 15), 41 or more (k = 1), 21 to 40 (ES = 1.64), not more than 20 (ES = 1.22), and 20 or less (ES = 1.22), all of which are large ESs. In all 95% CIs, the difference Q value in ES was 3.35 [df = 3 (p > 0.1876)] was not statistically significant (Table 4).

4.2. ES according to treatment period

The number of cases is in the order of 16 to 30 days (k = 28), 1 to 15 days (k = 25), 31 to 45 days (k = 6), 31 to 45 days (k = 6), 16 to 30 days (ES = 1.41), 1 to 15 days (ES = 1.27), and 46 to 60 days (ES = 0.84). In all cases at the 95% CIs, the difference in magnitude of the effect Q was 2.87 [df = 3 (p > 0.4125)] which was not statistically significant (Table 4).

4.3. ES according to the number of treatments

The number of cases is in the order of 6 to 10 (k = 37), 11 to 15 (k = 15), 16 or more (k = 8), 1 to 5 (k = 3), and the size of the effects is 6 to 10 (ES = 1.51), 11 to 15 (ES = 1.15), 1 to 5 (ES = 1.02), and 16 or more (ES = 0.90), all of which are large. In all cases at the 95% CIs, the difference in magnitude of the effect Q was 8.21 [df = 3 (p < 0.0418)] which was statistically significant (Table 4).
5. Analysis of publication errors
The analysis of publication errors was conducted on the 25 included studies and 63 cases of published errors were selected to verify whether the results of this meta-analysis study was reasonable, and the analysis of errors in the publication (using a model of ratio effects) confirmed right-hand deflection asymmetry (Figure 4). For a more objective judgement of asymmetry in the ES, statistical analysis was performed with Egger’s regression verification (Table 5). This is a verification method that describes the relationship between the ES of each study and the standard error, and the magnitude of the effects were observed to be linear (Figure 4). Egger’s regression analysis may reject the null hypothesis that if the p value of the standard error was statistically significant, the relationship between the ES and the standard error is statistically significant [15], if the p value is less than 0.05, the greater the ES would be. In this study, Egger’s registry showed a nonlinear relationship between the ES and the standard error, and a statistically significant degree of bias = 5.916 (t = 9.907, df = 61, p < 0.0001) cannot be said to have no publishing errors (Figure 5). To illustrate the extent of the impact of publication errors on the results of the study, a symmetrical calibration and analysis of asymmetry using Duval and Tweedie’s trim and fill method [16] showed that the corrected ES was 0.67 (Table 6; Figure 6). These results were reduced when compared with the original overall ES of 1.32, but the 95% CI was statistically significant with a lower limit of 0.43 and an upper limit of 0.91 (p < 0.0001). Therefore, although it is not possible to say that there are no publishing errors in the studies included in this current study. The magnitude of the corrected effects is also identified by the medium ES, so it can be concluded that physical therapy modality and exercise therapy for myofascial pain syndrome in the neck and shoulders are both effective.
The overall number of cases of physical therapy for myofascial pain syndrome (ES = 1.32), and the 95% CI (1.11–1.54) were high in the size of the large effect, according to the criteria presented by Cohen. The heterogeneity of the overall ES showed that the expected variance value df based on the effects of the same population was 62 with a Q value of 423.13 and p < 0.0001. In addition, the heterogeneity of the size of the effect was significant since the actual variance ratio I2 value was 85.3%.
In a previous study, the Cervical Stabilization Exercise Treatment Group reported the greatest pain reduction for patients with chronic cervical pain, and the effects of stimulant treatment within the muscles was significant when applied with kidney or stabilization movements [17]. It was reported that kidney exercises are necessary to relieve pain in the muscles that produce pressure [18]. The results of this study prove that physical therapy modality and exercise therapy have a great effect on myofascial pain syndrome in neck and shoulder, as in the preceding study.
A study of the types of intervention for myofascial pain syndrome showed that 28 cases of modality therapy group, 19 cases of exercise therapy group, and 16 cases of modality therapy and exercise therapy group were added. The magnitude of the effect of the type of intervention showed the greatest effect of physical modality therapy + exercise therapy (ES = 1.83). These results indicate that 2 treatments are more effective than physical modality therapy or exercise therapy alone.
Based on the differences in the ES according to the methods of evaluation, the most frequently used was the VAS, (k = 29), followed by the PPT, (k = 23), and the NDI, (k = 11). The magnitude of the effects was shown to be large in the order of VAS (ES = 1.59), NDI (ES = 1.35, and PPT (ES = 0.94). In addition, all of 95% CIs were statistically significant. These results show that in the evaluation of physical modality therapy for myofascial pain syndrome, studies are being conducted using the pain index, the VAS and PPT, and the study conducted with NDI as a dependent variable, did not perform well. Therefore, in the study of physical modality therapy for myofascial pain syndrome, various assessments other than the pain index will need to be performed.
The study showed that the number of people treated, the duration of treatment, and the number of times the treatment was performed was a modulating variable that explained the difference between the ES on treating myofascial pain syndrome. For the number of people to be treated, a large number of patients would need to be studied, since the number of cases was the highest at 20 (k = 47) and the magnitude of the effect was 21 to 40 (ES = 1.64). For the duration of the treatment, we can see that there have been many treatments, usually for less than 30 days. For the number of treatments, 6 to 10 (k = 37) treatments were observed to be the most frequent. In addition, the magnitude of the effect (ES = 1.51) was the highest and was statistically significant. This confirms that many studies of physical modality therapy have been studied with less than 10 short-term approaches.
Prior studies have shown that there is also pain reduction and improvement of physical function through short-term intervention with exercise [19]. However, further research needs to confirm the effectiveness of the treatment from a longer-term perspective.
Combined with this study, we were able to confirm that physical modality therapy and exercise therapy had great effect on myofascial pain syndrome in the neck and shoulders, and that the effect differed according to the methods of intervention and evaluation. In addition, the effects of physical modality therapy were observed to be affected by the number of patients, the duration of treatment, and the modulating variables of the number of treatments.
Therefore, we hope that the results of this study will help in the design of systematic and objective clinical treatment to more effectively apply physical modality treatment to myofascial pain syndrome in the neck and shoulders.

Conflicts of Interest

The authors have no conflicts of interest to declare.

  • 1. Labor Department. Industrial Accident Analysis 2007 1998–2006.
  • 2. Park EY, Kim WH. A Path Analysis of Musculoskeletal Diseases and Related Factors in Shipbuilding Workers. Phys Ther Korea 2008;15(3). 53−61.
  • 3. Lentz MJ, Landis CA, Rothermel J, et al. Effects of selective slow wave sleep disruption on musculoskeletal pain and fatigue in middle aged women. J Rheumatol 1999;26(7). 1586−92. PMID: 10405949.PubMed
  • 4. Grzesiak RC. Psychological aspects of chronic orofacial pain: Theory, assessment and management. Pain Digest 1991;1:100−19.
  • 5. Simons DG, Travell JG, Simons LS. Myofascial pain syndromes. Williams, Wilkins Myofascial pain and dysfunction. Baltimore (BA): Lippincott Williams and Wilkins; 1999. pp 12−50.
  • 6. Edited by Goodgold Joseph: Rehabilitation medicine. Mosby Inc; 1988. pp 685−7.
  • 7. Fricton JR, Kroening R, Haley D, et al. Myofascial pain syndrome of the head and neck: A review of clinical characteristics of 164 patients. Oral Surg Oral Med Oral Pathol 1985;60(6). 615−23. PMID: 10.1016/0030-4220(85)90364-0. PMID: 3865133.ArticlePubMed
  • 8. Sola AE, Bonica JJ. Myofascial pain syndromes. The management of pain. 2nd ed. Edited by Bonica JJ: Philadelphia (PA): Lea & Febiger Malvern; 1990. pp 352−67.Article
  • 9. Revel M, Andre-Deshays C, Minguet M. Cervicocephalic kinesthetic sensibility in patients with cervical pain. Arch Phys Med Rehabil 1991;72(5). 288−91. PMID: 2009044.PubMed
  • 10. Lee KY, Lee JH, Hwang SD. A meta-analysis on the effects of nature-friendly education on young children’s development. J Korea Open Assoc Early Childhood Educ 2018;23(6). 329−50. PMID: 10.20437/KOAECE23-6-14.Article
  • 11. Moher D, Liberati A, Tetzlaff J, et al. Preferred reporting items for systematic reviews and meta-analyses: The PRISMA Statement. Ann Intern Med 2009;151(4). 264−9. PMID: 10.7326/0003-4819-151-4-200908180-00135. PMID: 19622511.ArticlePubMed
  • 12. Borenstein M, Hedges LV, Higgins JPT, et al. Introduction to meta-analysis. West Sussex (UK): Wiley and Sons Inc; 2009. PMID: 10.1002/9780470743386.
  • 13. Hwang SD. Understanding of easy to know meta-analysis. Seoul (Korea): Governor of the School; 2014.
  • 14. Cohen J. Statistical power analysis for the behavioral sciences. 2nd ed. Hillsdale (NJ): Lawrence Earlbaum Associates; 1988.
  • 15. Hwang SD. Meta-analysis using Free Software. Daegu (Korea): Kyungpook National University Press; 2016.
  • 16. Duval S, Tweedie R. Trim and fill: A simple funnel-plot-based method of testing and adjusting for publication bias in meta-analysis. Biometrics 2000;56(2). 455−63. PMID: 10.1111/j.0006-341X.2000.00455.x. PMID: 10877304.ArticlePubMed
  • 17. Kim SE, Lee HO, Kim JS, et al. The comparison of effective of stretching exercise and stabilizing exercise for the patients with myofascial pain syndrome at the shoulder girdle. J Korean Soc Orthop Treat 2005;11(2). 49−61.
  • 18. Hanten WP, Olson SL, Butts NL, et al. Effectiveness of a home program of ischemic pressure followed by sustained stretch for treatment of myofascial trigger points. Phys Ther 2000;80(10). 997−1003. PMID: 10.1093/ptj/80.10.997. PMID: 11002435.ArticlePubMedPDF
  • 19. Li Y, Su Y, Chen S, et al. The effects of resistance exercise in patients with knee osteoarthritis: A systematic review and meta-analysis. Clin Rehabil 2016;30(10). 947−59. PMID: 10.1177/0269215515610039.ArticlePubMed
Figure 1
Research model.
EXT = exercise therapy; MPT = manual physical therapy; NDI = neck disability index; PPT = pain pressure threshold.
ophrp-11-251f1.jpg
Figure 2
PRISMA flow diagram.
PRISMA = preferred reporting items for systematic reviews and meta-analysis.
ophrp-11-251f2.jpg
Figure 3
Study of risk of bias.
ophrp-11-251f3.jpg
Figure 4
Publication bias Funnel plot.
ophrp-11-251f4.jpg
Figure 5
Egger’s regression plot.
ophrp-11-251f5.jpg
Figure 6
Trim and fill plot.
ophrp-11-251f6.jpg
Table 1
Effect size results according to the 25 study cases.
Model k ES (g) 95% CI Q (df) I2 p
LL UL
Random 63 1.32 1.11 1.54 423.13 (62) 85.3% < 0.0001

CI = confidence interval; ES = effect size; I2 = between-study variability; k = number of effect size; LL = lower limit; UL = upper limit.

Table 2
Effect size according to treatment intervention.
Treatment Intervention k ES (g) 95% CI Q (df) p
LL UL
EXT 19 1.18 0.84 1.52 4.80 (2) > 0.0907
MPT 28 1.13 0.85 1.41
EXT+MPT 16 1.83 1.26 2.40

EXT = exercise therapy; MPT = modality therapy; k = number of effect size; ES = Effect size; CI = confidence interval; LL = lower limit; UL = upper limit; I2 = between-study variability.

Table 3
Effect size according to outcome variables.
Outcome k ES (g) 95% CI Q (df) p
LL UL
NDI 11 1.35 0.92 1.79 8.19 (2) < 0.0167
PPT 23 0.94 0.65 1.24
VAS 29 1.59 1.25 1.92

NDI = neck disability index; PPT = pressure pain threshold; VAS = visual analogue scale; k = number of effect size; ES = effect size; CI = confidence interval; LL = lower limit; UL = upper limit; I2 = between-study variability.

Table 4
Treatment ES according to the control variable.
Control variable N k ES (g) 95% CI Q (df) p

LL UL
No. of participants ≤ 20 47 1.22 0.97 1.47 3.35 (2) > 0.1876
21 to 40 15 1.64 1.26 2.02
≥ 41 1 1.22 0.63 1.81

Treatment period (d) 1 to 15 25 1.27 0.97 1.57 2.87 (3) > 0.4125
16 to 30 28 1.41 1.04 1.77
31 to 45 6 1.44 0.76 2.11
46 to 60 4 0.84 0.26 1.42

No. of treatments 1 to 5 3 1.02 0.64 1.39 8.21 (3) < 0.0418
6 to 10 37 1.51 1.20 1.82
11 to 15 15 1.15 0.74 1.57
≥ 16 8 0.90 0.61 1.20

k = number of effect size; ES = effect size; CI = confidence interval; LL = lower limit; UL = upper limit; I2 = between-study variability.

Table 5
Egger’s regression results.
k t df p Bias Se-bias Slope
63 9.907 61 < 0.0001 5.916 0.597 − 0.860

k = number of effect size.

Table 6
Trim and fill results.
Publication bias k ES (g) 95% CI Q (df) p
LL UL
Trim and fill 87 0.67 0.43 0.91 882.10 (86) < 0.0001

k = number of effect size; ES = effect size; CI = confidence interval; LL = lower limit; UL = upper limit; I2 = between-study variability.

Figure & Data

References

    Citations

    Citations to this article as recorded by  
    • The Impact of Dry Needling With Electrical Stimulation on Pain and Disability in Patients With Musculoskeletal Shoulder Pain: A Systematic Review and Meta-Analysis of Randomized Controlled Trials
      Anthony N Baumann, Andrew Fiorentino, Caleb J Oleson, John Martin Leland
      Cureus.2023;[Epub]     CrossRef
    • Meta-Analysis of the Effects of Various Physical Therapy Method about Shoulder Adhesive Capsulitis: The Cases of Domestic Research
      Chan Myeong Kim
      The Journal of Korean Physical Therapy.2020; 32(5): 277.     CrossRef

    Figure

    PHRP : Osong Public Health and Research Perspectives