
Articles
- Page Path
- HOME > Osong Public Health Res Perspect > Volume 13(2); 2022 > Article
-
Original Article
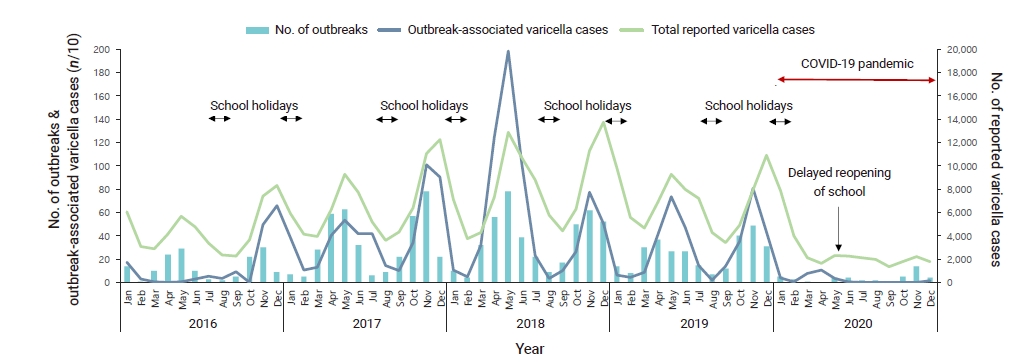
Epidemiological characteristics of varicella outbreaks in the Republic of Korea, 2016–2020 -
Eun-Young Kim1
 , Chungmin Park2, Gyehee Lee3, Suyeon Jeong4, Jeongsuk Song5, Dong-Han Lee6
 -
Osong Public Health and Research Perspectives 2022;13(2):133-141.
DOI: https://doi.org/10.24171/j.phrp.2022.0087
Published online: April 26, 2022
1Chungcheong Regional Center for Disease Control and Prevention, Daejeon, Korea
2Division of Risk Assessment, Bureau of Public Health Emergency Preparedness, Korea Disease Control and Prevention Agency, Cheongju, Korea
3Division of Infectious Disease Control, Bureau of Infectious Disease Policy, Korea Disease Control and Prevention Agency, Cheongju, Korea
4Ministry of Health and Welfare, Sejong, Korea
5Division of Healthcare Associated Infection Control, Bureau of Healthcare Safety and Immunization, Korea Disease Control and Prevention Agency, Cheongju, Korea
6Gyeongnam Regional Center for Disease Control and Prevention, Busan, Korea
- Corresponding author: Dong-Han Lee Gyeongnam Regional Center for Disease Control and Prevention, 1090 Jungang-daero,Yeonje-gu, Busan 47596, Korea E-mail: ldhmd@korea.kr
© 2022 Korea Disease Control and Prevention Agency.
This is an open access article under the CC BY-NC-ND license (http://creativecommons.org/licenses/by-nc-nd/4.0/).
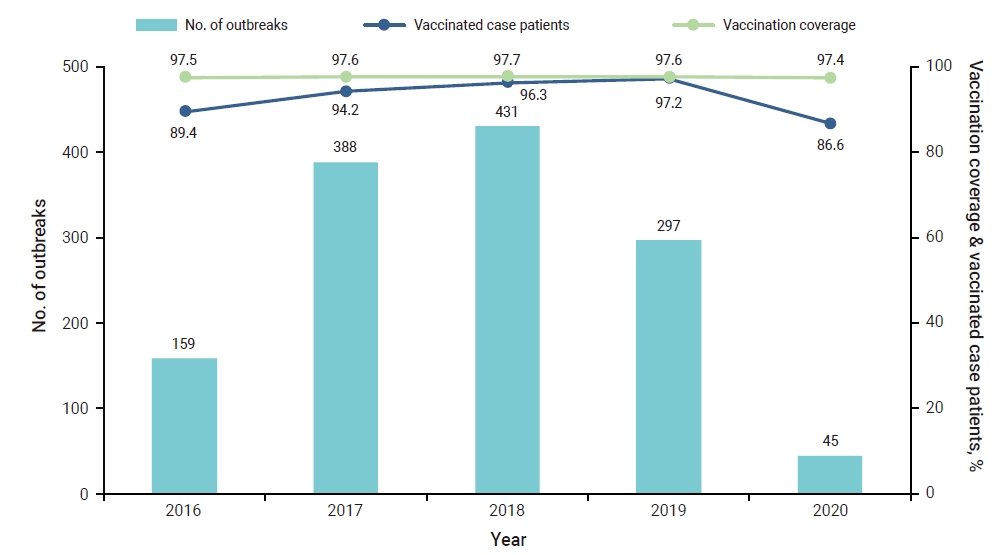

Figure & Data
References
Citations
- The Protective Effectiveness of 2-Dose Varicella Vaccination in Children in Korea: A Case-control Study
Young Hwa Lee, Young June Choe, Kwan Hong, Yoonsun Yoon, Yun-Kyung Kim
Pediatric Infectious Disease Journal.2023; 42(8): 719. CrossRef - Epidemiological Characteristics of Varicella Outbreaks — China, 2006–2022
Miaomiao Wang, Xudong Li, Meiying You, Yuanyuan Wang, Xinyu Liu, Zihan Li, Wenjia Zhao, Zhuojun Jiang, Yuehua Hu, Dapeng Yin
China CDC Weekly.2023; 5(52): 1161. CrossRef
 PubReader
 Cite
Cite- Figure
-

- Related articles
-
- Epidemiological characteristics of carbapenemase-producing Enterobacteriaceae outbreaks in the Republic of Korea between 2017 and 2022
- Trends of legionellosis reported in Jeju Province, Republic of Korea, 2015–2022
- Vaccine effectiveness and the epidemiological characteristics of a COVID-19 outbreak in a tertiary hospital in Republic of Korea
