Undiagnosed Isolated Systolic and Diastolic Hypertension Subtypes and Their Correlates in Bangladesh: A Nationwide Survey
Article information
Abstract
Objectives
This study was performed to identify the distribution of undiagnosed isolated hypertension subtypes and their correlates amongst adults aged 35 years and older in Bangladesh using data from the Bangladesh Demography and Health Survey 2011.
Methods
Out of a total of 17,964 selected households, 7,880 were included in the final analysis for this study. Systolic and diastolic blood pressure (BP) were measured 3× at 10-minute intervals. Hypertension subtypes were defined for individuals not under antihypertensive treatment as systolic-diastolic hypertension (SDH): systolic BP (SBP) ≥ 140 mm Hg and diastolic BP (DBP) ≥ 90 mm Hg; isolated diastolic hypertension (IDH): SBP < 140 mm Hg and DBP ≥ 90 mm Hg, and isolated systolic hypertension (ISH): SBP ≥140 mm Hg and DBP < 90 mm Hg.
Results
The predominant hypertension subtypes were SDH and IDH [5.2%; 95% confidence interval (CI): 4.7–5.1] followed by ISH (3.8%; 95% CI: 3.4–4.2). Multiple logistic regression showed that age and gender were significant predictors of ISH. SDH was associated with females [odds ratio (OR): 1.8; 95% CI: 1.3–2.6], the older age group (OR-7.4; 95% CI: 4.3–12.7), and overweight or obese individuals (OR: 1.6; 95% CI: 1.1–2.4). Non-manual work (OR: 1.5; 95% CI: 1.0–2.0]) and being overweight or obese (OR: 1.9; 95% CI: 1.4–2.8) were factors associated with IDH.
Conclusion
ISH, IDH and SDH represent salient subtypes of hypertension in Bangladesh. To identify preventive intervention for averting adverse cardiovascular events, further research is needed.
Introduction
The diagnosis of hypertension is usually based on blood pressure (BP); systolic BP (SBP) and diastolic BP (DBP). However, some individuals do not fall outside the normal range for both (SBP and DBP), it is either their SBP or DBP that is elevated. In these cases their hypertension is defined as isolated systolic hypertension (ISH) or isolated diastolic hypertension (IDH) respectively [1, 2]. The prognostic significance of ISH and IDH is established and varies according to hypertension subtypes [3].
ISH is often characterized as a phenomenon of aging because SBP unlike DBP, increases with age in response to increasing arterial stiffness and losses in arterial compliance, particularly after the age of 40 [4]. ISH is also known to be associated with an increased incidence of cardiovascular complications. Observational, epidemiologic and clinical trial data have demonstrated that elevated SBP significantly increased the risk of stroke, coronary heart disease, and end-stage renal disease, especially in individuals ≥ 65 years of age [5, 6]. IDH is associated with a low risk of cardiovascular disease (CVD) mortality, whilst ISH carries a similarly high risk to systolic-diastolic hypertension (SDH). Findings suggest that prognosis of hypertension could be improved by treatment focused on SBP rather than DBP [1]. It has also been reported that ISH represents a particularly salient subtype of hypertension [3,4]. Multiple clinical studies have established elevated SBP as a more reliable predictor for adverse cardiovascular outcomes compared to elevated DBP [7].
However, data regarding prevalence of ISH in developing countries is limited [8, 9]. National data on the distribution of hypertension subtypes in Bangladesh have not been reported. Therefore, a thorough investigation using current and nationally representative data is clearly warranted. This data would inform physicians as well as public health communities, of better treatments and preventive modalities. In this study we report the prevalence of ISH, IDH, and SDH in the general Bangladeshi adult population.
Materials and Methods
1. Study population
A nationally representative sample from the 2011 Bangladesh Demographic and Health Survey (BDHS) conducted between July to December 2011, was used to perform this study. The primary sampling unit (PSU) for the survey was an enumeration area which contained 120 households on average, and was prepared by the Bangladesh Bureau of Statistics for the 2011 Population and Housing Census. The 2011 BDHS was the first national survey in Bangladesh that incorporated the measurement of biomarkers including BP and blood glucose levels of subsamples of men and women aged 35 years and older, and was used in this study. The survey was approved by the National Research Ethical Review Committees of Bangladesh Medical Research Council, Bangladesh (Ref #: BMRC/NREC/2010-2013/537) and the Institutional Review Board of Macro International in Calverton, United States of America (Ref #: 631561.0.000.00.091.01). Informed consent was obtained from each participant before data collection [10].
2. Sampling design
The 2011 BDHS survey used a 2-stage stratified sampling method to select nationally representative probability samples of men and women from the 7 administrative divisions of Bangladesh. In the first stage, 600 PSU (207 urban, 393 rural) were selected with a probability proportional to the size of the PSU. In the second stage, 30 households were selected from each PSU with an equal probability systematic selection. Of the total of 17,964 selected households, 17,511 were found to be eligible for this survey and interviews were successfully completed for 17,141 households. Biomarker measurements were also taken in every third eligible household. The subsample included 8,835 household members aged 35 years or older of which 4,524 were men and 4,311 were women [11, 12]. After exclusion of nonresponses and individuals with missing data, the final sample was 7,880 (Figure 1).

Study flow diagram.
3. Data collection
Detailed information on the socioeconomic and demographic characteristics of all participants was collected by trained interviewers using a standard questionnaire. Principal component analysis was conducted to generate a Wealth index to categorize households ranging from the poorest to the richest households [12]. A data collection team including a health technician, measured BP, blood glucose concentration, body weight and height using standard methods and body mass index was calculated (weight in kg/height in m2). Diabetes was defined as a fasting blood glucose level greater than or equal to 7.0 mmol/L or self-reported use of diabetes medication [13].
4. Measurement of BP
An individual’s BP was measured using an automated device (LIFE SOURCE® UA-767 Plus automatic BP monitor device) as recommended by the World Health Organization. The validity of the UA-767 BP monitor device was tested simultaneously with auscultatory measurements using a mercury manometer in accordance with the recommendations given by the Association for Advancement of Medical Instrumentation and British Hypertension Society. The UA-767 BP monitor device satisfied the Association for Advancement of Medical Instrumentation criteria and achieved a British Hypertension Society grade of A/A (agreement between UA-767 and auscultatory measurements within 5, 10, and 15 mm Hg were 82, 94, and 98% for SBP and 80, 95, and 98% for DBP) [14]. Trained interviewers took 3 measurements of both SBP and DBP following the manufacturer’s recommended protocol, and the 2011 BDHS Anthropometry, Anemia Testing, Blood Glucose Testing and BP Measurement Field Manual. Separate cuff sizes (small, medium, and large) were used based on the participant’s arm circumference. There were approximately 10-minute intervals between the 3 measurements of SBP and DBP readings. The first BP measurement was discarded and the mean value of the second and third measurements was used for both systolic and DBP [10].
5. Outcome
Hypertension was defined as an average SBP ≥ 140 mm Hg and/or, diastolic blood pressure (DBP) ≥ 90 mm Hg and/or taking anti-hypertensive medication during the survey [10]. Undiagnosed hypertension subtypes were defined (for individuals not currently taking antihypertensive treatment) as follows: combined systolic/diastolic hypertension (SDH) was defined as an average SBP ≥ 140 mm Hg and an average DBP ≥ 90 mm Hg; IDH was defined as an average SBP < 140 mm Hg and an average DBP ≥ 90 mm Hg, and ISH was defined as an average SBP ≥ 140 mm Hg and an average DBP < 90 mm Hg [15, 16]. Individuals reporting current antihypertensive treatment were categorized together as 1 group (treated) irrespective of their actual BP values.
6. Statistical analysis
Statistical analyses were carried out using SPSS for Windows version 20 (IBM Corp., Armonk, NY, USA). Categorical variables were presented as frequencies with percentages and continuous variables as mean with standard deviation. Chi-square test was used to assess the association between categorical variables and the Student’s t test was used to compare the means of continuous variables. Logistic regression analysis was performed to determine the independent factors associated with SDH, IDH and ISH. Three separate regression models were constructed for ISH, IDH and SDH. It included SDH, IDH and ISH as binary outcome variables and age, gender, area of residence (rural, urban), educational attainment (no education, preschool, primary, secondary, college or higher), Wealth Index (poorest, poorer, middle, richer, richest), occupation (manual work, non-manual work), BMI category (normal, overweight, obese), and diabetes status (yes, no). A p < 0.05 was considered statistically significant.
Results
A total of 7,880 participants were included in the analysis for this study of which 3,904 (49.5%) were male and 3,976 (50.5%) were female. Socioeconomic, demographic and health characteristics of the participants according to their BP status (hypertension and normal BP) are presented in Table 1.
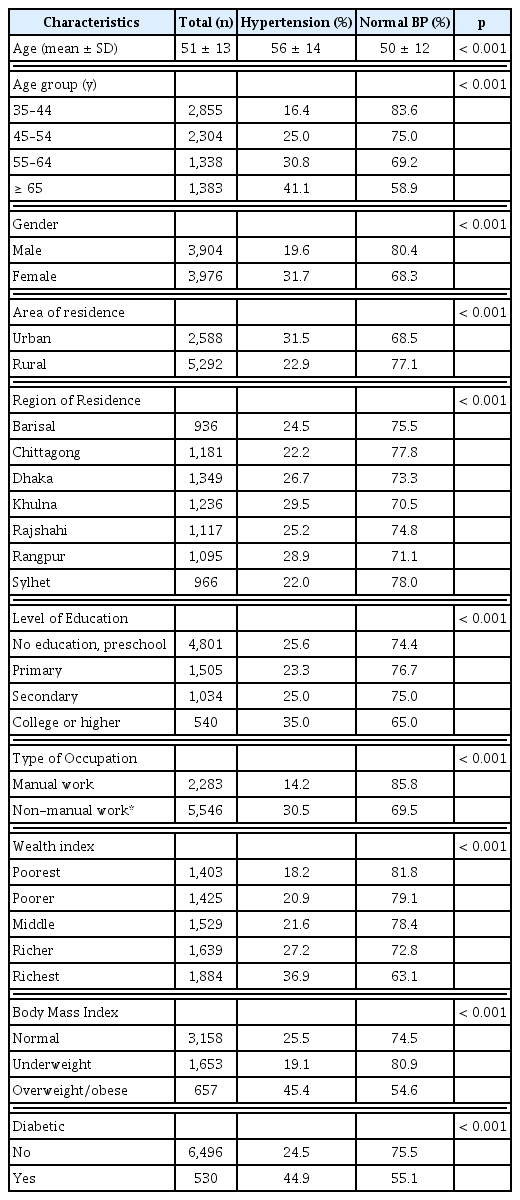
Demographic characteristics of the respondents by hypertension status.
Participants with hypertension were significantly older than those with normal BP. Hypertension was more prevalent amongst females (31.7% VS 19.6%, p < 0.001) and those residing in urban areas (31.5% VS 22.9%, p < 0.001). It was observed that the prevalence of hypertension increased within older ages, higher education and higher wealth status individuals. Prevalence of hypertension doubled amongst those who in non-manual work compared with those in manual work (30.5% vs. 14.2%, p < 0.001). About 45% of the overweight or obese and diabetic participants had hypertension (Table 1). Overall, 1,123 participants (14.3%; 95% CI, 13.5%–15.1%) had undiagnosed and untreated hypertension, and there were 903 individuals who had previously been diagnosed as hypertensive and receiving treatment (11.5%; 95% CI, 10.8–12.2). Amongst the hypertensive individuals that had been diagnosed, 407 had their BP under control (5.2%; 95% CI, 4.7%–5.7%) whilst 496 had uncontrolled hypertension (6.3%; 95% CI, 5.8%–6.8%).
Amongst the undiagnosed and untreated hypertensive individuals, SDH and IDH was the predominant subtype (5.2%) followed by ISH (3.8%). All the hypertension subtypes were higher amongst urban residents, however prevalence was higher amongst females as compared to males in both rural and urban areas (Figure 2). Irrespective of gender, prevalence of ISH increased with age whereas the prevalence of IDH decreased with age (Table 2). The prevalence of SDH increased from 35 to 64 years after which prevalence of SDH declined, whereas the prevalence of ISH increased steadily and dramatically, especially amongst women. IDH was the most common hypertension subtype in the 35 to 44 years and 45 to 54 years age groups, for both males and females. SDH and ISH was the most common subtype in the age group 65 years or older age group for both males and females (Table 2). All the hypertension subtypes were more prevalent amongst women, rural residents, non-manual workers or the richest economic group (data not shown).
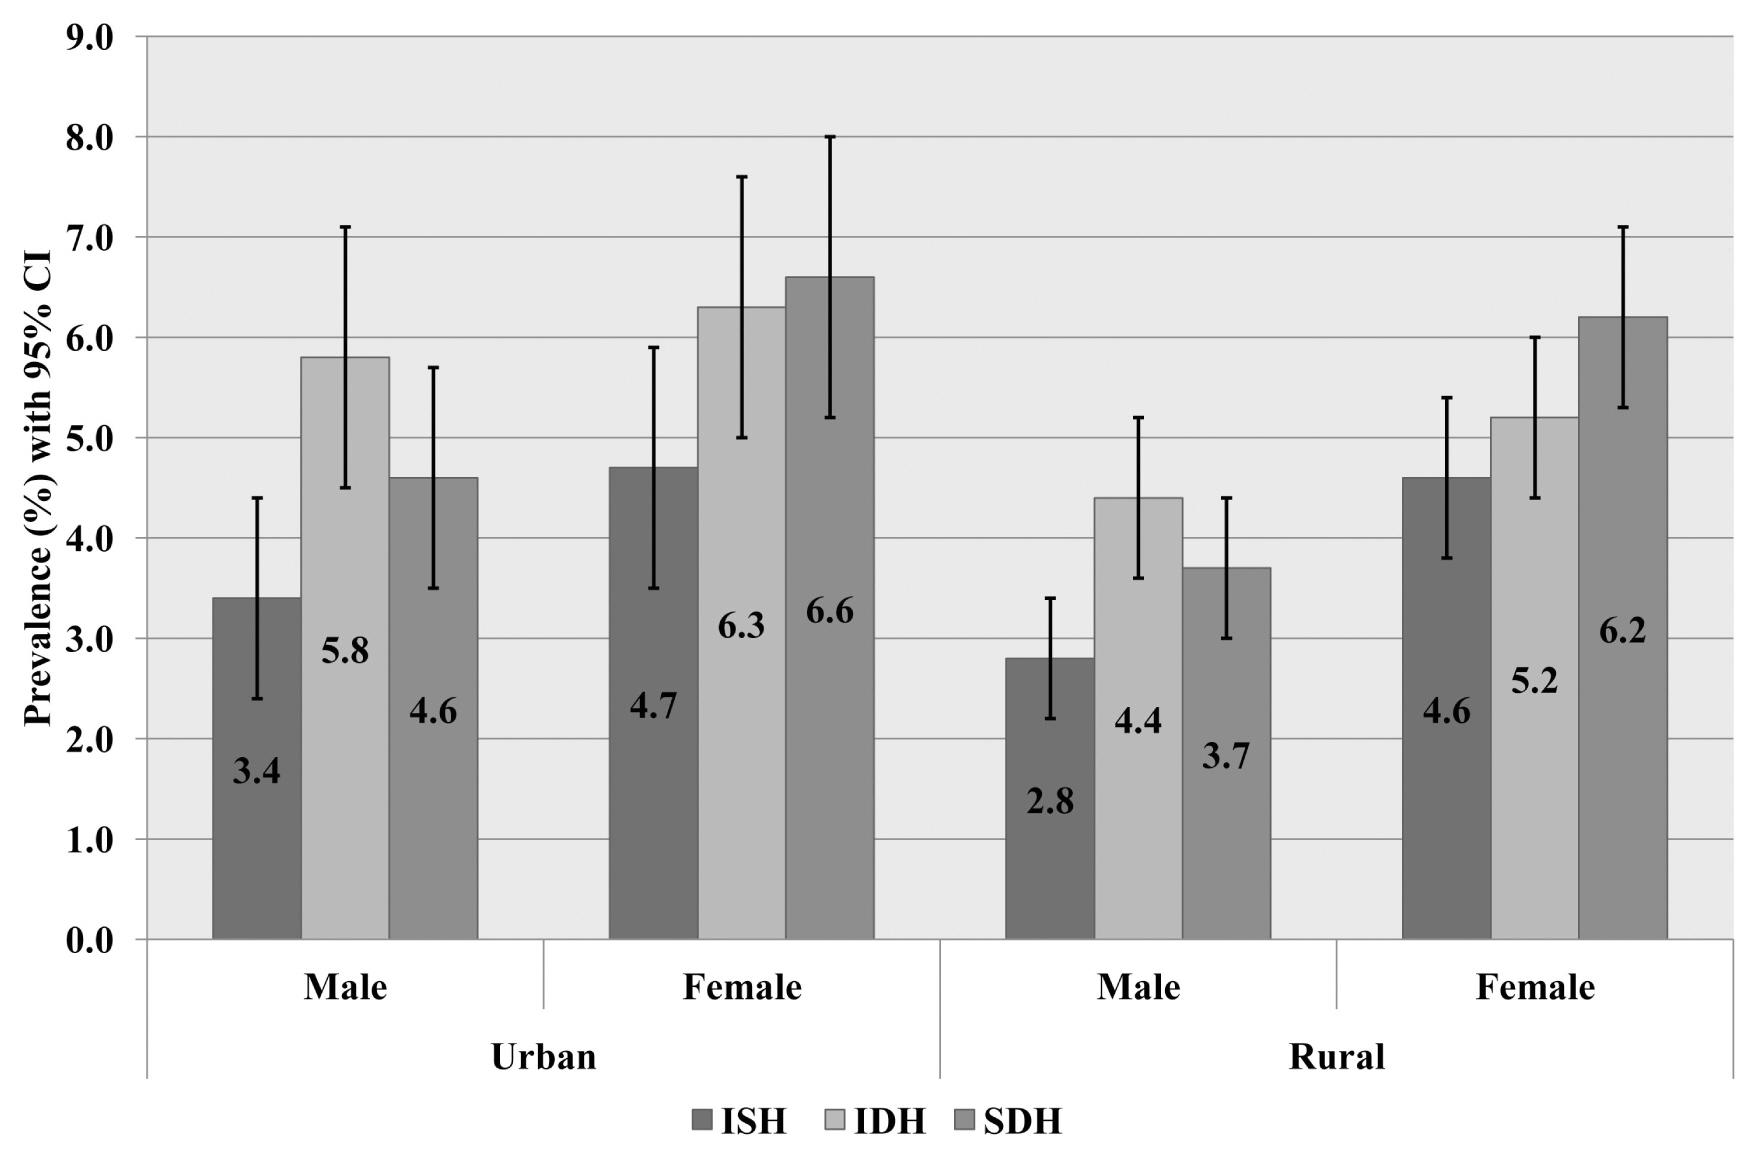
Prevalence of ISH, IDH and SDH by area and gender. All the hypertension subtypes were higher amongst female and urban residents.
IDH = isolated diastolic hypertension; ISH = isolated systolic hypertension; SDH = systolic-diastolic hypertension.
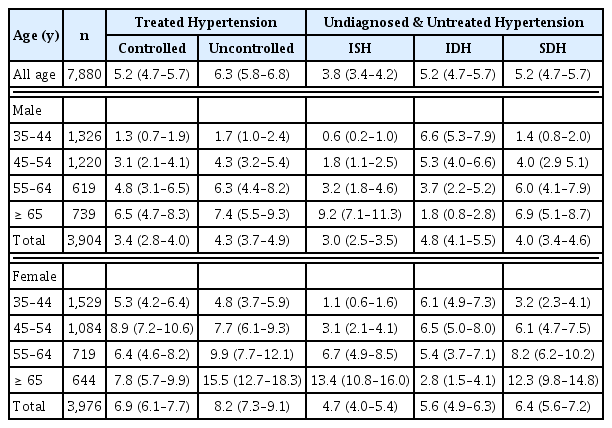
Age and gender specific prevalence of ISH, IDH, and combined systolic/diastolic hypertension in the Bangladesh population.
Table 3 shows the correlates of undiagnosed and untreated hypertension subtypes. Subtypes of hypertension were identified by logistic regression analysis together with unadjusted and adjusted for a number of relevant covariates, amongst the undiagnosed and untreated group. In the unadjusted analysis, the odds of having ISH and SDH increased with older ages whereas decreased for IDH. Being a female and non-manual worker was found to give higher odds of having all hypertension subtypes. Respondents with diabetes were found to have a higher chance of having ISH. Residing in urban areas and being overweight or obese posed a higher chance of having IDH and SDH. Participants from the richest economic group had higher odds of having ISH and IDH. In addition to this, respondents with a higher education (compared to no or preschool education) had 70% higher odds of having IDH whereas, respondents being underweight had 60% lower odds of having IDH. After adjustment, females (OR: 2.1; 95% CI: 1.5–3.1), and older age groups [45–54 year: (OR-3.3; 95% CI: 1.4–7.6); 55–64 year: (OR-7.1; 95% CI: 3.1–16.2); ≥ 65 year: (OR-21.5; 95% CI: 9.6–47.9)] were significant determinants of ISH. Statistically significant predictors of SDH included older age groups [45–54 year (OR-3.1; 95% CI: 1.8–5.2), 55–64 year (OR-4.5; 95% CI: 2.6–7.8); ≥65 year, (OR-7.4; 95% CI: 4.3–12.7)], being female (OR: 1.8; 95% CI: 1.3–2.6) and overweight or obese individuals (OR: 1.6; 95% CI: 1.1–2.4). After adjustment, the odds of having IDH was about 2-fold higher if an individual was overweight or obese compared to a normal individual (OR: 1.9; 95% CI: 1.4.–2.8). Marginally significant contribution was observed to increase IDH by non-manual work (OR: 1.5, 95% CI: 1.0–2.0). Surprisingly, underweight was proved to be a significant protective factor for IDH.

Unadjusted and adjusted odds ratios for factors associated with hypertension amongst adults in Bangladesh.
Discussion
This study reports the distribution of different hypertension subtypes in a nationally representative sample of Bangladesh. To the best of our knowledge this is the first study that explored correlates of different hypertension subtypes in Bangladesh. These data document a high prevalence of undiagnosed and untreated hypertension in the Bangladeshi population, with the largest proportion having IDH and SDH (5.2%) followed by ISH (3.8%). This study observed that ISH and SDH were especially prevalent amongst those 55 years or older, whereas IDH was more prevalent amongst those 54 years or younger. Older age, being female, area of residence, higher education, richest household economic status, being overweight or obese and being diabetic were significant factors associated with hypertension subtypes in Bangladesh.
Although there have been only a few studies that have reported the prevalence of hypertension subtypes in developing countries, our findings are consistent with those studies [16–18]. Our reported prevalence of ISH was similar to a study conducted in Northern India (5.1% in men and 3.6% in women) [17] but lower than that reported in China (7.6%) [16]. Another study conducted in India reported that prevalence of IDH was 4.5% and was higher in men compared to women [18]. IDH and SDH were the predominant hypertension subtypes in this current study. Regardless of the larger prevalence of diastolic hypertension including combination with systolic hypertension, we observed that for every BP subtype, mean SBP values increased whereas, mean DBP values decreased with increasing age.
Elevation of BP with increasing age is a physiological phenomenon that takes place due to changes in arterial and arteriolar stiffness as an individual grows older [19]. In this study it was observed that ISH and SDH were especially prevalent amongst those 55 years or older, whereas IDH was more prevalent amongst those 54 years or younger. It was evident from the Framingham Heart Study that SBP increased between the ages of 30 and 84 years or over [20]. DBP, on the other hand, increased until the fifth decade of life and slowly decreased from age 50 years or over [20]. The increase in DBP up to the age of 50 is mostly due to increased peripheral vascular resistance in small vessels. But acceleration of large artery stiffness after the age of 50 leads to the steep rise in SBP [19].
In this study, gender and BMI were found to be major determinants of hypertension subtypes consistent with other studies reported in China, India and Iran [18, 21, 22]. This implies that not only metabolic and hormonal changes, but also other factors such as dietary habit and physical activity contributes to the development of hypertension subtype. Bangladeshi men spend 3-times longer in physical activity compared with women in both urban and rural areas [23]. It is well documented that regular physical activity slows the normal loss of elasticity in the cardiovascular system with age, and to that extent exercise interventions can reverse some age-related decline in arterial stiffness [24].
Age-specific mortality rates from strokes, ischemic heart disease and other vascular diseases were found to be strongly associated with BP [25]. However, there are prognostic differences between different hypertension subtypes. The Finn-home study observed higher CVD event rates amongst ISH subtypes, followed by SDH and IDH subtypes [26]. A clinical trial study concluded that elevated BP predicted an increased mortality from coronary heart disease (CHD) in general, but individuals with ISH were at the greatest risk of death from CHD [27]. A 31-year follow-up study conducted amongst young and middle-aged adults found that adjusted relative risk for CVD mortality was highest for SDH, followed by IDH and ISH for males. In contrast, in this current study the overall prevalence of SDH, IDH and ISH was comparatively high in males compared to female counterparts. However, another study showed that the relative risk of CVD mortality in females was highest for SDH followed by ISH; there was no significant association observed for IDH [28]. The risk of stroke was also strongly related to SBP and ISH [29]. Therefore, further research is needed for identifying better ways of preventing adverse events among different hypertension groups.
This study has several strengths and limitations. The major strength of this study is the use of a population based, nationally representative sample covering both rural and urban areas of all administrative regions of Bangladesh. It collected socioeconomic and demographic information, anthropometric and biomarker measurements of a large sample. In addition, standardized BP measurement technique using recommended guideline and measurement by trained and experience health workers validated the outcome and with less measurement error. The main limitation of this study was that BP was measured in a single visit. However, repeat measurements in separate visits might strengthen the diagnosis of hypertension [15] which was not considered in the 2011 BDHS survey [10]. Findings from this study are limited for individuals aged 35 years and older as no biomarker information was collected for a younger age group. In addition, no information on behavioral and lifestyle related risk factors including level of physical activity, tobacco use or dietary habits were collected which have also been found to be strongly associated with hypertension. Finally, the causal relationship between these determinants and hypertension subtypes cannot be established because of the nature of cross-sectional design of the study.
Given that this study is the first of its kind amongst the Bangladeshi population, our findings provide an important basis for future studies. These preliminary explorations indicating that ISH and IDH may be a silent threat in the population needs to be further addressed. Both conditions are associated with increased risk of CVD and therefore, demands attention from the public health program authorities. Key socio-demographic factors (e.g. old age, being female) have been identified in this study that are contributors to hypertension and need to be considered in further research and program interventions.
Acknowledgments
We would like to thank MEASURE DHS and NIPORT for allowing us to use the dataset. Three of the authors (SA, SP and MAHC) are currently employees of the International Centre for Diarrhoeal Disease Research, Bangladesh (icddr,b). icddr,b is grateful to the Governments of Bangladesh, Canada, Sweden and the UK for providing core/unrestricted support.
Notes
Conflicts of Interest
The authors report no conflicts of interest.