Percentage Body Fat is As a Good Indicator for Determining Adolescents Who Are Overweight or Obese: A Cross-Sectional Study in Vietnam
Article information
Abstract
Objectives
To identify trends in percentage body fat (PBF) in adolescents to determine gender-specific classification thresholds for being overweight and obese.
Methods
A cross-sectional study of 899 adolescents (11 to 14.5 years) from Hanoi and Nam Dinh was conducted in Vietnam. PBF, subcutaneous fat and percentage of lean mass were measured directly using OMRON HBF 375 scales to measure bioelectrical impedance.
Results
PBF decreased in boys with increasing age (p < 0.001). The difference in PBF between boys and girls, significantly increased with age after 12.5 years (p < 0.001). There was a stronger correlation between PBF and fat content (Pearson’s r = 0.860, p < 0.0001) than that between (BMI) and fat content (Pearson’s r = 0.521, p < 0.0001). The prevalence of being overweight or obese in girls was similar when determined by PBF or BMI. Hanoi had higher rates of adolescents being overweight or obese compared with Nam Dinh.
Conclusion
PBF provides a more accurate body assessment for being overweight or obese in adolescents compared with BMI.
Introduction
Children becoming overweight or obese has become a big public health problem in both developed and developing countries, especially in urban areas [1]. The World Health Organization predicted in 2016 that more than 70% of obese and overweight children worldwide would originate from developing countries [1]. The increased number of overweight or obese people, increased from 200 million in 1995 to 600 million in 2014 worldwide [2] highlighting this as a serious public health problem.
In developing countries including Vietnam, where there is economic growth, a transitional phenomenon linked to economics and demographics occurs and results in a dual burden of nutritionally related illness. This is where severe malnutrition and being overweight or obese may occur simultaneously, especially in large cities. In Hanoi, the prevalence of student obesity from 1995 to 2000 increased in 6–11 year old groups, from 2.6% to 5.6% [3].
Obesity and being overweight contributes to metabolic disease and is associated with an increased risk of diabetes, heart disease, cancer and death [4]. A teenager that is overweight or obese may feel guilty, be socially isolated, and lack confidence, which may in turn affect academic achievements [5]. Childhood obesity also increases the risk of dyslipidemia, especially hypertriglyceridemia in adolescents [6]. Being overweight or obese is widely diagnosed using body mass index (BMI). However, BMI standards may not be suitable for Asians, and has limitations as a measurement of adiposity. BMI is a measurement of the relationship between height and body weight, not body composition. Lean mass and fat mass are different between individuals, and especially in adolescents. Therefore, a large number of adolescents may be incorrectly classified as obese based on BMI [7].
Recently, the percentage of body fat index (PBF) has been considered as a more accurate standard to determine being overweight or obese because it measures body fat directly (fat mass/total mas × 100). The use of the PBF index instead of BMI for measuring being overweight or obese is increasing. However, very few investigators in Vietnam have considered PBF as an indicator for estimating the nutritional status of adolescents. The PBF of adolescents in Hanoi and Nam Dinh was assessed to determine the threshold for being overweight or obese using PBF percentile classifications. Percentile values being developed in this study may be useful in the clinical and epidemiological assessment of overweight and obese Vietnamese adolescents.
Materials and Methods
1. Participants
A cross-sectional study was conducted in 899 adolescents (445 boys and 454 girls) from 5 different secondary schools in Hanoi (634 adolescents) and Nam Dinh (265 adolescents) city who were aged 11 to 14.5 years. A simple random sampling method was used to select schools, and Epi info 6 software was used to select the students in each school. Adolescents who had chronic diseases, were humpbacked, had scoliosis, cardiac or metabolic diseases associated with obesity or endocrine disorders, were excluded from the study.
2. Anthropometric measurements
All participants were measured using anthropometric indices following a standard method [6]. Briefly, weight was measured in light indoor clothing, using Omron electronic scales (Japan), and recorded to the closest 0.1 kg. Height was measured without shoes, hat, or jacket, using a tape suspended from the wall, and was recorded to the closest 0.1 cm. Waist circumference (WC) was measured midway between the lower rib margin and the iliac crest, while hip circumference (HC) was measured at the broadest place below the waist. The percentage of body fat (fat mass/total mass × 100) was measured directly by using OMRON HBF 375 scales and bioelectrical impedance analysis (BIA) was performed. Age was calculated specifically on the investigation day. Subcutaneous fat and percentage of lean mass (lean mass/total mass × 100) was also measured directly by OMRON HBF 375. The BMI was calculated as weight/height squared (kg/m2).
The nutritional status of adolescents was classified using age- and gender-specific BMI cut-off points proposed by the World Health Organization 2007. PBF cut-off values for overweight and obese classification were; overweight (≥ 85th percentile for age and gender) and obese (≥ 95th percentile for age and gender).
3. Statistical analysis
Statistical analysis was performed using SPSS version 16.0 for Windows (SPSS Inc., Chicago, IL, USA) [8,6] and GraphPad Prism 5.0 [9–11]. T test and 2-way ANOVA was applied for comparison between 2 or more groups. Chi-square test or Kruskal-Wallis test were also used when appropriate. Statistical significance was reached when the p value was < 0.05.
4. Ethics
All parents and children in this study read, and signed informed consent. The privacy of the children was maintained (separate closed rooms for boys and girls). During the investigation, children had the right to refuse to answer any questions, or to stop participating in the study at any time. Their personal information was kept secret. The nutritional status of the children, as well as prevention and treatment recommendations, were given to each child and their parents. The study was approved by the local ethics committee (1156/QD-TTGD-SS) at the Department of Human and Animal Physiology, Faculty of Biology, Hanoi National University of Education.
Results
1. Participant characteristics
The mean value of anthropometric indices have been presented in Table 1. Among the study participants it was observed that boys and girls have significant differences in almost all characteristics, except for hip circumference.

Anthropometric and body composition characteristics by gender.
2. Tendency, and percentile of PBF in study participants
As shown in Figure 1A, there were differences in PBF between boys and girls according to age. In boys PBF dropped from 24.0% to 14.8% between 11 and 14.5 years (p < 0.001), while in girls in the same age range, PBF increased (p = 0.08). The PBF of girls from 11 to 12.5 years oscillated around 21.6% to 19.8%, and between the ages of 13 to 14.5 years PBF fluctuated between 20.2% to 22.6% (Figure 1A).
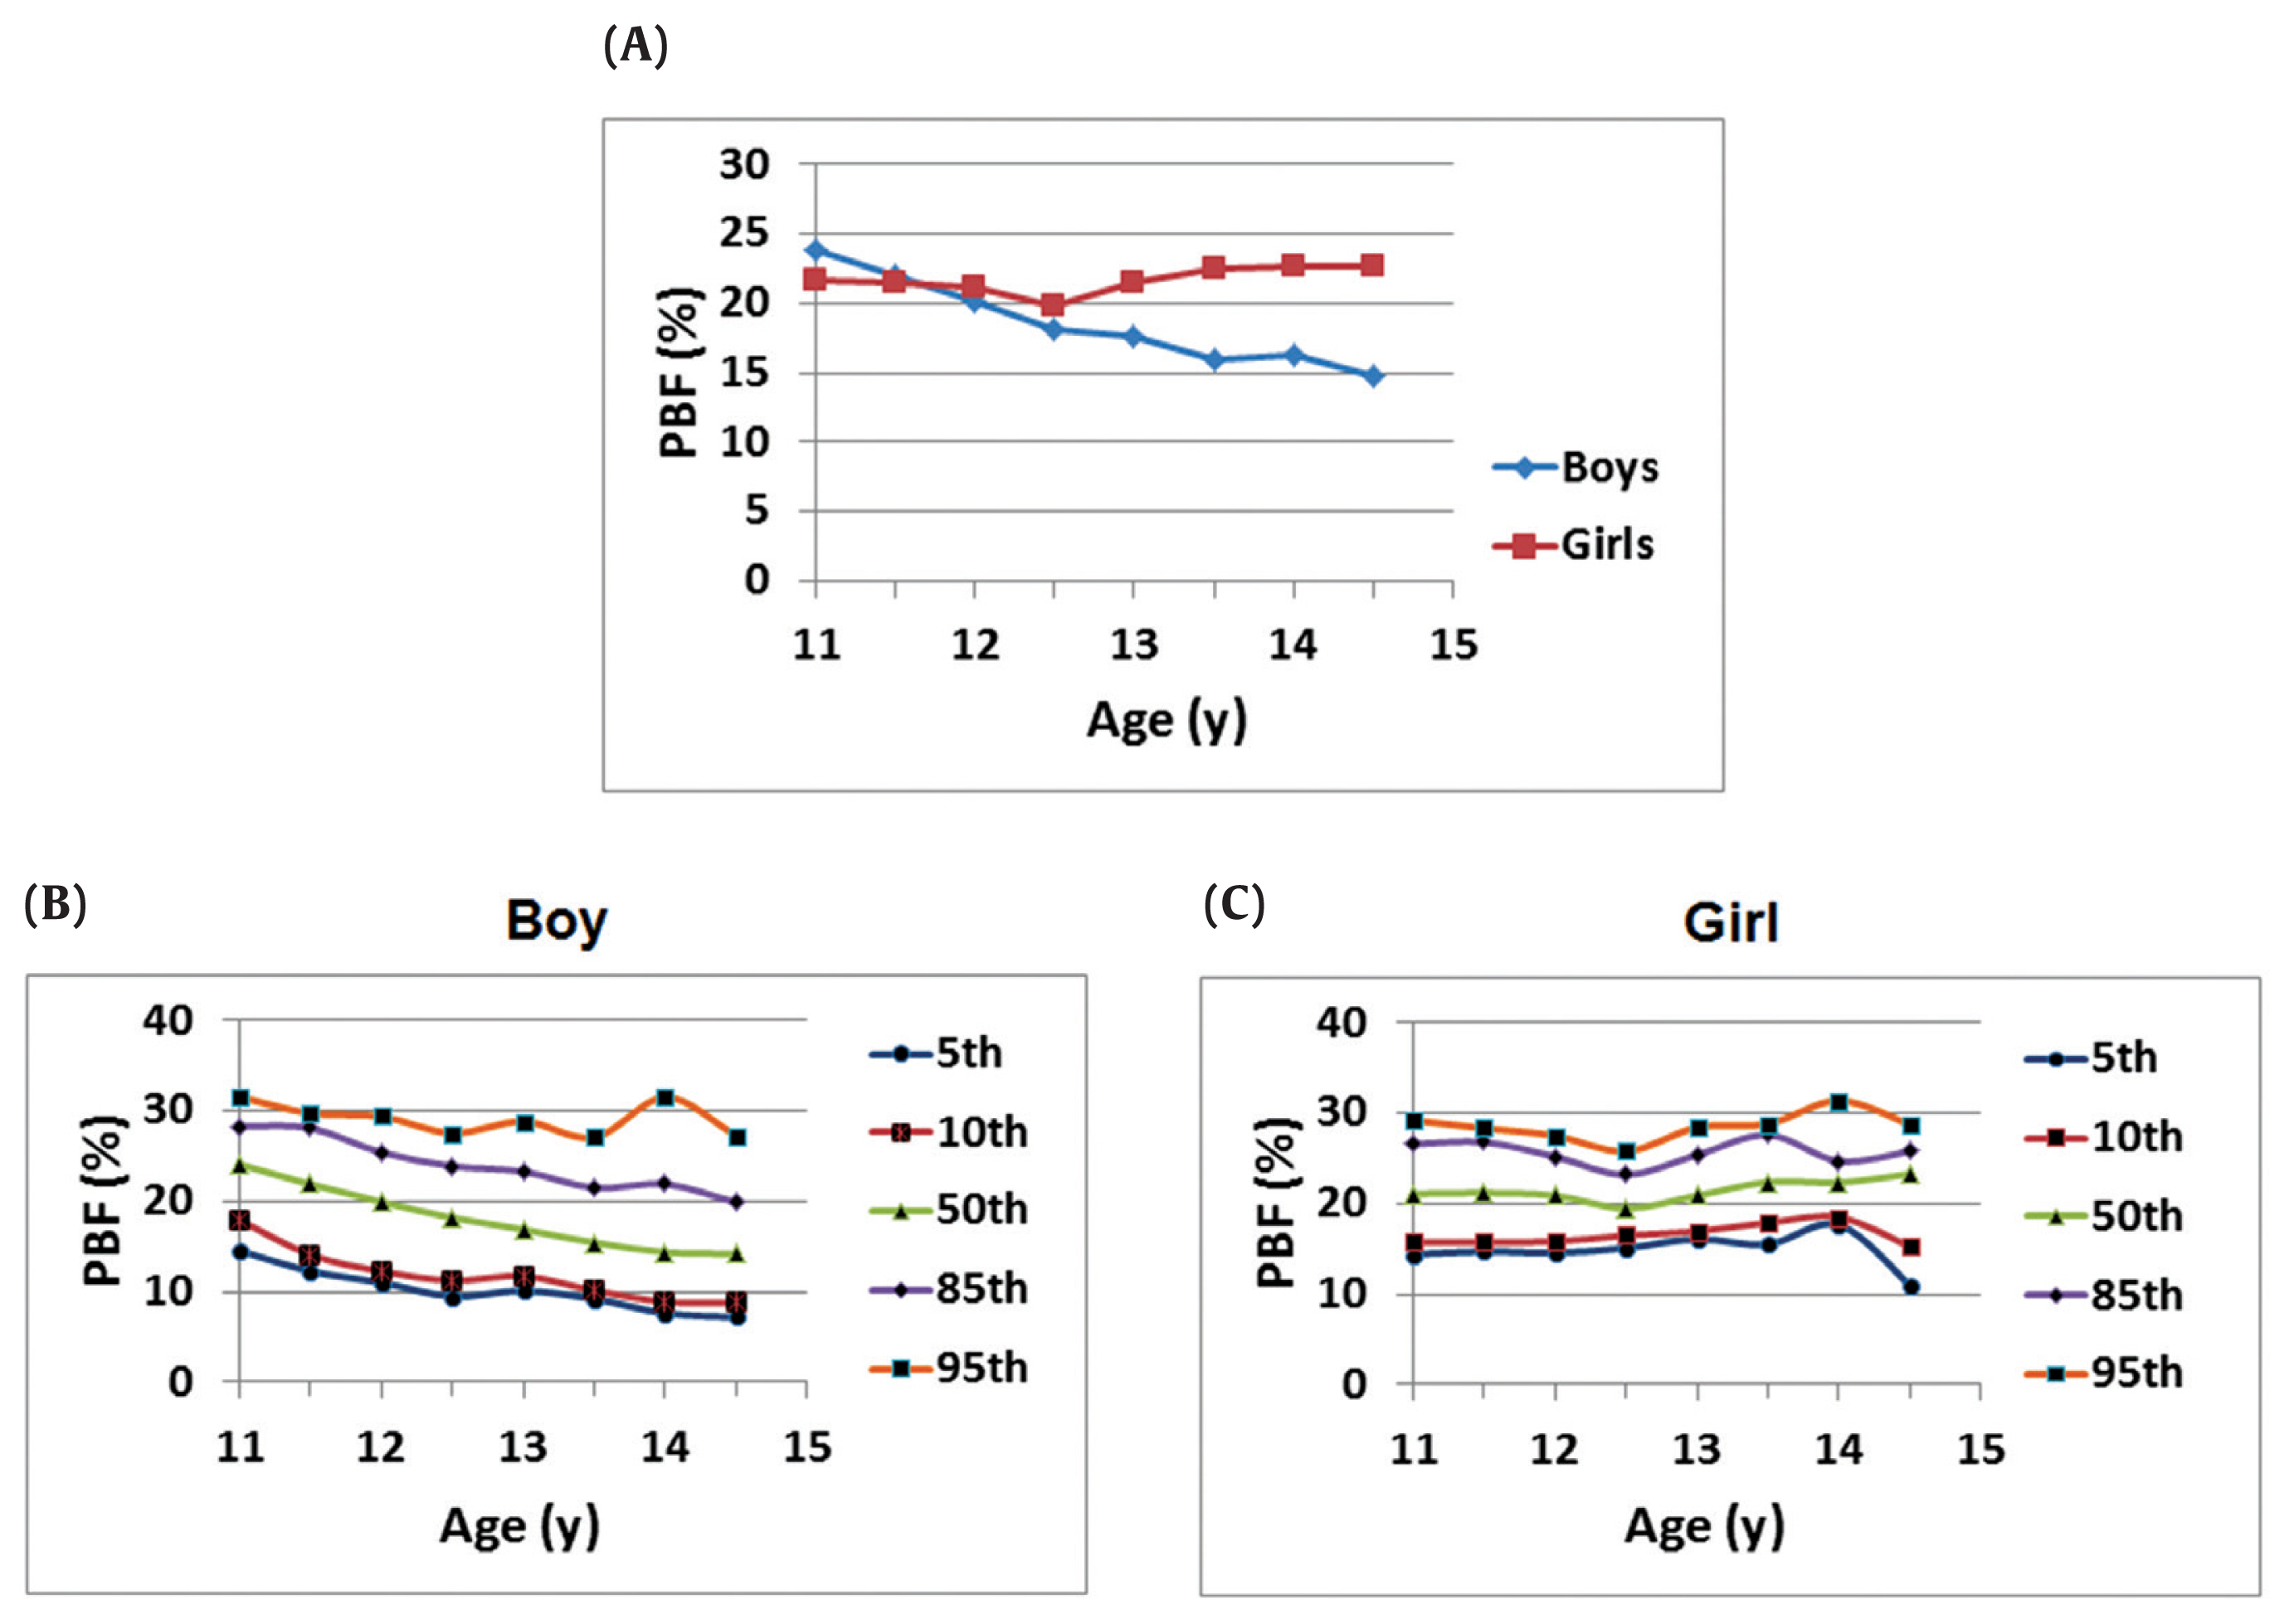
Tendency and percentile of PBF in study participants. (A) PBF by age and gender. (B) Selected percentiles of smoothed PBF among boys aged 11–14.5 years, and (C) selected percentiles of smoothed PBF among girls aged 11–14.5 years.
PBF = percentage of body fat.
Estimated percentile curves for the 5th, 10th, 50th, 85th, and 95th PBF were calculated for the overall population of boys and girls (Figures 1B and 1C). The data indicated that the pattern of development for PBF differed for boys and girls between 11 and 15 years. Among boys, there was a drop in PBF in early adolescence which was especially pronounced at the higher percentiles (Figure 1B). This pattern was not seen in girls (Figure 1C).
3. A strong correlation between fat content and PBF in study participants
Pearson’s correlation analysis was performed to test the correlation between PBF vs lean mass, subcutaneous fat, and other parameters for determining obesity and being overweight [BMI, waist and hip circumferences (Table 2; Figure 2)]. As expected, both PBF and BMI were significantly positively correlated to subcutaneous fat, waist and hip circumferences, but not to lean mass (Table 2). Importantly, a stronger correlation between PBF and fat content (Pearson’s r=0.860, p < 0.0001) was observed, than between BMI and fat content (Pearson’s r = 0.521, p < 0.0001) (Table 2; Figures 2B and 2C). This result indicated that PBF reflected the fat content in the body more accurately than BMI in the study participants. Therefore, PBF may be a more suitable indicator for determining obesity and being overweight in adolescents.
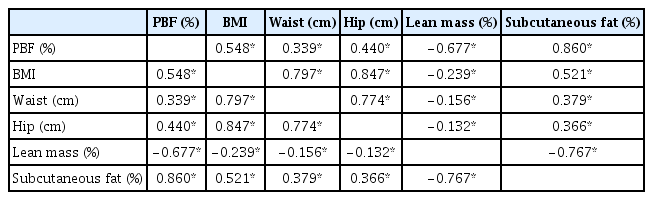
Pearson’s correlation analysis for body parameters in study participants (n = 899).

A strong correlation between fat content and PBF in study participants. Pearson’s correlation coefficient was calculated to analyze the relations (A) between PBF and BMI, (B) between PBF and subcutaneous fat, and (C) between BMI and subcutaneous fat.
BMI = body mass index; PBF = percentage of body fat.
4. Prevalence of participants being overweight or obese according to geographical area
PBF percentiles and BMI criteria were used to determine the prevalence of overweight or obese adolescents according to geographical location (Figure 3). Using both PBF and BMI, differences were observed in the proportion of overweight and obese boys and girls. The rate of overweight or obese boys was lower using PBF than using BMI (Figure 3A). Meanwhile, the percentage of obese girls classified by PBF was slightly higher than by BMI criteria (Figure 3A). By using BMI, there were 11.01% (n = 99) overweight participants which were not found to be overweight or obese using PBF. In the participants classified as overweight by PBF, 3.00% (n = 27) were not considered to be overweight or obese using BMI. In both genders, there were 1.44% (n = 13) identified as overweight with BMI that were also found to be obese using PBF, whilst 2.89% (n = 26) were categorized as being overweight by PBF and obese using BMI.

Using of PBF to identify being overweight and obese in study participants. (A) Percentage of overweight or obese participants classified by PBF vs BMI. Prevalence of being overweight and obese defined by PBF in (B) Hanoi and (C) Nam Dinh city.
BMI = body mass index; PBF = percentage of body fat.
Using PBF percentiles, the prevalence of participants being overweight or obese was compared between the cities of Hanoi and Nam Dinh (Figures 3B and 3C). In Hanoi, the rate of participants being overweight was 11.6%, which was higher than in Nam Dinh (8.7%). Moreover, the rate of obesity in Hanoi (5.1%) was also higher compared with Nam Dinh (3%).
Discussion
BMI is widely used to assess being overweight and obese, and standard cut-off values are widely accepted for adults as well as children. However, there is evidence to indicate that BMI is not a perfect standard to define obesity and being overweight, especially in children and adolescents where BMI does not completely reflect accurate fat mass [12]. Some studies in adults indicated that there was a strong correlation between BMI and PBF with R2 ranging from 0.7 to 0.8 [13,14]. Meanwhile, in children the relationship between BMI and PBF has been reported to be much weaker (r < 0.6) [15–17], and is consistent with this study (r < 0.548). This weaker relationship may be due to the asynchronous changes in fat mass and lean mass during development [18]. Children and teenagers with long legs for their height have lower BMI values compared to children with shorter legs relative to their height [19]. In mammals, there are 2 types of fat tissues (white and brown adipose) which have opposite roles for lipid storage [20–22]. The percentage of white fat content in the body is indicative of being overweight or obese. Fat mass has been used to determine adiposity in both animals [9,11] and humans [23,24]. In this study, the proportion of adolescents who were overweight or obese according to the BMI index, was much higher than the proportion determined by the PBF index. According to Yajnik and Yudkin [25], 2 people may have the same BMI but different PBF. This is because body weight includes fat mass and lean mass, and these can differ between people. Therefore, BMI has limitations in determining adiposity across participants.
PBF showed a downward trend in adolescent boys with increasing age, compared to adolescent girls where there was a slight increase in PBF with age (Figure 1A). These differences in PBF trends between the genders at puberty was similar to observations by Taylor et al [26]. Normally, during the adolescent period, boys gain more muscle and lean tissue than adipose tissue, while this is opposite in girls and they gain more fat [27]. In this adolescent period, the level of adiposity may diversify widely depending on age, gender and pubertal development [28]. To date, there has been no PBF range to determine overweight and obese classifications in Vietnamese adolescents. There are considerable changes in body composition during adolescence adjusted by gender and pubertal development differences [28]. Therefore, it is not easy to define suitable PBF cut-off values for adolescents in the pubertal period.
To define clinical and epidemiological cutoffs, the 85th percentile was used as a lower limit for being overweight, and the 95th percentile was used for the lower limit of obesity. The oscillation of PBF for overweight and obese girls in this study was lower than when the Tanita standard was used [29] (designed to provide similar results of overweight and obese children as IOTF and Centers for Disease Control and Prevention standards [30]), and when the Korea criterion was used [25]. The oscillation of PBF for overweight and obese boys in this study was similar to those of the Tanita standard [30]. However, PBF cut-off values for being overweight or obese in this study were much lower than that for USA children and adolescents in both girls and boys [31]. PBF cut-off values for being overweight or obese in Korean adolescent girls tended to be higher than those cut-off values in Vietnamese girls as they become older. In contrast, PBF cut-off values for overweight Vietnamese boys was higher than in Korean boys as they become older. For obesity, PBF cut-off values for Vietnamese boys were similar to Korean boys [32]. Observations from a study in Tehran City showed that a comprehensive lifestyle intervention decreased the PBF in obese adolescents, although these changes were not reflected in the BMI. It is possible that BMI is not a good indicator for obesity management intervention [33]. PBF percentiles (measured using bioelectrical impedance) by age and gender in children and adolescents in Bogota, Colombia, have been collated and may be used as reference to assess nutritional status, and to predict cardiovascular risk due to excess fat at an early age [34].
The percentage of overweight and obese adolescents in Hanoi were higher than in Nam Dinh. The difference between these 2 cities are in social and economic development, as well as the leisure habits of people in these cities. Hanoi is the center of economy, culture and society in Vietnam. The development of fast food chain stores and restaurants were also greater in Hanoi than in Nam Dinh. These factors may be important in determining the higher proportion of overweight and obese adolescents in Hanoi compared with Nam Dinh. In a study of 764 Indian students aged 10 to 18 years, who were randomly chosen from government and private schools, the quality of food and eating habits was highly correlated to PBF. Children with positive eating behaviors (such as eating a regular breakfast), had a lower mean PBF, while children who often missed their breakfast had less physical activity, and this strongly correlated to a higher mean PBF [35].
This study was limited because the effect of factors that changed PBF were not considered, therefore a larger study may enable an analysis of the correlation between PBF and environmental and genetic factors.
In conclusion, these results provide a reference distribution of PBF for Vietnamese adolescents aged 11 years to 14.5 years. Although BMI is widely applied, using an extra criteria such as PBF would define being overweight or obese more accurately in adolescents.
Notes
Conflicts of Interest
The authors have no conflicts of interest to declare for this study.