
Articles
- Page Path
- HOME > Osong Public Health Res Perspect > Volume 8(2); 2017 > Article
-
Original Article
Childhood Obesity Is a High-risk Factor for Hypertriglyceridemia: A Case-control Study in Vietnam - Nguyen Thi Hong Hanha, Le Thi Tuyeta, Duong Thi Anh Daoa, Yang Taoc, Dinh-Toi Chua,b
-
Osong Public Health and Research Perspectives 2017;8(2):138-146.
DOI: https://doi.org/10.24171/j.phrp.2017.8.2.06
Published online: April 30, 2017
aHanoi National University of Education, Hanoi, Vietnam
bCentre for Molecular Medicine Norway, Nordic EMBL Partnership, University of Oslo and Oslo University Hospital, Oslo, Norway
cCollege of Food Science and Technology, Nanjing Agricultural University, China
- Corresponding author: Dinh-Toi Chu, E-mail: chudinhtoi.hnue@gmail.com
Copyright ©2017, Korea Centers for Disease Control and Prevention
This is an open access article under the CC BY-NC-ND license (http://creativecommons.org/licenses/by-nc-nd/4.0/).
Abstract
-
Objectives
- To investigate the relationship between dyslipidemia and obesity status among Viet-namese adolescents.
-
Methods
- In this case-control study, 282 adolescents (6–11 years), including 88 obese cases and 194 normal-weight controls, were recruited from a population-based cross-sectional study from two provinces in Vietnam. The anthropometric, blood lipid, and other laboratory test results of the study subjects were analyzed.
-
Results
- Obese children tended to have more visceral fat (Pearson’s r = 0.795, p < 0.0001) than subcutaneous fat (Pearson’s r = 0.754, p < 0.0001), and this difference was associated with an increase in blood triglyceride level (Pearson’s r = 0.232, p < 0.05) and a strikingly high rate of hypertriglyceridemia (38.6%). We also found that birth weight and parental body mass index were related to the status of obesity among the study subjects. However, only birth weight was significantly higher in the obese group than in the normal weight group. These findings indicate the effect of prenatal nutrition on childhood obesity. Furthermore, high-birth weight children had a surprisingly high rate of obesity.
-
Conclusion
- Together, our data suggest that obesity increased the risk for hypertriglyceridemia, which was, at least partially, due to prenatal nutrition.
- Obesity and overweight have become a leading health issue in the world. According to an estimation of World Health Organization (WHO), of adults aged 18 years and older, more than 1.9 billion were overweight, and 600 million were obese worldwide in 2014 [1]. WHO also reported that among children younger than age 5 years, 41 million were obese or overweight in 2014 [1]. Childhood obesity is regarded as one of the most serious global public health challenges in this century, especially in developing countries where have more than 70% of obese and overweight children worldwide [2]. Obesity is a major risk factor for several clinical implications such as dyslipidemia, type II diabetes, cancer, and hypertension, cardiovascular [3,4]. Different types of obesity depend on many factors, including the location of the overaccumulation of fat [5]. The type of obesity affects the risk for metabolic consequences; for example, visceral obesity is due to excessive fat storage around the body viscera. This type of obesity is a higher risk factor for diabetes, dyslipidemia, and other related metabolic disorders than subcutaneous obesity, which is induced by fat overaccumulation under the skin [5]. In humans, waist circumference (WC) is an indicator of visceral fat, while hip circumference (HC) reflects subcutaneous fat [6–9].
- Dyslipidemia is the abnormality of blood lipids, and it is a leading risk factor for several health issues including coronary artery disease (CAD), hypertension, and stroke [10,11]. Depending on the abnormal content in blood lipids, dyslipidemia is classified as hypercholesterolemia or high total cholesterol (TC) level, hyperbetalipoproteinemia or high low-density lipoprotein-cholesterol (LDL-C) level, hypoalphalipoproteinemia or reduced high-density lipoprotein-cholesterol (HDL-C) level and hypertriglyceridemia or elevated triglyceride (TAG) level. It is especially alarming that the proportion of children with dyslipidemia is dramatically increasing, proportional to the percentage of overweight-obesity children in both developed and developing countries. In a previous study, dyslipidemia was observed in 85.3% of overweight children and adolescents [12]. However, obesity and overweight, as well as dyslipidemia in children living in developing countries (e.g., Vietnam), have not been given enough consideration. A few reports have been reported in Vietnam, and almost all are in Vietnamese.
- In humans, the major causes of obesity and overweight are excessive energy intake, physical inactivity, and genetic susceptibility [13]. Other factors such as gene mutations, psychiatric illnesses, endocrine disorders, and medication may induce obesity in some cases [13]. Prenatal and early postnatal nutrition could affect the induction and development of obesity and overweight in later life of humans [14,15]; for example, the Dutch famine of 1944 to 1945 was found to significantly increase the obesity rates in men who were exposed to this famine during the first half of pregnancy [14]. As a consequence, obesity dyslipidemia is also regulated by genetics and nutrition, as well as other environmental factors [16,17]. According to the Bogalusa Heart Study, involving children aged 5 to 17 years, the distribution of central fat determined by WC was associated with abnormality of TAG, LDL-C, HDL-C levels [18].
- In this study, we aimed to investigate the association between obesity and dyslipidemia in children aged from 6 to 11 years in the Thai Nguyen and Hai Duong provinces of Vietnam. We also studied the effects of genetics and nutrition during pregnancy on childhood obesity in selected subjects.
INTRODUCTION
- 1. Study populations
- A case-control study was conducted with a total of 282 subjects (88 obese cases and 194 normal controls) recruited from a cross-sectional population-based study. First, 2,939 participants, who represented the entire population aged 6 to 11 years in the Nguyen Trai primary school (Hai Duong province) and Doi Can primary school (Thai Nguyen provinces), were selected from October to December 2015. All of them were Kinh (the major ethnic group in Vietnam). Children with obesity and normal weight were classified using the criteria of age- and sex-specific body mass index (BMI) cut-off points proposed by the International Obesity Task Force (IOTF, 2000). Children who were classified as being underweight or having stunting or wasting based on the WHO criteria (2007) were excluded from the study. In addition, children who were obese due to medical reasons were also excluded. The subjects had no evidence of diseases related to atherosclerosis, CAD, diabetes, or mental disorders. None of them was using lipid-lowering medication when the blood sample was taken. For dyslipidemia analysis, 2 mL of venous blood was collected from the selected subjects.
- 2. Measurements
- Anthropometric indices, including weight, height, WC, and HC, were measured twice for all subjects, and the mean was used for analysis. Body weight and height were measured with subjects in light clothing and without shoes. BMI was calculated as the weight per square of the height (kg/m2). Obesity, overweight, and normal-weight children were classified using criteria of age- and sex-specific BMI cut-off points proposed by the WHO (2007). Children who were obese due to medical reasons were excluded from the study. WC was measured midway between the lower rib margin and the iliac crest, while HC was measured at the broadest circumference below the waist. The measurement WC and HC was performed in closed rooms. This measurement was performed in 2 separate groups for boys and girls. A self-report questionnaire was completed by parents to collect data on children’s general health information and family history of dyslipidemia. Blood lipids and lipoproteins were measured from samples obtained after an overnight fast. Blood samples were collected in EDTA-containing tubes. Serum TC and TG were determined with an enzymatic method. Serum HDL-C and LDL-C levels were measured through a direct assay. All determinations were performed with an autoanalyzer (Type Architect C8000; Abbott Ltd., Abbott Park, IL, USA) in Medlatec Hospital of Hanoi City, General Hospital of Hai Duong province, and Medical University Hospital of Thai Nguyen province.
- 3. Diagnostic criteria
- Dyslipidemia was diagnosed according to the criteria of the National Cholesterol Education Program (1992) for TC and LDL-C and US National Institutes of Health Heart, Lung, and Blood Institute (Expert Panel on Integrated Guidelines for Cardiovascular Health and Risk Reduction in Children and Adolescents, 2011) for HDL-C and TAG.
- Hypertriglyceridemia was defined as TAG ≥ 100 mg/dL (children age, < 10 years) or TAG ≥ 130 mg/dL (children age ≥ 10 years). Hypercholesterolemia was defined as TC 200 mg/dL. Hyperbetalipoproteinemia was defined as LDL-C ≥ 130 mg/dL. Hypoalphalipoproteinemia was defined as HDL-C ≤ 35 mg/dL. The individuals with at least one of the four criteria above were defined as having dyslipidemia.
- 4. Statistical analysis
- Data are expressed as the mean ± standard error of the mean. Analyses were performed using SPSS 16.0 (SPSS Inc., Chicago, IL, USA) or GraphPad Prism 5.0 as done in our previous works [19–22]. The Student’s t-test was used for single comparisons or two-way analysis of variance (ANOVA) for multiple group comparisons. The chi-square test or Kruskal-Wallis test was also used when appropriate. Unless otherwise specified, p < 0.05; p < 0.01, and p < 0.001; and not significant, p > 0.05.
- 5. Ethics issue
- Parents of the study subject were asked for their agreement with the statement written by the National Institute of Nutrition, which clearly stated that blood samples would be used for research purposes. The Ethics Committee of the National Institute of Nutrition approved this study, according to ethical approval number No. IRB-VN01059-25 dated 31/12/2014.
MATERIALS AND METHODS
- 1. Characteristics of studied subjects
- Among 282 subjects (Table 1), children in the obese and normal-weight groups were of the same age and sex ratio. There were no differences in systolic blood pressure, TC, and LDL-C between two groups. Obese children had significantly higher weight, height, BMI, WC, HC, diastolic blood pressure, and TAG than normal ones. However, normal weight subjects had higher HDL-C in blood than obese children.
- 2. More fat accumulation in belly than hip in obese subjects
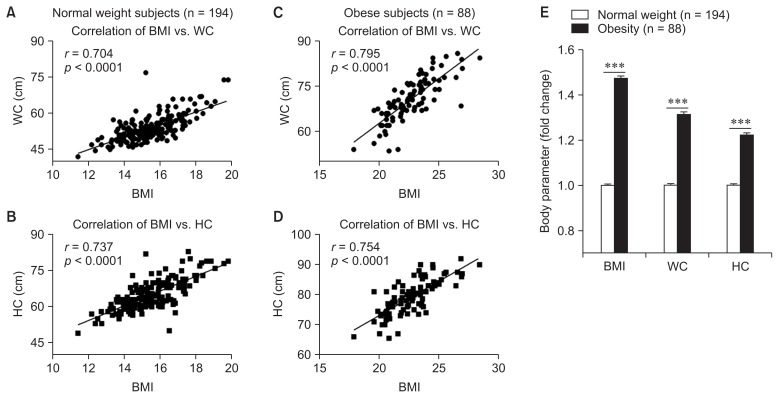
- Our data showed that in both normal and obese groups BMI was significantly and positively correlated to WC and HC (Table 2 and Figure 1A–D); this indicates that both visceral and subcutaneous fats tended to increase in studied subjects. However, among the groups, the positive correction between BMI and WC of obese subjects was strongest with an r = 0.795 (Figure 1C), and obese group increased more than 1.3 times in WC compared to the normal weight group, while this ratio for HC was only 1.2 (Figure 1E). These results suggest that obese children in this study tended to accumulate more visceral than subcutaneous fat.
- 3. Obesity increased risk for hypertriglyceridemia in the study subjects
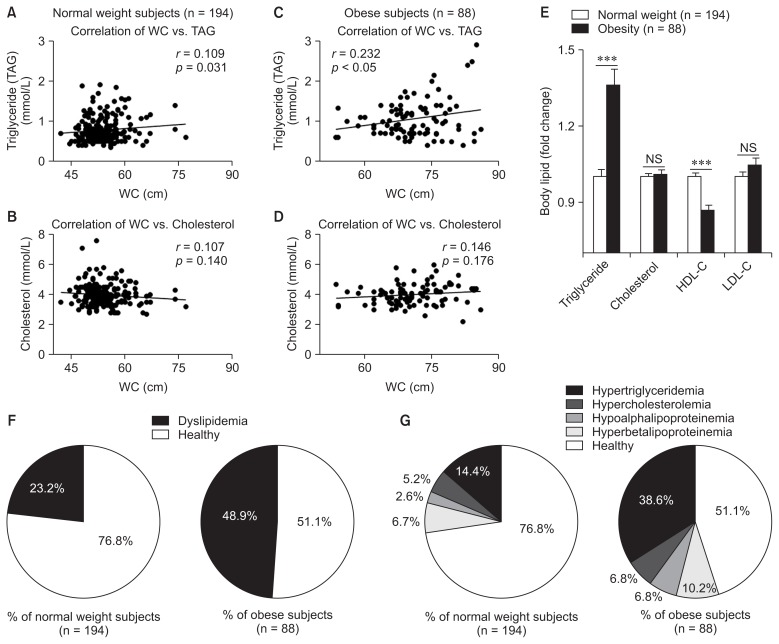
- Dyslipidemia is one of the common consequences of obesity and overweight; however, there are several types of dyslipidemia, which present different risks to health. To determine which possible dyslipidemia was induced by obesity in the subjects, we performed a Pearson’s correlation to evaluate the relations between body parameters and blood lipids of both the normal and obese groups (Table 2). Among studied parameters and blood lipids, we only saw a significantly positive correlation between WC and TG level with r = 0.231 and p < 0.05 in the obese group (Table 2 and Figure 2). Our data showed that an increase in belly fat was accompanied with an increase in blood TAG in the obese group (Figure 2C) but not in the normal-weight (Figure 2B) group. Furthermore, we found that obese subjects had a 1.4 times higher level of TAG than subjects of normal weight, while obesity did not affect TC or LDL-C, and it even reduced the HDL-C level among the study subjects (Figure 3E and Table 1). Moreover, we found that obesity significantly increased dyslipidemia in children as indicated by near 50% of children having obesity was dyslipidemia, while this percentage in normal weight children was approximately 23% (Figure 3F). This finding was supported by a significant association between obesity status and dyslipidemia (p < 0.0001) (Table 3). We also classified the type of dyslipidemia in the subjects and found a strikingly high percentage of obese children had hypertriglyceridemia (38.6%), whereas this percentage in the normal weight group was only 14.4%. Additionally, the percentages of obese children having other dyslipidemia were comparable to these of normal weight children (6.8% and 5.2% of children having hypercholesterolemia in the obese and normal groups, respectively) (Figure 3G). Together, our data strongly suggest that obesity increases the risk for hypertriglyceridemia as compared to other dyslipidemias.
- 4. Effects of prenatal nutrition and genetics on risk for obesity in the subjects
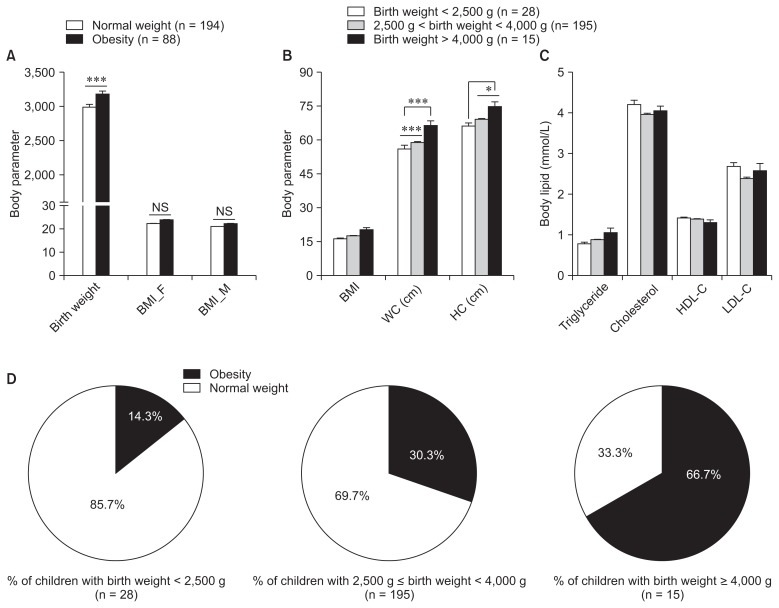
- The induction and development of obesity and overweight in humans are regulated by several factors including nutrition, genetics, and physical activity [13]. To determine the effects of prenatal nutrition and genetics on the development of obesity in the subjects, we compared the birth weight (BW) and BMI of parents in the obese and normal groups (Figure 2A). Actually, we found a higher BW and parental BMI in children with obesity versus those with normal weight; however, only the difference in BW was statistically significant (Figure 2A). As the BW of newborns partially reflects the nutritional status of healthy mothers during pregnancy, so our results indicate that prenatal nutrition significantly contributed to the induction and development of obesity in studied subjects. Furthermore, we classified the BW of the subjects into three groups: low birth weight (LBW), < 2,500 g; normal birth weight (NBW), ≥ 2,500 g, < 4,000 g; and high birth weight (HBW), ≥ 4,000 g. As expected, HBW children had a higher BMI, WC, HC, and TAG levels than the other groups (Figure 2B, C). Although no statistically significant differences for BMI and TAG were detected, this could be due to the low number of LBW and HBW children in this study. HBW subjects also had the highest percentage (66.7%) of obesity compared to LBW or NBW groups (Figure 2D). Furthermore, we have found that HBW was significantly and positively associated with dyslipidemia (p = 0.048) (Table 3). In summary, our data suggest that both prenatal nutrition and genetics contributed to obesity of the primary school children, but nutrition during pregnancy had a stronger effect on the induction and development of obesity in our subjects.
RESULTS
- As a leading health problem in humans, obesity has been attracting more and more concerns of scientists, physicians, and the public. However, optimal therapy for preventing obesity is lacking so far. Thus, our understanding of the induction, development, and consequences of obesity remains limited. Despite presenting as the most dynamic parts of the world in both economics and development, developing countries are facing several environmental and health problems, including childhood obesity. However, in these countries, there is not enough concern about this biggest public health issue among children. This study contributes to our knowledge of childhood obesity in Vietnam, one of the developing countries in the world.
- The type of obesity may lead to different risks to its related metabolic disorders such as visceral obesity increases the risk of type II diabetes in patients [5]. Our data have also demonstrated that obesity in Vietnamese primary school children is more associated with expanded visceral fat and elevated TAG level. Visceral white fat not only reduces uptake and storage of fatty acids in blood but also releases excess free fatty acids [23], which contributes to an increase in serum TG and cause hypertriglyceridemia. An excessive accumulation of fat around the viscera may induce metabolic abnormalities because the white adipose tissues secrete some harmful substrates (e.g., inflammatory adipokines) [23,24]. In this study, we were unable to check for the presence of adipokines in the blood of subjects or to investigate their fat tissues. However, our data clearly shows that obesity significantly increased the rate of dyslipidemia in children. We found hypertriglyceridemia ranked at the top among dyslipidemia in children in this study. This finding is helpful to guide treatments for dyslipidemia in obese children in Vietnam.
- Genetics and nutrition are the main causes of obesity in general; however, this varies according to ethnic group, living environment, and developmental stages [14,15,25,26]. These factors regulate the induction and development of obesity via controlling the balance in the activity between white and thermogenic adipocytes; these cells function to store or dissipate energy in mammals [27–29]. At the molecular level, genetics, nutrition, and developmental stage regulate the genes for white fat expansion such as mesoderm specific transcript (MEST) and Sfrp5 secreted frizzled-related sequence protein 5 (Sfrp5), as well as the genes for the induction and function of thermogenic adipocytes (e.g., uncoupling protein 1, peroxisome proliferator-activated receptor gamma coactivator 1-alpha, and tumor necrosis factor receptor superfamily member 9 [CD137 or 4-1BB]) [19,20,22,30].
- The involvement of genetics in obesity susceptibility has been shown in a previous study of twins [25], and genetic heritability may account for 25%–40% of the variation in human overweight and obesity [26]. In human beings, nutrition during and after pregnancy strongly affect the induction and development of obesity and other metabolic disorders in adulthood [14,15]. As a well-known example in our medical history, men exposed to the Dutch famine of 1944–1945 during the first half of pregnancy had a significantly higher obesity rate compared to those exposed to this famine during the last trimester of pregnancy and the first months of life [14]. We also found that obese children have a higher BW and parental BMI than children with normal weight. These findings indicate the contribution of prenatal nutrition and genetics to the development of childhood obesity. However, the data show a higher impact of nutrition during pregnancy, and this result may be due to the variation in the economic situation of the subjects’ parents in a developing country.
- In conclusion, our work demonstrated that childhood obesity in Vietnam increases the risk for hypertriglyceridemia, and dyslipidemia in studied subjects seems to be more closely associated with the accumulation of belly fat than hip fat. Furthermore, our study also suggests that current obesity in Vietnamese children is strongly linked to nutrition during pregnancy.
DISCUSSION
-
Acknowledgements
- This study was funded by a grant No. B2014-17-47 from the Ministry of Education and Training, Vietnam. DTC is a current Marie S. Curie postdoc under the Scientia Fellows program co-funded by Faculty of Medicine, University of Oslo and the EU Seventh Framework Programme (FP7) under Marie S. Curie scheme – People: Co-funding of Regional, National and International Programmes (COFUND), grant agreement no. 609020.
ACKNOWLEDGMENTS
-
CONFLICTS OF INTEREST
No potential conflict of interest relevant to this article was reported.
Article information
- 1. World Health Organization. Media Centre, Obesity and Overweight. Fact sheet N°311 [Internet]. Geneva: WHO; 2016. [updated 2016 June, cited 2016 Dec 15]. Available from: http://www.who.int/me-diacentre/factsheets/fs311/en/.
- 2. World Health Organization. Childhood overweight and obesity [Internet]. Geneva: WHO; 2016. [cited 2016 Aug 10]. Available from: http://www.who.int/dietphysicalactivity/childhood/en/.
- 3. Ahima RS. Connecting obesity, aging and diabetes. Nat Med 2009;15:996−7. https://doi.org/10.1038/nm0909-996. PMID: 10.1038/nm0909-996. PMID: 19734871.ArticlePubMed
- 4. Tchkonia T, Morbeck DE, Von Zglinicki T, et al. Fat tissue, aging, and cellular senescence. Aging Cell 2010;9:667−84. https://doi.org/10.1111/j.1474-9726.2010.00608.x. PMID: 10.1111/j.1474-9726.2010.00608.x. PMID: 20701600.ArticlePubMed
- 5. Gesta S, Tseng YH, Kahn CR. Developmental origin of fat: tracking obesity to its source. Cell 2007;131:242−56. https://doi.org/10.1016/j.cell.2007.10.004. PMID: 10.1016/j.cell.2007.10.004. PMID: 17956727.ArticlePubMed
- 6. van der Kooy K, Leenen R, Seidell JC, Deurenberg P, Visser M. Abdominal diameters as indicators of visceral fat: comparison between magnetic resonance imaging and anthropometry. Br J Nutr 1993;70:47−58. https://doi.org/10.1079/BJN19930104. PMID: 10.1079/BJN19930104. PMID: 8399118.ArticlePubMed
- 7. Janssen I, Heymsfield SB, Allison DB, Kotler DP, Ross R. Body mass index and waist circumference independently contribute to the prediction of nonabdominal, abdominal subcutaneous, and visceral fat. Am J Clin Nutr 2002;75:683−8. PMID: 11916754.ArticlePubMed
- 8. Chan DC, Watts GF, Barrett PH, Burke V. Waist circumference, waist-to-hip ratio and body mass index as predictors of adipose tissue compartments in men. QJM 2003;96:441−7. PMID: 10.1093/qjmed/hcg069. PMID: 12788963.ArticlePubMed
- 9. Parker ED, Pereira MA, Virnig B, Folsom AR. The association of hip circumference with incident hip fracture in a cohort of postmenopausal women: the Iowa Women’s Health Study. Ann Epidemiol 2008;18:836−41. https://doi.org/10.1016/j.annepidem.2008.07.007. PMID: 10.1016/j.annepidem.2008.07.007. PMID: 18940632.ArticlePubMedPMC
- 10. Tziomalos K, Athyros VG, Karagiannis A, Mikhailidis DP. Dyslipidemia as a risk factor for ischemic stroke. Curr Top Med Chem 2009;9:1291−7. https://doi.org/10.2174/156802609789869628. PMID: 10.2174/156802609789869628. PMID: 19849661.ArticlePubMed
- 11. Musunuru K. Atherogenic dyslipidemia: cardiovascular risk and dietary intervention. Lipids 2010;45:907−14. https://doi.org/10.1007/s11745-010-3408-1. PMID: 10.1007/s11745-010-3408-1. PMID: 20524075.ArticlePubMedPMC
- 12. Kelishadi R, Hashemipour M, Sheikh-Heidar A, Ghatreh-Samani S. Changes in serum lipid profile of obese or overweight children and adolescents following a lifestyle modification course. ARYA Atheroscler 2012;8:143−8. PMID: 23359278.PubMedPMC
- 13. Zhang Y, Liu J, Yao J, et al. Obesity: pathophysiology and intervention. Nutrients 2014;6:5153−83. https://doi.org/10.3390/nu6115153. PMID: 10.3390/nu6115153. PMID: 25412152.ArticlePubMedPMC
- 14. Ravelli GP, Stein ZA, Susser MW. Obesity in young men after famine exposure in utero and early infancy. N Engl J Med 1976;295:349−53. https://doi.org/10.1056/NEJM197608122950701. PMID: 10.1056/NEJM197608122950701. PMID: 934222.ArticlePubMed
- 15. Yang Z, Huffman SL. Nutrition in pregnancy and early childhood and associations with obesity in developing countries. Matern Child Nutr 2013;9( Suppl 1). 105−19. https://doi.org/10.1111/mcn.12010. PMID: 10.1111/mcn.12010. PMID: 23167588.ArticlePubMed
- 16. Heller DA, de Faire U, Pedersen NL, Dahlén G, McClearn GE. Genetic and environmental influences on serum lipid levels in twins. N Engl J Med 1993;328:1150−6. https://doi.org/10.1056/NEJM199304223281603. PMID: 10.1056/NEJM199304223281603. PMID: 8455681.ArticlePubMed
- 17. Ruixing Y, Yuming C, Shangling P, et al. Effects of demographic, dietary and other lifestyle factors on the prevalence of hyperlipidemia in Guangxi Hei Yi Zhuang and Han populations. Eur J Cardiovasc Prev Rehabil 2006;13:977−84. https://doi.org/10.1097/01.hjr.0000239476.79428.25. PMID: 10.1097/01.hjr.0000239476.79428.25. PMID: 17143131.ArticlePubMed
- 18. Freedman DS, Kahn HS, Mei Z, et al. Relation of body mass index and waist-to-height ratio to cardiovascular disease risk factors in children and adolescents: the Bogalusa Heart Study. Am J Clin Nutr 2007;86:33−40. PMID: 17616760.ArticlePubMed
- 19. Chu DT, Malinowska E, Gawronska-Kozak B, Kozak LP. Expression of adipocyte biomarkers in a primary cell culture models reflects preweaning adipobiology. J Biol Chem 2014;289:18478−88. https://doi.org/10.1074/jbc.M114.555821. PMID: 10.1074/jbc.M114.555821. PMID: 24808178.ArticlePubMedPMC
- 20. Chu DT, Malinowska E, Jura M, Kozak LP. C57BL/6J mice as a polygenic developmental model of diet-induced obesity. Physiol Rep 2017;5:e13093https://doi.org/10.14814/phy2.13093.PMID: 10.14814/phy2.13093. PMID: 28400497.ArticlePubMedPMC
- 21. Huong DM, Hang LTT, Ngoc VTN, et al. Prevalence of early childhood caries and its related risk factors in preschoolers: Result from a cross sectional study in Vietnam. Pediatr Dent J 2017;In press. https://doi.org/10.1016/j.pdj.2017.03.001. PMID: 10.1016/j.pdj.2017.03.001.ArticlePubMed
- 22. Jura M, Jarosławska J, Chu DT, Kozak LP. Mest and Sfrp5 are biomarkers for healthy adipose tissue. Biochimie 2016;124:124−33. https://doi.org/10.1016/j.biochi.2015.05.006. PMID: 10.1016/j.biochi.2015.05.006. PMID: 26001362.ArticlePubMed
- 23. Jensen MD. Role of body fat distribution and the metabolic complications of obesity. J Clin Endocrinol Metab 2008;93(11 Suppl 1). S57−63. https://doi.org/10.1210/jc.2008-1585. PMID: 10.1210/jc.2008-1585. PMID: 18987271.ArticlePubMedPMC
- 24. Fontana L, Eagon JC, Trujillo ME, Scherer PE, Klein S. Visceral fat adipokine secretion is associated with systemic inflammation in obese humans. Diabetes 2007;56:1010−3. https://doi.org/10.2337/db06-1656. PMID: 10.2337/db06-1656. PMID: 17287468.ArticlePubMed
- 25. Bouchard C, Tremblay A, Després JP, et al. The response to long-term overfeeding in identical twins. N Engl J Med 1990;322:1477−82. https://doi.org/10.1056/NEJM199005243222101. PMID: 10.1056/NEJM199005243222101. PMID: 2336074.ArticlePubMed
- 26. Bouchard C. Genetics of human obesity: recent results from linkage studies. J Nutr 1997;127:1887S−90S. PMID: 9278576.ArticlePubMed
- 27. Chu DT, Tao Y. Human thermogenic adipocytes: a reflection on types of adipocyte, developmental origin, and potential application. J Physiol Biochem 2017;73:1−4. https://doi.org/10.1007/s13105-016-0536-y. PMID: 10.1007/s13105-016-0536-y. PMID: 27826900.ArticlePubMed
- 28. Chu DT, Toa Y, Taskén K. OPA1 in lipid metabolism: function of OPA1 in lipolysis and thermogenesis of adipocytes. Horm Metab Res 2017;49:276−85. https://doi.org/10.1055/s-0043-100384. PMID: 10.1055/s-0043-100384. PMID: 28427098.ArticlePubMed
- 29. Chu DT, Tao Y. Molecular connections of obesity and aging: a focus on adipose protein 53 and retinoblastoma protein. Biogerontology 2017;In press. https://doi.org/10.1007/s10522-017-9698-4. PMID: 10.1007/s10522-017-9698-4. PMID: 28357524.Article
- 30. Chu-Dinh T, Chu DT. 4-1BB and the epigenetic regulations of this molecule. Med Epigenet 2014;2:80−5. https://doi.org/10.1159/000368900. PMID: 10.1159/000368900.Article
REFERENCES
Values are presented as mean ± standard error of the mean or median (interquartile range).
p-values obtained by Student’s t-test, Mann-Whitney U-test or chi-square test; bold values indicate significant difference between O and N groups. BMI, body mass index; HDL-C, high-density lipoprotein-cholesterol; LDL-C, low-density lipoprotein-cholesterol.
| BMI | Waist | Hip | Triglyceride | TC | HDL-C | LDL-C | ||||||||
|---|---|---|---|---|---|---|---|---|---|---|---|---|---|---|
|
|
|
|
|
|
|
|
||||||||
| N | O | N | O | N | O | N | O | N | O | N | O | N | O | |
| BMI | 0.704* | 0.795* | 0.737* | 0.754* | 0.047 | 0.104 | 0.041 | 0.147 | 0.008 | −0.013 | 0.053 | 0.100 | ||
|
|
||||||||||||||
| WC | 0.704* | 0.795* | 0.804* | 0.829* | 0.109 | 0.232* | −0.107 | 0.146 | −0.089 | −0.101 | −0.069 | 0.142 | ||
|
|
||||||||||||||
| HC | 0.737* | 0.754* | 0.804* | 0.829* | 0.072 | 0.158 | −0.057 | 0.148 | −0.042 | −0.025 | −0.037 | 0.132 | ||
|
|
||||||||||||||
| Triglyceride | 0.047 | 0.104 | 0.109 | 0.232* | 0.072 | 0.158 | 0.059 | 0.245* | −0.404* | −0.245* | 0.167* | 0.183 | ||
|
|
||||||||||||||
| TC | 0.041 | 0.147 | −0.107 | 0.146 | −0.057 | 0.148 | 0.059 | 0.245* | 0.438* | 0.396* | 0.796* | 0.854* | ||
|
|
||||||||||||||
| HDL-C | 0.008 | −0.013 | −0.089 | −0.101 | −0.042 | −0.025 | −0.404* | −0.245* | 0.438* | 0.396* | 0.019 | 0.108 | ||
|
|
||||||||||||||
| LDL-C | 0.053 | 0.100 | −0.069 | 0.142 | −0.037 | 0.132 | 0.167* | 0.183 | 0.796* | 0.854* | 0.019 | 0.108 | ||
Values presented are r-values;
* significant correlation with p at least < 0.05; −, negative correlation; bold values indicate the highest significant differences. N = 194, O = 88.
BMI, body mass index; WC, waist circumference; HC, hip circumference; TC, total cholesterol; HDL-C, high-density lipoprotein-cholesterol; LDL-C, low-density lipoprotein-cholesterol.
Figure & Data
References
Citations
- Nutritional status and related factors in Vietnamese students in 2022
Thu Nguyen Thi, Nhat-Le Bui, Hue Vu Thi, Suong Mai Vu Ngoc, Anh Dao Ngo, Toan Nguyen Truong, Khanh-Huyen Nguyen, Viet Hoa Nguyen, Ngoc Minh Nguyen, Kien Trinh, Dinh-Toi Chu
Clinical Nutrition Open Science.2024; 54: 140. CrossRef - Associations between dietary copper intake and hypertriglyceridemia among children and adolescents in the US
Yumeng Shi, Huan Hu, Zuxiang Wu, Ji Wu, Zhiqiang Chen, Xiaoshu Cheng, Ping Li
Nutrition, Metabolism and Cardiovascular Diseases.2023; 33(4): 809. CrossRef - Association of Platelet-Monocyte Ratio with Dyslipidemia in Saudi Arabia: A Large, Population-Based Study
Mohammad A. Alfhili, Ghada A. Alotaibi, Mohammed Alfaifi, Yousef Almoghrabi, Jawaher Alsughayyir
Life.2023; 13(8): 1685. CrossRef - Patterns of Dyslipidemia in the Anemic and Nonanemic Hypertensive Saudi Population: A Cross-Sectional Study
Mohammad A Alfhili, Jawaher Alsughayyir, Ahmed M Basudan, Hazem K Ghneim, Mohammed Alfaifi, Hassan S Alamri, Zuhier A Awan, Mohammed R Algethami
International Journal of General Medicine.2022; Volume 15: 7895. CrossRef - Eating Behaviors in Relation to Child Weight Status and Maternal Education
Priscilla Ayine, Vaithinathan Selvaraju, Chandra M. K. Venkatapoorna, Yida Bao, Philippe Gaillard, Thangiah Geetha
Children.2021; 8(1): 32. CrossRef - Ranking of a wide multidomain set of predictor variables of children obesity by machine learning variable importance techniques
Helena Marcos-Pasero, Gonzalo Colmenarejo, Elena Aguilar-Aguilar, Ana Ramírez de Molina, Guillermo Reglero, Viviana Loria-Kohen
Scientific Reports.2021;[Epub] CrossRef - Early childhood factors associated with obesity at age 8 in Vietnamese children: The Young Lives Cohort Study
Tuyen Nguyen, Karen Sokal-Gutierrez, Maureen Lahiff, Lia Fernald, Susan L. Ivey
BMC Public Health.2021;[Epub] CrossRef - Changes in the prevalence of obesity and hypertension and demographic risk factor profiles in China over 10 years: two national cross-sectional surveys
Yongze Li, Di Teng, Xiaoguang Shi, Xiaochun Teng, Weiping Teng, Zhongyan Shan, Yaxin Lai
The Lancet Regional Health - Western Pacific.2021; 15: 100227. CrossRef - Hypertension in a mountainous province of Vietnam: prevalence and risk factors
Khanh Do Nam, Nhon Bui Van, Long Vo Hoang, Toan Pham Duc, Thu Tran Thi Ha, Viet Tran Tuan, Phong Phan Dinh, Huong Trinh Thi Thu, Pau Loke Show, Vu Thi Nga, Le Bui Minh, Dinh-Toi Chu
Heliyon.2020; 6(2): e03383. CrossRef - The APOA5‐rs662799 Polymorphism Is a Determinant of Dyslipidemia in Vietnamese Primary School Children
Nguyen T. H. Hanh, Bui T. Nhung, Le T. Hop, Le T. Tuyet, Duong T. A. Dao, Nguyen T. T. Thu, Tran Quang Binh
Lipids.2020; 55(6): 683. CrossRef - An update on obesity: Mental consequences and psychological interventions
Dinh-Toi Chu, Nguyen Thi Minh Nguyet, Vu Thi Nga, Nguyen Vu Thai Lien, Duc Duy Vo, Nguyen Lien, Vo Truong Nhu Ngoc, Le Hoang Son, Duc-Hau Le, Vu Bich Nga, Pham Van Tu, Ta Van To, Luu Song Ha, Yang Tao, Van-Huy Pham
Diabetes & Metabolic Syndrome: Clinical Research &.2019; 13(1): 155. CrossRef - Prevalence and Risk Factors of Hypertension in the Vietnamese Elderly
Nhon Bui Van, Long Vo Hoang, Tung Bui Van, Hao Nguyen Si Anh, Hien Tran Minh, Khanh Do Nam, Tuan Ngo Tri, Pau Loke Show, Vu Thi Nga, Deepak B. Thimiri Govinda Raj, Dinh-Toi Chu
High Blood Pressure & Cardiovascular Prevention.2019; 26(3): 239. CrossRef - Association between salivary amylase enzyme activity and obesity in Saudi Arabia
Norah Mubarak Aldossari, Eman E. El Gabry, Gihan E.H. Gawish
Medicine.2019; 98(23): e15878. CrossRef - An update on physical health and economic consequences of overweight and obesity
Dinh-Toi Chu, Nguyen Thi Minh Nguyet, Thien Chu Dinh, Nguyen Vu Thai Lien, Khanh-Hoang Nguyen, Vo Truong Nhu Ngoc, Yang Tao, Le Hoang Son, Duc-Hau Le, Vu Bich Nga, Adam Jurgoński, Quoc-Hung Tran, Pham Van Tu, Van-Huy Pham
Diabetes & Metabolic Syndrome: Clinical Research &.2018; 12(6): 1095. CrossRef
 PubReader
 Cite
Cite


