
Articles
- Page Path
- HOME > Osong Public Health Res Perspect > Volume 10(6); 2019 > Article
-
Original Article
An Investigation into Chronic Conditions and Diseases in Minors to Determine the Socioeconomic Status, Medical Use and Expenditure According to Data from the Korea Health Panel, 2015 - Jong-Hoon Moon
-
Osong Public Health and Research Perspectives 2019;10(6):343-350.
DOI: https://doi.org/10.24171/j.phrp.2019.10.6.04
Published online: December 31, 2019
Department of Healthcare and Public Health Research, National Rehabilitation Research Institute, National Rehabilitation Center, Seoul, Korea
- *Corresponding author: Jong-Hoon Moon, Department of Healthcare and Public Health Research, National Rehabilitation Research Institute, National Rehabilitation Center, Seoul, Korea, E-mail: garnett231@naver.com
• Received: August 5, 2019 • Revised: November 4, 2019 • Accepted: November 7, 2019
Copyright ©2019, Korea Centers for Disease Control and Prevention
This is an open access article under the CC BY-NC-ND license (http://creativecommons.org/licenses/by-nc-nd/4.0/).
Abstract
-
Objectives
- This study compared the socioeconomic status, medical use and expenditures for infants (1–5 years), juveniles (6–12 years), and adolescents (13–19 years) with a chronic condition or disease to determine factors affecting health spending.
-
Methods
- Data from 3,677 minors (< 20 years old, without disabilities) were extracted from the Korea Health Panel (2015) database.
-
Results
- Minors with chronic conditions or diseases were older (juveniles, and adolescents; p < 0.001), and included a higher proportion of Medicaid recipients (p = 0.004), a higher use of hospital outpatient care (p < 0.001), and higher medical expenditure (p < 0.001) compared to minors without chronic conditions or diseases. Boys were more likely to have a chronic condition or disease than girls (p = 0.036). Adolescents and juveniles were more likely than infants to have a chronic condition or disease (p = 0.001). Medicaid recipients were more likely to have a chronic condition or disease than those who were not Medicaid recipients (p = 0.008). Minors who had been hospital outpatients were more likely to have a chronic condition or disease, compared with minors who had not been an outpatient (p = 0.001). Having a chronic condition or disease, was a factor increasing medical expenditure (p = 0.001). Medical expenditure was higher in infants than in juveniles and adolescents (p = 0.001). Infants had higher rates of medical use when compared with juveniles and adolescents (p = 0.001).
-
Conclusion
- These findings suggest that systematic health care management for minors with chronic conditions or diseases, is needed.
- Health problems that have occurred in the past can affect the current health status of an individual [1], suggesting that it may be beneficial to monitor health status from childhood to predict and prevent future health problems. Early management of health was linked in 2000, to spending cuts in health and medical care expenditure [2]. The health status of children is fundamental in the learning and development of a child, and is essential for the development of motor and sensory systems during childhood. A meta-analytical review of psychological adjustment to pediatric physical disorders was conducted in 1992 from a deficit/problem-centered perspective [3]. In this respect, a study in 2006 assessed the wellbeing of chronically ill children, their parents and their siblings according to the presence or absence of disease [4], or in comparison with the disease type or disease severity of the minors which reviewed in 1999 how individuals coped and adjusted to chronic disease [4,5].
- A chronic disease is defined as a medically diagnosed disease with slow progression [6]. People with a chronic disease are less active than those without a chronic disease, have limited social participation, are more likely to experience depression, and report a poorer quality of life [7–10]. Newacheck and Halfon [11] reported in 1998 that 6.5% of American children had a chronic condition or disease, and of those children, 66% had no activity limitation, whilst 29% had mild activity limitation and 5% had severe activity limitation. According to a review in 2003 [12], the prevalence of childhood chronic condition or disease was reported to be 5.8% in the United States and 9.8% in Finland. Lenton et al [13] reported on the prevalence and morbidity of life-threatening conditions and suggested that the study of chronic disease in children and adolescents was necessary.
- During infancy, the juvenile period and adolescence, a chronic conditions or diseases can affect the emotional wellbeing, lifestyle and quality of life of the child, and their families [14,15]. Physical problems such as pain and fatigue are major obstacles to the activities of daily living [15]. Although chronic conditions such as asthma, rhinitis, atopic dermatitis, obesity, hypertension, and diseases such as diabetes may not significantly affect daily life, the progress of the condition is difficult to predict, and is not easily treated. In other words, people with chronic illnesses have the additional burden of coping with the condition or disease management, which requires health care through specific exercise and diet, with long term medication [16].
- Studies have shown that chronic illnesses, such as sleep disturbances, chronic fatigue and asthma, not only lead to the deterioration in physical abilities and performance levels, but also alter the appearance of the patient, which has been reported to increase stress in adolescents [17–19]. In another study, symptoms of depression in children and adolescents with Type 1 diabetes mellitus, were more severe than in healthy children and adolescents, and were associated with higher healthcare expenditures in their families [20].
- It has been reported recently, that the fertility rate in Korea in 2015 was low [21]. As a result of the Korean government’s policy for prevent of low fertility, the Korean government has increased the rate of infants screening from 3% to 20%. This is an example that focuses on creating a socio-economic environment to share social responsibility for childbirth and parenting and to “get better and better”. Therefore, health care policies are associated with a strong social stability network for childbirth and child care in minors. The study of chronic conditions or diseases, and medical expenditure during the infant, juvenile and adolescent periods can have a significant impact on health care policy [21]. In particular, research into medical expenditure can reveal important information for policy enforcement [22], which can not only serve as a basis for preventing excessive medical expenditure, but can also help build an improved system for people who need health care services [23]. However, studies on differences in medical use and medical expenditure during infant, juvenile and adolescent periods, have been lacking.
- Therefore, this study investigated differences in socioeconomic status, medical use, and medical expenditure for minors with a chronic condition or disease, and investigated whether this affects medical expenditure. In addition, differences in medical expenditure among infants, juveniles, and adolescents were examined to address differences in socioeconomic characteristics, medical use and expenditure, in individuals with a chronic condition or disease. Moreover, the chronic conditions or diseases of minors were assessed to determine whether this affected medical expenditure., Therefore, differences in socioeconomic characteristics, medical use and expenditure, and chronic conditions or diseases in infants, juveniles, and adolescents were analyzed.
Introduction
- 1. Participants
- This study included data from the Korea Health Panel that was collected in 2015. The Korea Health Panel is a government-approved statistical survey (No. 92012) used to collect data on healthcare utilization, medical expenditure, and health behavior. The Korea Health Panel uses 90% of population and housing census data collected in 2005 for a representation of Korea. There were 350 enumeration districts and 8,000 households surveyed. In the 2015 Korea Health Panel, the survey period was from March 9, 2015 to September 6, 2015. The research method used was computer-assisted personal interviewing. Approval for the current study was granted to extract data through the Korea Health Panel website (https://www.khp.re.kr:444/). The data extracted for analysis included 3,709 individuals under 20 years of age, from the total of 18,130 people who participated in the Korea Health Panel during 2015. Of these, 3,677 persons were selected excluding individuals with disabilities (Figure 1).
- 2. Variables
- A total of 11 variables were used in this study. The socioeconomic characteristics were age, growth period (infant: 1 years to 5 years; juvenile: 6 years to 12 years; adolescents: 13 years to 19 years), gender, family income (decile), and whether the individual was a Medicaid recipient. The questions about chronic conditions or diseases were, “Do you have any of the following conditions or diseases (hypertension, diabetes, hyperlipemia, arthropathy, tuberculosis or other chronic conditions or diseases), or are you currently suffering from a chronic condition or disease?” (Where chronic suffering was more than 3 months). In this study, “yes” equated to 1 and “no” equated to 0. Medical use referred to emergency room care, hospitalization, and being a hospital outpatient for 1 year. Hospitalization included hospitalization without an overnight stay, admission to an intensive care unit, and hospitalization in an oriental medicine hospital or dental hospital; being a hospital outpatient included oriental medicine hospital or dental hospital. The medical expenditures were divided into 2 parts: the first included emergency, inpatient, outpatient medical expenses and emergency, hospitalization, and outpatient prescription drugs (Medical Expenditures 1), and the second included a combination of items included in medical expenditures 1 and emergency transportation expenses (ambulance), transportation expenses for inpatient and outpatient care, and care benefits (Medical Expenditures 2).
- 3. Statistical analysis
- The data were analyzed using SPSS 22 (IBM Co., Armonk, NY, USA). The participants’ chronic condition or disease, socioeconomic characteristics, medical use, and medical expenditures were confirmed by frequency analysis. Differences according to the presence of a chronic condition or disease were analyzed using independent t test for ratio variables, Mann-Whitney u tests for ordinal variables, and Chi-square tests for nominal variables. To estimate the odds ratios between presence of a chronic condition or disease, bivariate random-effects logistic regression analyses were used. In order to perform the logistic regression analysis, independent variables were defined as a growth period (infants, juvenile and adolescents), Medicaid recipient, gender, emergency room use, hospitalization use, and hospital outpatient use, respectively. The regression model was performed using a multivariate analysis. In the stepwise multiple regression analysis, independent variables were age, gender, having a chronic condition or disease, Medicaid recipient, medication uptake, emergency room use, hospitalization use, and hospital outpatient use. A one-way ANOVA or Chi-square test was used to compare the presence of chronic conditions or diseases, gender, family income, medical use, and medical expenditures among infants, juvenile, and adolescents. The statistical significance was set at p < 0.05.
Materials and Methods
- Table 1 shows the chronic conditions or diseases, socioeconomic characteristics, medical use, and expenditure in minors. Among the 3,677 subjects analyzed, there were 1,015 (27.6%) minors with a chronic condition or disease. The mean age was 11.43 ± 5.31 years. There were 1,875 (51%) males and 1,802 (49%) females. The family income (decile) was 6.59 ± 2.30. There were 126 (3.4%) Medicaid recipients, 129 (3.5%) had medication, 381 (10.4%) used the emergency room, 263 (7.2%) had hospitalization, and 3,318 (90.2%) were outpatients. Medical Expenditures 1 amounted to 249,617.3 ± 577,282.6 won, and Medical Expenditures 2 totaled 253,623.9 ± 582,536.9 won.
- Table 2 shows the comparison between socioeconomic characteristics, medical use, and expenditures according to the presence of a chronic condition or disease in minors. Minors with a chronic condition or disease were older (juveniles, and adolescents; p < 0.001), Medicaid recipients (p = 0.004), used outpatient hospital services (p < 0.001), and had a statistically significantly higher medical expenditure than minors without a chronic condition or disease (p < 0.001).
- Table 3 shows the estimation findings of the association between chronic conditions or diseases, socioeconomic characteristics, and medical use. Boys were more likely to suffer from a chronic condition or disease than girls (p = 0.036). Adolescents and juveniles were statistically significantly more likely to suffer from a chronic condition or disease than infants (p < 0.001). Medicaid recipients were more likely to have a chronic condition or disease than non-Medicaid recipients (p = 0.008). Minors who were hospital outpatients were more likely to have a chronic condition or disease compared with minors who were not hospital outpatients (p < 0.001).
- Table 4 shows the factors affecting medical expenditures. The factors affecting medical expenditure were hospitalization (p < 0.001), being a hospital outpatient (p < 0.001), presence of a chronic condition or disease (p < 0.001), using the emergency room (p = 0.002), and gender (p = 0.017; R2 = 0.162, Durbin-Watson = 1.951).
- Table 5 shows the comparison of chronic conditions or diseases, gender, family income, and medical expenditures between infants, children, and adolescents. Medical Expenditures 1 and 2 were statistically significantly higher for infants than juveniles and adolescents (p = 0.001). Infants also had a statistically significantly higher uptake of medication (p = 0.038), use of the emergency room (p < 0.001), hospitalization (p < 0.001), and being a hospital outpatient (p < 0.001) compared with juveniles and adolescents.
Results
- In Korea, finding a solution for low fertility is a social issue, but it is not expected to increase the fertility rate in the future [21,24]. In minors, health care policies relate to the creation of a socioeconomic environment for prevent of low fertility. These policies can be the foundation for raising fertility rates. In this context, there is a need for further health research on the existing minors.
- In the current study, minors with a chronic condition or disease tended to be older (juveniles and adolescents), were Medicaid recipients, and had more medical expenditure than the minors without a chronic condition or disease. In a medical expenditure panel survey conducted in the United States, juveniles with a chronic condition disease or disability, had a tendency to require more money to be allocated to hospitalization and more on medical expenses than juveniles without a chronic condition or disease [25]. An Australian working paper on poverty and disability in 2012 [26] emphasized the importance of enhancing the quality and accessibility of care for children with a condition, disease or disability, due to a high correlation with poverty. The results of previous studies and the findings of the present study were consistent [25,26] and suggest that access to health information and health-related services, for children with chronic conditions, diseases or disabilities should be supported, and health-related programs should be developed.
- The presence of a chronic condition or disease was higher in boys than girls (OR = 1.172), and was more likely to occur in minors who were recipients of Medicaid compared with non-Medicaid recipients (OR = 1.652). Chronic conditions or diseases such as hypertension, diabetes, and hyperlipidemia occur predominantly in boys [27–29]. Studies have shown that the lower the level of economic and social status and education, the higher the incidence of chronic conditions or diseases [30,31].
- The presence of a chronic condition or disease was a factor increasing medical expenditure in this study. This was a similar finding to a study on the use of healthcare for juveniles and adolescents (< 18 years) who require special health care due to a chronic condition, disease or developmental, behavioral, and emotional problems [32]. It has been reported in the US that health-related expenditures such as inpatient and outpatient care, non-prescription care, prescription drugs, and home health care services were 3 times more likely to be administered to juveniles and adolescents with chronic conditions or diseases than healthy juveniles and adolescents [32].
- Infants had higher rates of medication uptake, emergency room use, hospitalization, and being a hospital outpatient than juveniles and adolescents. Juveniles and adolescents were more likely to have a chronic condition or disease than infants and this increased medical expenditure. However, infant medical expenditure may be linked to a different cause than a chronic condition or disease. That is, the rate of infant medical use was statistically significantly higher than juvenile and adolescents, even though their chronic disease rate was lower.
- Children with chronic conditions or diseases have a high financial burden due to high health service use [33]. Improving individual health care for chronic illnesses has the potential benefit of reducing the financial burden of the nation [34]. Policymakers should recognize that there is a need to lower the national debt of medical expenditures, and the financial cost to parents of children with chronic conditions or diseases.
- This study has a number of limitations. The family level of income for the individuals in this current study was 6.59 (decile) indicating a high economic status. In other words, the income level of the participants in the study was high. The author recognizes that this is the result of this subjects. In addition, this was a study using cross-sectional data, and therefore clear proof of causality could not be established. In future research, it is necessary to study children considering sociocultural factors such as low-income families, multicultural families, and single-parent families.
Discussion
- 1. McEachan RRC, Conner M, Taylor NJ, et al. Prospective prediction of health-related behaviours with the theory of planned behaviour: A meta-analysis. Health Psychol Rev 2011;5(2). 97−144. PMID: 10.1080/17437199.2010.521684.Article
- 2. Lieu TA, Ray GT, Black SB, et al. Projected cost-effectiveness of pneumococcal conjugate vaccination of healthy infants and young children. JAMA 2000;283(11). 1460−8. PMID: 10.1001/jama.283.11.1460. PMID: 10732936.ArticlePubMed
- 3. Lavigne JV, Faier-Routman J. Psychological adjustment to pediatric physical disorders: A meta-analytic review. J Pediatr Psychol 1992;17(2). 133−57. PMID: 10.1093/jpepsy/17.2.133. PMID: 1534367.ArticlePubMedPDF
- 4. Barlow JH, Ellard DR. The psychosocial well-being of children with chronic disease, their parents and siblings: An overview of the research evidence base. Child Care Health Dev 2006;32(1). 19−31. PMID: 10.1111/j.1365-2214.2006.00591.x. PMID: 16398788.ArticlePubMed
- 5. Boekaerts M, Röder I. Stress, coping, and adjustment in children with a chronic disease: A review of the literature. Disabil Rehabil 1999;21(7). 311−37. PMID: 10.1080/096382899297576. PMID: 10471163.ArticlePubMed
- 6. Williams PD. Siblings and pediatric chronic illness: A review of the literature. Int J Nurs 1997;34(4). 312−23. PMID: 10.1016/S0020-7489(97)00019-9.Article
- 7. Pitta F, Troosters T, Spruit MA, et al. Characteristics of physical activities in daily life in chronic obstructive pulmonary disease. Am J Respir Crit Care Med 2005;171(9). 972−7. PMID: 10.1164/rccm.200407-855OC. PMID: 15665324.ArticlePubMed
- 8. Moussavi S, Chatterji S, Verdes E, et al. Depression, chronic diseases, and decrements in health: Results from the World Health Surveys. Lancet 2007;370(9590). 851−8. PMID: 10.1016/S0140-6736(07)61415-9. PMID: 17826170.ArticlePubMed
- 9. Juenger J, Schellberg D, Kraemer S, et al. Health related quality of life in patients with congestive heart failure: comparison with other chronic diseases and relation to functional variables. Heart 2002;87(3). 235−41. PMID: 10.1136/heart.87.3.235. PMID: 11847161. PMID: 1767036.ArticlePubMedPMC
- 10. Svartberg J, Midtby M, Bonaa KH, et al. The associations of age, lifestyle factors and chronic disease with testosterone in men: the Tromso Study. Eur J Endocrinol 2003;149(2). 145−52. PMID: 10.1530/eje.0.1490145. PMID: 12887292.ArticlePubMed
- 11. Newacheck PW, Halfon N. Prevalence and impact of disabling chronic conditions in childhood. Am J Public Health 1998;88(4). 610−7. PMID: 10.2105/AJPH.88.4.610. PMID: 9551003. PMID: 1508436.ArticlePubMedPMC
- 12. Merrick J, Carmeli E. A review on the prevalence of disabilities in children. Internet J Pediatr Neonatol 2003;3(1). 1−7.
- 13. Lenton S, Stallard P, Lewis M, et al. Prevalence and morbidity associated with non-malignant, life-threatening conditions in childhood. Child Care Health Dev 2001;27(5). 389−98. PMID: 10.1046/j.1365-2214.2001.00216.x. PMID: 11531912.ArticlePubMed
- 14. Davis E, Shelly A, Waters E, et al. The impact of caring for a child with cerebral palsy: Quality of life for mothers and fathers. Child Care Health Dev 2010;36(1). 63−73. PMID: 10.1111/j.1365-2214.2009.00989.x.ArticlePubMed
- 15. Eccleston C, Crombez G, Scotford A, et al. Adolescent chronic pain: Patterns and predictors of emotional distress in adolescents with chronic pain and their parents. Pain 2004;108(3). 221−9. PMID: 10.1016/j.pain.2003.11.008. PMID: 15030941.ArticlePubMed
- 16. Hatherill S. Psychiatric aspects of chronic physical illness in adolescence: Significant numbers of chronically ill adolescents have problems coping with their illness. Continuing Med Educ 2007;25(5). 212−4.
- 17. Rhee H, Wenzel J, Steeves RH. Adolescents’ psychosocial experiences living with asthma: A focus group study. J Pediatr Health Care 2007;21(2). 99−107. PMID: 10.1016/j.pedhc.2006.04.005. PMID: 17321909.ArticlePubMed
- 18. Suris JC, Michaud PA, Viner R. The adolescent with a chronic condition. Part I: Developmental issues. Arch Dis Child 2004;89(10). 938−42. PMID: 10.1136/adc.2003.045369. PMID: 15383438. PMID: 1719685.ArticlePubMedPMC
- 19. Taylor RM, Gibson F, Franck LS. The experience of living with a chronic illness during adolescence: A critical review of the literature. J Clin Nurs 2008;17(23). 3083−91. PMID: 10.1111/j.1365-2702.2008.02629.x. PMID: 19012778.ArticlePubMed
- 20. Cote MP, Mullins LL, Hartman V, et al. Psychosocial correlates of health care utilization for children and adolescents with Type 1 diabetes mellitus. Child Health Care 2003;32(1). 1−16. PMID: 10.1207/S15326888CHC3201_1.Article
- 21. Yoo SH, Sobotka T. Ultra-low fertility in South Korea: The role of the tempo effect. Demographic Res 2018;38:549−76. PMID: 10.4054/DemRes.2018.38.22.Article
- 22. Gortmaker SL, Sappenfield W. Chronic childhood disorders: Prevalence and impact. Pediatr Clin North Am 1984;31(1). 3−18. PMID: 10.1016/S0031-3955(16)34532-1. PMID: 6366717.ArticlePubMed
- 23. Li Y, Wu Q, Xu L, et al. Factors affecting catastrophic health expenditure and impoverishment from medical expenses in China: policy implications of universal health insurance. Bull World Health Organ 2012;90(9). 664−71. PMID: 10.2471/BLT.12.102178. PMID: 22984311. PMID: 3442391.ArticlePubMedPMC
- 24. Choi SW, Yellow Horse AJ, Yang TC. Family policies and working women’s fertility intentions in South Korea. Asian Popul Stud 2018;14(3). 251−70. PMID: 10.1080/17441730.2018.1512207.Article
- 25. Newacheck PW, Inkelas M, Kim SE. Health services use and health care expenditures for children with disabilities. Pediatrics 2004;114(1). 79−85. PMID: 10.1542/peds.114.1.79. PMID: 15231911.ArticlePubMed
- 26. Government of Western Australia. Working paper no.21: Child Poverty and disability. 2012.
- 27. Welsh JA, Karpen S, Vos MB. Increasing prevalence of nonalcoholic fatty liver disease among United States adolescents, 1988–1994 to 2007–2010. J Pediatr 2013;162(3). 496−500. PMID: 10.1016/j.jpeds.2012.08.043.ArticlePubMed
- 28. McNiece KL, Poffenbarger TS, Turner JL, et al. Prevalence of hypertension and pre-hypertension among adolescents. J Pediatr 2007;150(6). 640−4. PMID: 10.1016/j.jpeds.2007.01.052. PMID: 17517252.ArticlePubMed
- 29. Mortensen HB, Hougaard P. Hvidøre Study Group on Childhood Diabetes. Comparison of metabolic control in a cross-sectional study of 2,873 children and adolescents with IDDM from 18 countries. Diabetes Care 1997;20(5). 714−20. PMID: 10.2337/diacare.20.5.714. PMID: 9135932.ArticlePubMed
- 30. Kumar S, Kroon J, Lalloo R, et al. Relationship between body mass index and dental caries in children, and the influence of socio-economic status. Int Dent J 2017;67(2). 91−7. PMID: 10.1111/idj.12259.ArticlePubMed
- 31. Marmot MG, Kogevinas M, Elston MA. Social/economic status and disease. Annu Rev Publ Health 1987;8(1). 111−35. PMID: 10.1146/annurev.pu.08.050187.000551.Article
- 32. Newacheck PW, Kim SE. A national profile of health care utilization and expenditures for children with special health care needs. Arch Pediatr Adolesc Med 2005;159(1). 10−7. PMID: 10.1001/archpedi.159.1.10. PMID: 15630052.ArticlePubMed
- 33. Walter AW, Ellis RP, Yuan Y. Health care utilization and spending among privately insured children with medical complexity. J Child Health Care 2019;23(2). 213−31. PMID: 10.1177/1367493518785778.ArticlePubMed
- 34. Cunningham PJ. The growing financial burden of health care: National and state trends, 2001–2006. Health Aff 2010;29(5). 1037−44. PMID: 10.1377/hlthaff.2009.0493.Article
References
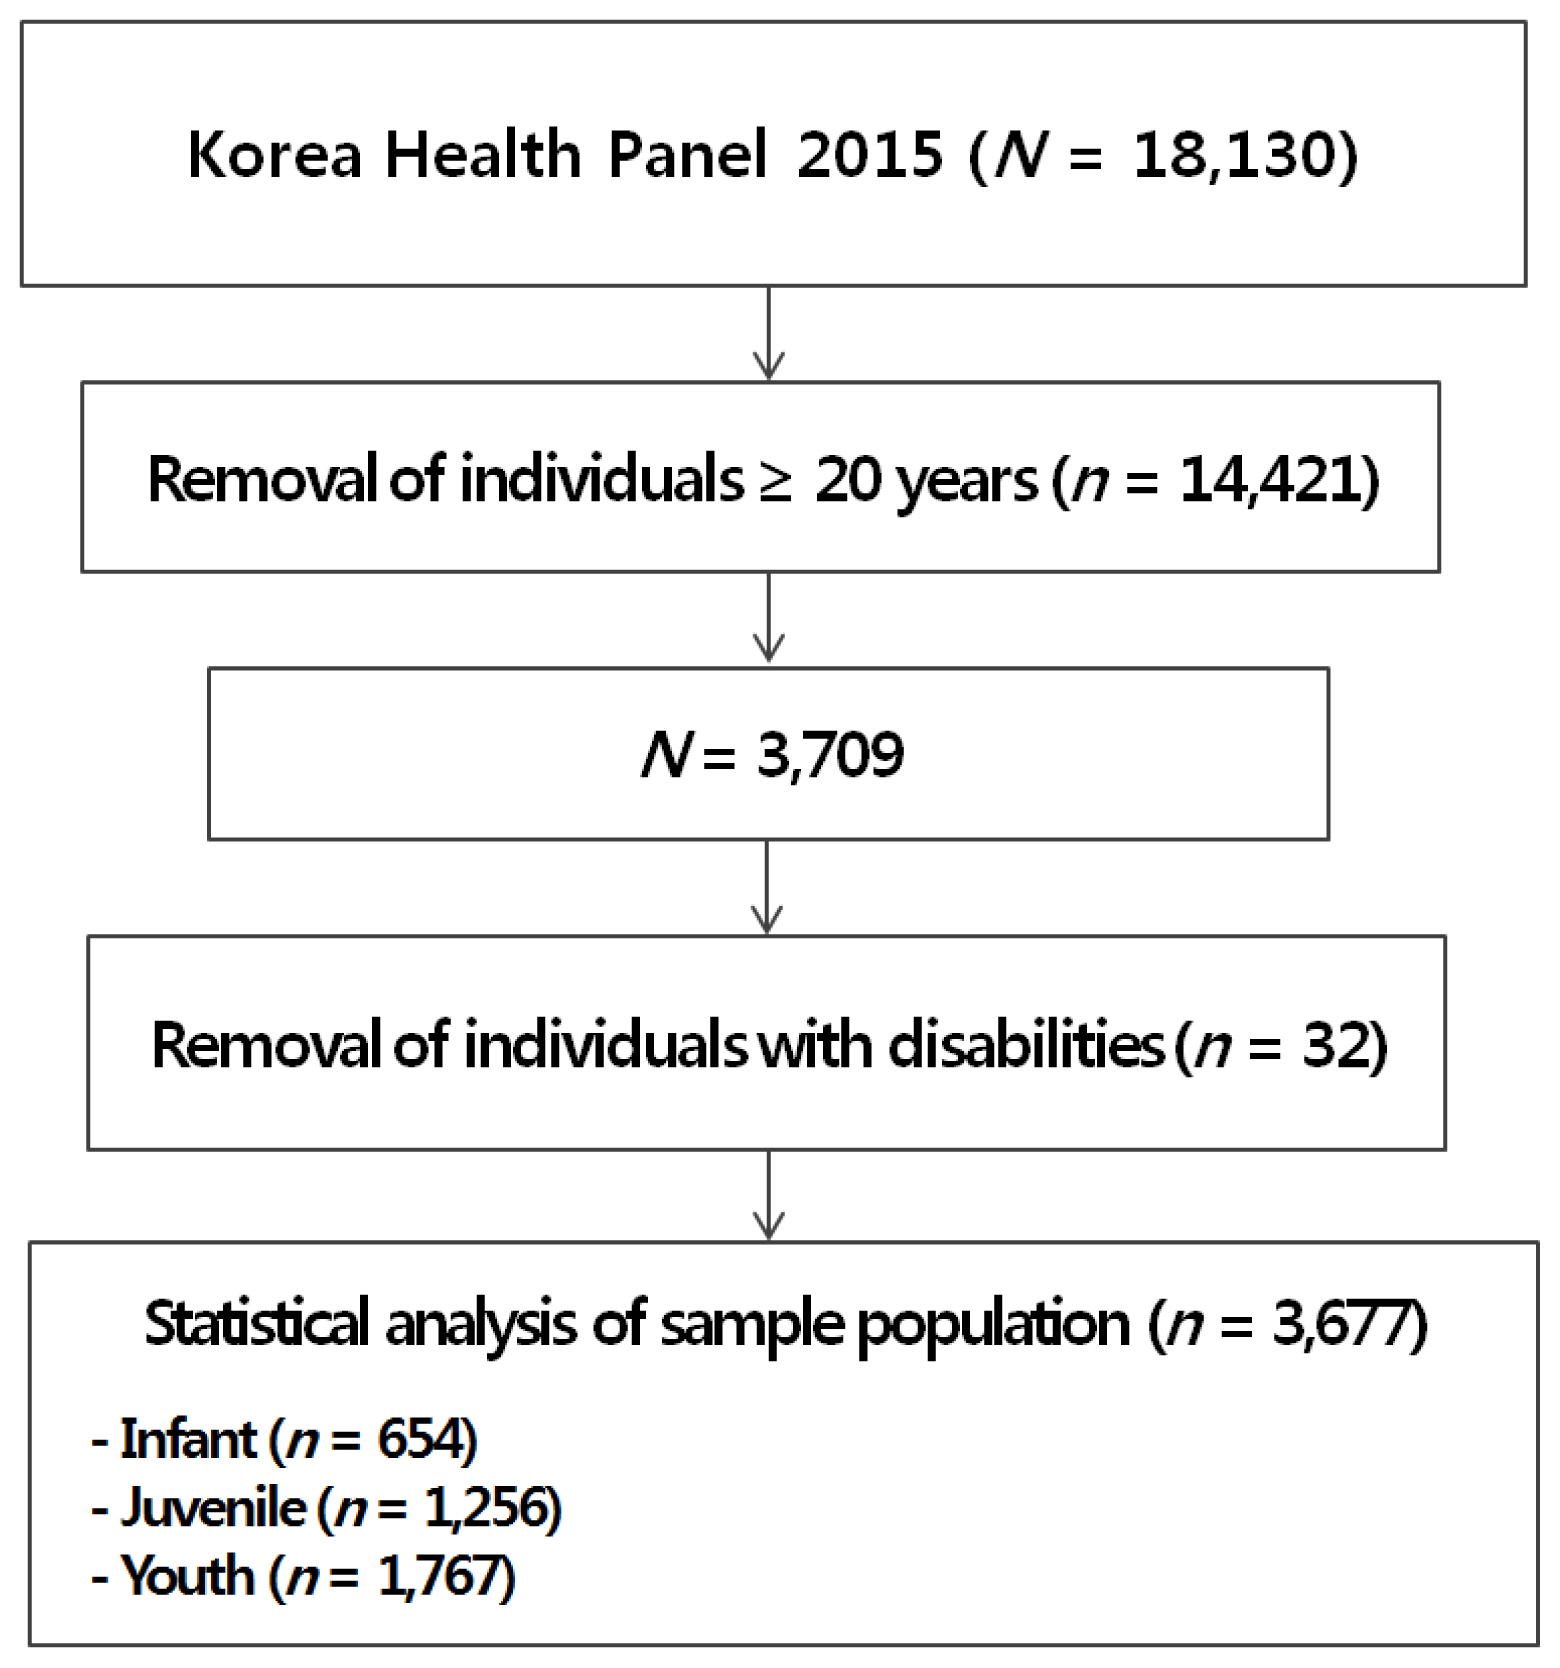
Table 1Chronic condition or disease, sociodemographic characteristics, medical use and expenditures for minors.
Table 2Comparison between sociodemographic characteristics, medical use and expenditures according to presence of chronic condition or disease in minors.
| Without CD (n = 2,662) | With CD (n = 1,015) | p | ||
|---|---|---|---|---|
| Age (y)† | 11.11 ± 5.56 | 12.27 ± 4.46 | < 0.001*** | |
|
|
||||
| Gender§ | Male | 1,331 (50.0) | 544 (53.6) | 0.051 |
| Female | 1,331 (50.0) | 471 (46.4) | ||
|
|
||||
| Family income (decile)‡ | 6.56 ± 2.29 | 6.65 ± 2.33 | 0.087 | |
|
|
||||
| Presence of MR§ | Yes | 77 (2.9) | 49 (4.8) | 0.004** |
| No | 2,585 (97.1) | 966 (95.2) | ||
|
|
||||
| Medication uptake§ | Yes | 93 (3.5) | 36 (3.5) | 0.938 |
| No | 2,569 (96.5) | 979 (96.5) | ||
|
|
||||
| Emergency room use§ | Yes | 267 (10.0) | 114 (11.2) | 0.285 |
| No | 2,395 (90.0) | 901 (88.8) | ||
|
|
||||
| Hospitalization§ | Yes | 190 (7.1) | 72 (7.1) | 0.269 |
| No | 2,472 (92.9) | 942 (92.8) | ||
|
|
||||
| Hospital outpatient§ | Yes | 2,366 (88.9) | 952 (93.8) | < 0.001*** |
| No | 296 (11.1) | 63 (6.2) | ||
|
|
||||
| Medical Expenditure 1 (won)† | 227,690.3 ± 507,263.2 | 307,124.5 ± 726,839.6 | < 0.001*** | |
|
|
||||
| Medical Expenditure 2 (won)† | 230,907.2 ± 510,186.1 | 313,202.5 ± 736,375.4 | < 0.001*** | |
Table 3Estimation findings of the association between chronic condition or disease and sociodemographic characteristics, and medical use (N = 3,677).
| Whether older with and without chronic disease | p | ||
|---|---|---|---|
|
|
|||
| Adjusted OR (95% CI) | |||
| Gender | Male | 1.172 (1.001–1.359) | 0.036* |
| Female (ref) | 1 | ||
|
|
|||
| Age period | Adolescents | 3.128 (2.461–4.107) | < 0.001*** |
| Juveniles | 3.179 (2.428–4.029) | < 0.001*** | |
| Infants (ref) | 1 | ||
|
|
|||
| Presence of MR | Yes | 1.652 (1.137–2.400) | 0.008** |
| No (ref) | 1 | ||
|
|
|||
| Medication uptake | Yes | 1.088 (0.729–1.625) | 0.680 |
| No (ref) | 1 | ||
|
|
|||
| Emergency room use | Yes | 1.256 (0.985–1.603) | 0.066 |
| No (ref) | 1 | ||
|
|
|||
| Hospitalization | Yes | 1.043 (0.772–1.409) | 0.784 |
| No (ref) | 1 | ||
|
|
|||
| Hospital outpatient | Yes | 2.231 (1.669–2.983) | < 0.001*** |
| No (ref) | 1 | ||
Table 4Factors affecting medical expenditure (N = 3,677).
| Medical expenditures | ||||
|---|---|---|---|---|
| β | t | p | F | |
| (Constant) | 141.591 | |||
| Hospitalization | 0.359 | 22.830 | < 0.001*** | |
| Hospital outpatient | 0.098 | 6.449 | < 0.001*** | |
| Chronic condition or disease | 0.054 | 3.573 | < 0.001*** | |
| Emergency room use | 0.050 | 3.167 | 0.002** | |
| Gender | −0.036 | −2.390 | 0.017* | |
| R2 | 0.162 | |||
Table 5Comparison of chronic condition or disease, gender, family income, medical use and expenditure between infants, children and adolescents.
| Infants (n = 654) | Juveniles (n = 1,256) | Adolescents (n = 1,767) | F or X2 | p | ||
|---|---|---|---|---|---|---|
| Chronic condsition or disease | Yes | 88 (13.5) | 404 (32.2) | 523 (29.6) | 82.103 | < 0.001*** |
| No | 566 (86.5) | 852 (67.8) | 1,244 (70.4) | |||
|
|
||||||
| Gender | Male | 339 (51.8) | 629 (50.1) | 907 (51.3) | 0.685 | 0.710 |
| Female | 315 (48.2) | 627 (49.9) | 860 (48.7) | |||
|
|
||||||
| Family income (decile) | 6.46 ± 2.08 | 6.62 ± 2.25 | 6.61 ± 2.41 | 1.241 | 0.289 | |
|
|
||||||
| Medication uptake | Yes | 33 (5.0) | 35 (2.8) | 61 (3.5) | 6.516 | 0.038* |
| No | 621 (95.0) | 1,221 (97.2) | 1,706 (96.5) | |||
|
|
||||||
| Emergency room use | Yes | 135 (20.6) | 138 (11.0) | 108 (6.1) | 109.305 | < 0.001*** |
| No | 519 (79.4) | 1,118 (89.0) | 1,659 (93.9) | |||
|
|
||||||
| Hospitalization | Yes | 97 (14.8) | 84 (6.7) | 82 (4.6) | 75.271 | < 0.001*** |
| No | 557 (85.2) | 1,172 (93.3) | 1,685 (95.4) | |||
|
|
||||||
| Hospital outpatient | Yes | 651 (99.5) | 1,215 (96.7) | 1,452 (82.2) | 254.888 | < 0.001*** |
| No | 3 (0.5) | 41 (3.3) | 315 (17.8) | |||
|
|
||||||
| Medical expenditure 1 (won) | 321,644.3 ± 453,879.9 | 244,556.0† ± 550,266.8 | 226,556.5† ± 632,345.0 | 6.569 | 0.001** | |
|
|
||||||
| Medical expenditure 2 (won) | 331,450.2 ± 474,230.3 | 247,372.4† ± 551,704.3 | 229,262.8† ± 635,643.4 | 7.480 | 0.001** | |
Figure & Data
References
Citations
Citations to this article as recorded by 
- Household income and maternal education in early childhood and activity-limiting chronic health conditions in late childhood: findings from birth cohort studies from six countries
Nicholas James Spencer, Johnny Ludvigsson, Yueyue You, Kate Francis, Yara Abu Awad, Wolfgang Markham, Tomas Faresjö, Jeremy Goldhaber-Fiebert, Pär Andersson White, Hein Raat, Fiona Mensah, Lise Gauvin, Jennifer J McGrath
Journal of Epidemiology and Community Health.2022; 76(11): 939. CrossRef
 PubReader
 ePub Link
 Cite
Cite
