
Articles
- Page Path
- HOME > Osong Public Health Res Perspect > Volume 4(2); 2013 > Article
-
Original Article
The Effects of Religious Attendance and Obesity on Health by Race/Ethnicity - Sanggon Nam
-
Osong Public Health and Research Perspectives 2013;4(2):81-88.
DOI: https://doi.org/10.1016/j.phrp.2013.03.002
Published online: April 30, 2013
Department of Health Administration, Pfeiffer University, Morrisville, NC, USA.
- E-mail: sanggon.nam@fsmail.pfeiffer.edu
Copyright ©2013, Korea Centers for Disease Control and Prevention
This is an Open Access article distributed under the terms of the Creative Commons Attribution Non-Commercial License (http://creativecommons.org/licenses/by-nc/3.0) which permits unrestricted non-commercial use, distribution, and reproduction in any medium, provided the original work is properly cited.
Abstract
-
Objectives:
- The objectives of this paper are to examine the effects of religion and obesity on health and determine how the relationship varies by racial/ethnic groups with data from the Panel Study of American Race and Ethnicity (PS-ARE).
-
Methods:
- Using ordinal logistic regression, the effects of religion and obesity on self-rated health and how the relationship varies by racial/ethnic groups are investigated. Additionally, to determine whether certain ethnic groups are more impacted by the frequency of religious attendance and obesity, whites, blacks, and Hispanics are analyzed separately with ordinal logistic regression.
-
Results:
- When obesity was added in focal relationship between religious services attendance and self-rated health strengthened this focal relationship which is a suppression effect between religious services attending and self-rated health adding obesity. For BMI is also significantly associated with decreased odds of reporting better health–normal weight (OR = 2.99; 95% CI = 2.43–3.67) and overweight (OR = 2.19; 95% CI = 1.79–2.68) compared to obese. Subjects who attend religious services 1–2 time a year (OR = 1.30; 95% CI = 1.04–1.62) and 1–3 times a month (OR = 1.28; 95% CI = 1.05–1.57) are associated with increased odds of reporting better health. In whites, attending religious services 1–2 times a year are associated with increased odds of reporting better health (OR = 1.48; 95% CI = 1.09–2.00) and 1–3 times a month are also associated with increased odds of reporting health (OR = 1.34; 95% CI = 1.02–1.78) compared to never attending religious attendance. The frequency of religious services attendance of blacks and Hispanics are not associated with self-rated health. For BMI, being white is more positively associated with increased odds of reporting better health than black and Hispanic subjects. Although white subjects are less likely to attend religious services more frequently than black and Hispanic subjects, the influence on self-rated health in white subjects is more evidenced than other racial/ethnic groups.
-
Conclusions:
- Although it was not proven that the association between participation in religious services and self-rated health is mediated by obesity, the research shows the suppression effect of obesity between participation in religious services and self-rated health.
- The association between religion and health is well-established in the literature. A number of research studies show a positive relationship between religion and health [1–8]. Those who attend religious services more frequently have better health than those who attend church less frequently [9] and they engage in healthier lifestyles than do those not affiliated with a church [4,10,11]. In addition, religion also helps in coping with or in protecting from stress, which can also produce better health outcomes [7,12,13]. Other research has found that “those who attend church more frequently have a greater number of social ties and interactions, rate their social ties more positively, and benefit from more frequent exchanges of goods, services, and information, than do those who attend church less frequently” [14].
- Individuals who attend religious services more frequently are more likely to be healthy than those who attend less frequently in terms of specific health outcomes, such as depression [6], cardiovascular disease [15], anxiety [5], and mortality [4,16,17]. Self-rated health is also consistently positively associated with attending religious services [3,8,18–21]. Therefore, people who attend religious services more frequently may rate their health status better than those who do not attend religious services.
- Moreover, based on these positive associations between frequency of church attendance and health, there are a few interesting studies concerning the relationship between frequency of church attendance and obesity. Research shows a positive relationship between attendance at religious services and obesity [22–26]. According to these studies, people who attend religious services more frequently tend to gain more weight than those who attend less frequently. People who are more involved in religious services tend to report better self-rated health [27,28] and less psychological distress [29].
- It is an interesting finding that people who attend religious services more frequently are healthier, but more obese. The associations between religion, obesity, and health appear to be complex. The purpose of this research is to examine whether obesity mediates or moderates the effect of religious attendance on self-rated health. In other words, this paper will address the question of whether the relationship between frequency of religious attendance and self-rated health is strengthened or weakened when obesity is considered.
- In addition, there is little, if any, research that examines the potential effects of ethnicity on these relationships. Moreover, research has not explored associations between frequency of church attendance, health, and obesity by racial/ethnic group. Therefore, the present research will fill this research gap by investigating the relationships among religion, obesity, and health in white, black, and Hispanic populations.
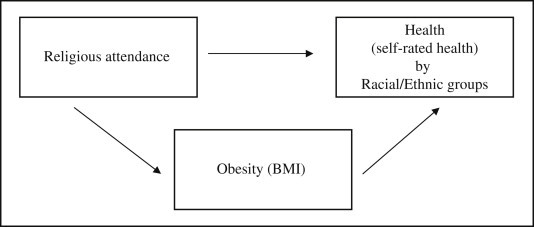
- The objective of this paper is to examine the effects of religion and obesity on health and assess how the relationship varies by racial/ethnic group shown in Figure 1. The central relationship will be the association between frequency of attendance at religious services and self-rated health, with obesity the hypothesized intervening variable. The primary research question is whether the association between participation at religious services and self-rated health is mediated by obesity. The second goal of the research is to examine variation in this relationship by race/ethnic group. It was hypothesized that the aforementioned relationships will vary by race/ethnicity. These hypotheses will be evaluated with data from the Panel Study of American Religion and Ethnicity (PS-ARE) [30].
Introduction
- 2.1. Study population
- Data from the PS-ARE are used in this research [30]. The PS-ARE seeks to understand the impact of religion on everyday life, and ultimately the connections between religious change and other forms of change in individuals and families over the course of their lives and across generations. It includes substantive modules on family relationships, deviance, health, civic participation and volunteering, moral and social attitudes, and race and ethnic issues.
- The PS-ARE is an unprecedented, multi-level panel study that is specifically focused on religion and ethnic/racial diversity in the USA. The target study population is non-institutionalized civilians in the USA who are 18 years of age or older at the time of the survey in 2006. The PS-ARE includes 2610 respondents representing the diversity of the US population. The initial procedure utilizes a sampling frame of primary sampling units defined as three-digit zip code tabulation areas that cover 98% of the occupied housing units in the USA. An average of 100 addresses from each selected zip code are randomly selected. Questionnaire letters are sent to all participating households 1 week before the first visit to sample subject households. During the first visit, sample households are selected and screened using a paper-and-pencil instrument. When individuals in selected households agree to participate, an average of 80 minutes is required to complete the questionnaire. The questionnaire is administered using a laptop computer with an incentive of US dollars (USD)50 to complete the interview. The response rate for the survey is 50%.
- Of the total of 2610 individuals, only 2390 respondents are used in this analysis after Asian and other racial groups (220 individuals) were excluded. Of the these 2390 individuals, 1292 (54.1%) are white, 543 (22.7%) are African American, and 555 (23.2%) are Hispanic. The PS-ARE employed an oversampling procedure for racial/ethnic minorities [30].
- 2.2. Measures 2.2.1.
- For this research paper, age, gender, marital status, education, household income, and the number of household members are used as covariates. Regarding marital status, the original answer choices included: married (1); living with an unmarried partner (2); widowed (3); divorced/annulled (4); separated (5); and never married (6). However, in the analysis, marital status is categorized into two categories as married (1 and 2 combined) and unmarried (3, 4, 5, and 6 combined). Education is also re-categorized as “less than high school”, “high school completed”, “some college”, and “bachelor’s degree or higher”. Original household income was re-categorized as “USD19,999 or less”, “USD20,000–USD39,999”, “USD40,000–USD69,999”, and “USD70,000 or more” from the initial 20 categories. 2.2.2.
- Religiosity is measured by the frequency of attending religious services. Respondents are asked, “How often do you attend worship services at your congregation?” Answers choices are: “never” (1); “once or twice” (2); “several times (but less than once a month)” (3); “once a month” (4); “2–3 times a month” (5); “once a week” (6); “twice a week” (7); and “three times a week or more” (8). In this analysis, religiosity is modified into four categories: “1–2times a year” with (1) and (2) combined; “1–3 times a month” with (3), (4), and (5) combined; and “more than 1 time a week” with (6), (7), and (8) combined. Finally, missing cases (1335) from the initial answer are categorized as “Never”. 2.2.3.
- Body mass index (BMI) is calculated by dividing weight in kilograms by height in meters squared (km/m2). However, a non-metric approximation can be calculated by dividing weight in pounds by height in inches squared and multiplying the result by 703 [31]. For this research, BMI is calculated based on the formula with weight and height derived from the data sample. BMI is categorized by “underweight (less than 18.5)”, “normal weight (18.5–25.0)”, “over-weight (25.0–30.0)”, and “obese (more than 30)” based on the National Institutes of Health obesity standard [32]. 2.2.4.
- For race/ethnic groups, respondents are asked, “What race or ethnic group do you consider yourself?” Answer choices consist of white, black, Hispanic, Asian American, Pacific Islander, American Indian, or mixed. As mentioned earlier, only white, black, and Hispanic populations are used in the analysis. The final sample included 2390 respondents. 2.2.5.
- Health is assessed by self-reported health. The original question capturing the level of self-rated health asked, “Would you say your health in general is excellent, very good, good, fair, or poor?” Answers choices are: “excellent” (1); “very good” (2); “good” (3); “fair” (4); and “poor” (5). However, reverse coding is used in the analysis with “poor” (1) to “excellent” (5) for ordinal logistic regression. 2.2.6.
- Statistical Analysis System (SAS Institute Inc., Cary, NC) version 9.2 was used in this analysis. The selected α level for statistical significance is 0.05. The descriptive statistics examine the frequency of sample statistics by racial/ethnic group. Using ordinal logistic regression, the effects of religion and obesity on health and how the relationship varies by racial/ethnic groups are investigated. Finally, white, black, and Hispanic groups are analyzed separately with ordinal logistic regression in order to examine whether certain ethnic groups are more impacted by the frequency of religious attendance and obesity. The p value for the proportional odds model assumption is 0.055, which is more than 0.05, so the assumption is not violated for ordinal logistic regression. 2.2.7.
- My research hypotheses included the following (Figure 1):
H1: Is frequent attendance at religious services associated with better self-rated health?
H2: Is the association between frequent attendance at religious services and health mediated by obesity?
H3: Do the associations between frequent attendance at religious services, health, and obesity vary by race/ethnicity?
Materials and Methods
2.2.1. Sociodemographic measurements
2.2.2. Frequency of attending religious services
2.2.3. Body mass index
2.2.4. Race/ethnicity
2.2.5. Dependent variable: self-rated health
2.2.6. Statistical analysis
2.2.7. Research hypotheses
- Table 1 presents descriptive statistics of the overall sample. Of the total of 2390 individuals, 1292 (54.1%) are white, 543 (22.7%) are African American, and 555 (23.2%) are Hispanic. The mean age was 47.01 years for white individuals, 41.98 years for black individuals, 38.54 years for Hispanic individuals, and 43.90 years for the total population. The sample included 40.4% men and 59.6% women. Regarding education, 14.3% of the sample population did not finish high school, more than a third (41.2 %) finished high school, 19.2% held some college degree, and 25.4% had a bachelor’s degree or higher.
- Overall, white individuals had the highest education followed by African Americans and Hispanics. More than half of the sample (58.4%) were married (living with spouse or unmarried partner). Regarding household income, around 50% of participants reported total annual household incomes of less than USD39,999. Generally, white participants had higher average household incomes than black or Hispanic participants. Mean household size was 2.57 people (white), 2.88 people (black), 3.53 people (Hispanic), and 2.86 people (total). Regarding the frequency of religious attendance, slightly more than 50% of the sample never attended religious services. Black and Hispanic respondents were more likely to attend religious services more frequently than white respondents.
- Mean BMI was 27.01 (white), 29.95 (black), 28.05 (Hispanic), and 27.92 (total). More than 50% of the sample reported their health as very good or excellent. Almost 25% of the sample reported their health as good. White participants reported better health than African American or Hispanic participants.
- Table 2 presents the ordinal logistic regression analysis of self-reported health on BMI and religious attendance. In Model 1, older age is negatively associated with better health (OR 0.97; 95% CI 0.97–98), which indicates older people tend to have worse self-rated health. Higher income and education are associated with increased odds of reporting better health. High income and education are positively associated with better self-reported health in all models (Models 1–5). In Model 2, being unmarried is negatively associated with better health (OR 0.83; 95% CI 0.69–1.00). In Models 2 and 3, being unmarried and living alone are associated with decreased odds of reporting better health compared to married respondents who are living with a partner. There are no significant racial differences in self-reported health. The frequency of religious attendance is included in the analysis in Model 3. Religious attendance is partially positively associated with better health. Compared to never attending religious services, individuals who attend religious services 1–3 times a month have increased odds of reporting better health (OR 1.24; 95% CI 1.01–1.51). When BMI is included in Model 4, normal weight (OR 2.95; 95% CI 2.39–3.60) and overweight (OR 2.17; 95% CI 1.77–2.66) compared to obesity are positively associated with better self-reported health. As expected, the obese tend to have poorer health. There are no significant racial differences in self-reported health. Finally, in Model 5, BMI is also significantly associated with decreased odds of reporting better health as regards normal weight (OR 2.99; 95% CI 2.43–3.67) and overweight (OR 2.19; 95% CI 1.79–2.68) compared to being obese. Religious attendance is still significantly associated with increased odds of reporting better health. Individuals who attend religious services 1–2 times a year (OR 1.30; 95% CI 1.04–1.62) and 1–3 times a month (OR 1.28; 95% CI 1.05–1.57) have increased odds of reporting better health.
- Generally, higher income, education, and frequency of religious attendance are associated with increased odds of reporting better health, whereas old age, unmarried (living alone), and BMI are associated with decreased odds of reporting better health. Gender and number of household members are not statistically significantly associated with better health in all models.
- Table 3 represents the ordinal logistic regression analysis of self-reported health on BMI and religious attendance by racial/ethnic group. In white individuals, attending religious services 1–2 times a year is associated with increased odds of reporting better health (OR 1.48; 95% CI 1.09–2.00), whereas attending religious services 1–3 times a month is also associated with increased odds of reporting better health (OR 1.34; 95% CI 1.02–1.78) compared to never attending religious services. Based on odd ratios, less attendance at religious services (1–2 times a year) is more associated with better self-rated health than attending more religious services (1–3 times a month). BMI is significantly associated with poor health in all racial/ethnic groups. BMI in white individuals is more associated with decreased odds of reporting better self-rated health compared to BMI in African Americans and Hispanics. Generally, normal weight and overweight are 2–3 times more positively associated with better self-reported health, whereas underweight is not significantly associated with self-reported health compared to obese individuals.
Results
- The objective of this research was to investigate the effect of religion and obesity on self-reported health and how the relationship varies by race/ethnicity. The first hypothesis is supported in that frequent participation in religious services is significantly associated with increased odds of reporting better health. However, in the ordinal logistic regression analysis of self-reported health on BMI and religious attendance by racial/ethnic group, only white individuals are associated with increased odds of reporting better health, while black and Hispanic individuals are not. Although white individuals are less likely to attend religious services than black or Hispanic individuals, self-rated health in white individuals is more influenced by attending religious services than in other racial/ethnic groups. Moreover, attending religious services less frequently (1–2 times a year) is more associated with better health than attending religious services more frequently (1–3 times a month).
- In summary, attending religious services frequently is significantly associated with increased odds of reporting better health compared to never attending religious services; however, attending religious services less frequently is more associated with better health than attending religious services frequently. Consequently, attendance at religious services is positively associated with self-rated health, but reversely associated with the frequency of religious services attendance.
- However, the second hypothesis is not supported by this data analysis. When obesity was added in the focal relationship between religious services attendance and self-rated health strengthened the focal relationship. In other words, the relationship between the frequency of religious attendance and self-rated health is strengthened when obesity is considered. Thus, obesity is not a mediating effect but a suppression effect. There is a suppression effect between religious services attendance and self-rated health when obesity is considered.
- The third hypothesis was to examine variation in this relationship by racial/ethnic group. As expected, the relationship varies by ethnic group (white, African American, and Hispanic). However, there are no effects on self-reported health by race/ethnicity, although there are religious attendance and BMI differences within each racial/ethnic group. In white individuals, attending religious services less frequently is more associated with better self-reported health than attending religious services more frequently. The frequency of religious service attendance of black and Hispanic individuals is not associated with self-rated health. For BMI, white individuals are more likely to have increased odds of reporting better health than black or Hispanic individuals. BMI in white individuals is associated with decreased odds of reporting better health compared to African American and Hispanic individuals. The more frequent the attendance at religious services, the better the health that white individuals report. Thus, the third hypothesis is supported by the results of this analysis.
- There are several limitations to this research. As mentioned earlier, the many missing cases for the frequency of religious attendance were re-categorized as never attending religious services. However, as it is not always true that missing cases never attend religious services, this should be considered as a coding matter for the survey data. Second, the exclusion of Asian and other racial groups (220 individuals) could affect the sample size even though 220 individuals only constitute 8.43% of the total of 2610 respondents. Finally, although the p value for the proportional odds model assumption is not violated for the ordinal logistic regression (p = 0.055), it is slightly greater than 0.05.
- In conclusion, although hypothesis 2 cannot be proved, hypotheses 1 and 3 are supported by the research findings. Although it was not demonstrated that the association between participation in religious services and self-rated health is mediated by obesity, the research shows the suppression effect of obesity on the association between participation in religious services and self-rated health. There are clear variations in racial/ethnic groups in this research. When each ethnic group is analyzed separately, BMI in white individuals is associated with decreased odds of reporting better health compared to African Americans and Hispanics. In addition, only the attendance of white participants at religious services is significant associated with better self-rated health.
- Although the association between participation in religious services and self-rated health is suppressed by obesity, this is possibly due to the sample size of white participants (n = 1109) compared to black participants (n = 469) and Hispanic participants (n = 473). Using other religious variables (i.e., importance of religion, religious guidance/religious authority, religious beliefs, and spiritual experiences) in the PS-ARE, future research could examine the association between religious service attendance, self-rated health, and obesity.
Discussion
-
Acknowledgements
- I am grateful to M. Kristen Peek and Soham Al Snih for their detailed and constructive comments. Please direct correspondence to Sanggon Nam, Department of Health Administration, Pfeiffer University. Parts of the results of this paper have been presented at the 52nd Annual National Student Research Forum, 2011, University of Texas Medical Branch, Galveston, TX, USA.
- 1. Levin JS. How religion influences morbidity and health: reflections on natural history, salutogenesis and host resistance. Soc Sci Med 1996;43:849−64. PMID: 8870149.ArticlePubMed
- 2. Levin JS, Vanderpool HY. Is religion therapeutically significant for hypertension? Soc Sci Med 1989;29:69−78. PMID: 2662423.ArticlePubMed
- 3. Krause N, Ingersoll-Dayton B, Liang J, Sugisawa H. Religion, social support, and health among the Japanese elderly. J Health Soc Behav 1999;12;40(4). 405−21. PMID: 10643163.ArticlePubMed
- 4. Strawbridge WJ, Shema SJ, Cohen RD, Kaplan GA. Religious attendance increases survival by improving and maintaining good health behaviors, mental health, and social relationships. Ann Behav Med 2001;23:68−74. PMID: 11302358.ArticlePubMed
- 5. Koenig HG, Larson DB, Larson SS. Religion and coping with serious medical illness. Ann Pharmacother 2001;35:352−9. PMID: 11261534.ArticlePubMed
- 6. Koenig HG, Cohen HJ, Blazer DG, et al. Religious coping and depression among elderly, hospitalized medically ill men. Am J Psychiatry 1992;149:1693−700. PMID: 1443246.ArticlePubMed
- 7. Pargament K, Ensing D, Falgout K, et al. God help me: (I.): religious coping efforts as predictors of the outcomes to significant negative life events. Am J Commun Psychol 1990;18:793−824.Article
- 8. Hyyppä MT, Mäki J. Individual-level relationships between social capital and self-rated health in a bilingual community. Prev Med 2001;2;32(2). 148−55. PMID: 11162340.ArticlePubMed
- 9. Levin JS. Religion and health. Afr Am Res Perspect 1994;1:15−21.
- 10. George LK, Ellison CG, Larson DB. Explaining the relationships between religious involvement and health. Psychol Inquiry 2002;13:190−200.Article
- 11. Levin JS, Vanderpool HY. Is religion therapeutically significant for hypertension? Soc Sci Med 1989;29(1). 69−78. PMID: 2662423.ArticlePubMed
- 12. Pargament KI. The Psychology of Religion and Coping: Theory, Research, Practice. New York: The Guilford Press; 1997.
- 13. Pargament K, Kennell J, Hathaway W, et al. Religion and the problem solving process: three styles of coping. JSTOR 1998;27:90−104.Article
- 14. Olphen J, Schulz A, Israel B, et al. Religious involvement, social support, and health among African-American women on the east side of Detroit. J Gen Intern Med 2003;8:549PMID: 12848838.Article
- 15. Oexmann MJ, Thomas JC, Taylor KB, et al. Short-term impact of a church-based approach to lifestyle change on cardiovascular risk in African-Americans. Ethn Dis 2000;10:17−23. PMID: 10764126.PubMed
- 16. Hummer RA, Rogers RG, Nam CB, Ellison CG. Religious involvement and U.S. adult mortality. Demography 1999;36:273−85. PMID: 10332617.ArticlePubMed
- 17. Hill TD, Angel JL, Ellison CG, Angel RJ. Religious attendance and mortality: an 8-year follow-up of older Mexican Americans. J Gerontol B Psychol Sci Soc Sci 2005;60:S102−9. PMID: 15746025.ArticlePubMed
- 18. Arredondo EM, Elder JP, Ayala GX, Campbell NR. Is church attendance associated with Latinas’ health practices and self-reported health? Am J Health Behav 2005;Nov-Dec;29(6). 502−11. PMID: 16336105.ArticlePubMed
- 19. Maselko J, Kubzansky LD. Gender differences in religious practices, spiritual experiences and health: results from the US General Social Survey. Soc Sci Med 2006;6;62(11). 2848−60. Epub 2005 Dec 15. PMID: 16359765.ArticlePubMed
- 20. McCullough ME, Laurenceau JP. Religiousness and the trajectory of self-rated health across adulthood. Pers Soc Psychol Bull 2005;4;31(4). 560−73. PMID: 15743989.ArticlePubMed
- 21. Veenstra G. Social capital, SES and health: an individual-level analysis. Soc Sci Med 2000;3;50(5). 619−29. PMID: 10658843.ArticlePubMed
- 22. Gottlieb NH, Green LW. Life events, social network, life-style, and health: an analysis of the 1979 National Survey of Personal Health Practices and Consequences. Health Educ Q 1984;11:91−105. PMID: 6511433.ArticlePubMed
- 23. Lapane KI, Lasater TM, Allan C, Carleton RA. Religion and cardiovascular disease risk. J Religion Health 1997;36:155−63.Article
- 24. Ferraro KF. Firm believers? Religion, body weight, and well-being. Rev Religious Res 1998;39:224−44.Article
- 25. Oman D, Reed D. Religion and mortality among the community-dwelling elderly. Am J Public Health 1998;88:1469−75. PMID: 9772846.ArticlePubMedPMC
- 26. Gillum R. Frequency of attendance at religious services, over-weight, and obesity in American women and men: the Third National Health and Nutrition Examination Survey. Ann Epidemiol 2006;16(9). 655−60. PMID: 16431132.ArticlePubMed
- 27. Reker GT. Logotheory and logotherapy: challenges, opportunities, and some empirical findings. Int Forum Logother 1994;17:47−55.
- 28. Reker GT, Peacock EJ, Wong PTP. Meaning and purpose in life and well-being: a life span perspective. J Gerontol 1987;42:44−9. PMID: 3794195.ArticlePubMed
- 29. Huppert EA, Whittington JE. Symptoms of psychological distress predict 7-year mortality. Psychol Med 1995;25:1073−86. PMID: 8588004.ArticlePubMed
- 30. Emerson MO, Sikkink D. Panel Study of American Religion and Ethnicity, 1st Wave. Retrieved from:http://www.ps-are.org/about/overview.asp. 2006.
- 31. Centers for Disease Control and Prevention. CDC Growth Charts. Atlanta: CDC; Retrieved from:http://www.cdc.gov/growthcharts. 2000. (Accessed 11.03.2011).
- 32. National Heart, Lung, and Blood Institute. Obesity Education Initiative: The Evidence Report. Bethesda, MD: National Institutes of Health; 1998.
References
|
OR (95% CI)
|
|||||
|---|---|---|---|---|---|
| Model 1 (n = 2329) | Model 2 (n = 2135) | Model 3 (n = 2135) | Model 4 (n = 2051) | Model 5 (n = 2051) | |
| Age | 0.97 (0.97–0.98)*** | 0.97 (0.97–0.98)*** | 0.97 (0.97–0.98)*** | 0.97 (0.97–0.98)*** | 0.97 (0.97–0.98)*** |
| Female | 0.99 (0.85–1.15) | 0.97 (0.83–1.14) | 0.95 (0.80–1.11) | 0.97 (0.82–1.14) | 0.93 (0.79–1.10) |
| Education | |||||
| Less than high school | 1.00 | 1.00 | 1.00 | 1.00 | 1.00 |
| High school | 1.75 (1.37–2.24)*** | 1.67 (1.30–2.16)*** | 1.63 (1.26–2.10)*** | 1.74 (1.34–2.25)*** | 1.67 (1.29–2.17)*** |
| BA | 2.30 (1.74–3.05)*** | 2.18 (1.63–2.92)*** | 2.12 (1.58–2.84)*** | 2.37 (1.76–3.20)*** | 2.27 (1.68–3.07)*** |
| Graduate or more | 3.34 (2.52–4.44)*** | 3.40 (2.52–4.59)*** | 3.26 (2.41–4.42)*** | 3.38 (2.48–4.59)*** | 3.18 (2.33–4.34)*** |
| Marital status | |||||
| Unmarried | 0.86 (0.72–1.02) | 0.83 (0.69–1.00)* | 0.83 (0.69–0.99)* | 0.84 (0.70–1.02) | 0.84 (0.70–1.01) |
| Married | 1.00 | 1.00 | 1.00 | 1.00 | 1.00 |
| Income | |||||
| USD19,999 or less | 1.00 | 1.00 | 1.00 | 1.00 | 1.00 |
| USD20,000–39,999 | 1.69 (1.36–2.09)*** | 1.68 (1.35–2.10)*** | 1.65 (1.32–2.07)*** | 1.73 (1.37–2.17)*** | 1.70 (1.35–2.13)*** |
| USD40,000–69,999 | 2.47 (1.95–3.12)*** | 2.38 (1.86–3.04)*** | 2.34 (1.84–2.99)*** | 2.48 (1.93–3.19)*** | 2.44 (1.90–3.13)*** |
| USD70,000 or more | 3.24 (2.51–4.19)*** | 3.49 (2.66–4.57)*** | 3.43 (2.62–4.50)*** | 3.53 (2.67–4.65)*** | 3.45 (2.61–4.55)*** |
| Number in household | 0.97 (0.92–1.02) | 0.99 (0.93–1.04) | 0.98 (0.93–1.04) | 1.00 (0.94–1.06) | 1.00 (0.94–1.06) |
| Race/ethnicity | |||||
| White | 1.00 | 1.00 | 1.00 | 1.00 | |
| Black | 0.94 (0.76–1.15) | 0.92 (0.75–1.12) | 1.06 (0.86–1.31) | 1.03 (0.84–1.28) | |
| Hispanic | 0.83 (0.68–1.03) | 0.84 (0.68–1.03) | 0.93 (0.75–1.14) | 0.94 (0.76–1.16) | |
| Religious attendance | |||||
| Never | 1.00 | 1.00 | |||
| 1–2 Times a year | 1.18 (0.96–1.47) | 1.30 (1.04–1.62)* | |||
| 1–3 Times a month | 1.24 (1.01–1.51)* | 1.28 (1.05–1.57)* | |||
| More than 1 time a week | 1.06 (0.76–1.46) | 1.15 (0.82–1.61) | |||
| BMI | |||||
| 18.49 or less | 1.59 (0.89–2.86) | 1.62 (0.90–2.92) | |||
| 18.5–24.9 | 2.95 (2.39–3.60)*** | 2.99 (2.43–3.67)*** | |||
| 25–30 | 2.17 (1.77–2.66)*** | 2.19 (1.79–2.68)*** | |||
| More than 30.1 | 1.00 | 1.00 | |||
|
OR (95% CI)
|
|||
|---|---|---|---|
| White (n = 1109) | Black (n = 469) | Hispanic (n = 473) | |
| Religious attendance | |||
| Never | 1.00 | 1.00 | 1.00 |
| 1–2 Times a year | 1.48 (1.09–2.00)* | 1.29 (0.82–2.03) | 0.91 (0.55–1.50) |
| 1–3 Times a month | 1.34 (1.02–1.78)* | 1.20 (0.79–1.83) | 1.19 (0.76–1.86) |
| More than 1 time a week | 1.16 (0.74–1.82) | 1.20 (0.59–2.44) | 1.13 (0.53–2.41) |
| BMI | |||
| Underweight | 1.44 (0.67–3.12) | 1.52 (0.34–6.78) | 2.08 (0.63–6.81) |
| Normal weight | 3.69 (2.77–4.92)*** | 2.21 (1.45–3.38)*** | 2.47 (1.61–3.79)*** |
| Overweight | 2.49 (1.86–3.33)*** | 1.94 (1.30–2.90)*** | 2.04 (1.35–3.09)*** |
| Obese | 1.00 | 1.00 | 1.00 |
Figure & Data
References
Citations
- Metabolically Healthy Obesity: Are Interventions Useful?
Bryan J. Mathis, Kiyoji Tanaka, Yuji Hiramatsu
Current Obesity Reports.2023; 12(1): 36. CrossRef - Racial/ethnic differences in the beneficial effect of social support on sleep duration
Dayna A. Johnson, Radhika Prakash-Asrani, Billye D. Lewis, Donald L. Bliwise, Tené T. Lewis
Journal of Clinical Sleep Medicine.2023; 19(7): 1231. CrossRef - The Effect of Hajj Trip on Mental Health: A Longitudinal Study
Mansooreh Fateh, Seyed Abbas Mousavi, Mohammad Bagher Sohrabi, Mohsen Arabi, Mohammad Hassan Emamian
Journal of Religion and Health.2020; 59(3): 1319. CrossRef - The Role of Religious Behavior in Health Self-Management: A Community-Based Participatory Research Study
Jane Pfeiffer, Hong Li, Maybelline Martez, Tim Gillespie
Religions.2018; 9(11): 357. CrossRef - Impact of religious attendance on psychosocial outcomes for individuals with traumatic brain injury: A NIDILRR funded TBI Model Systems study
Angela Philippus, David Mellick, Therese O’Neil-Pirozzi, Thomas Bergquist, Yelena Guller Bodien, Angelle M. Sander, Laura E. Dreer, Joseph Giacino, Thomas Novack
Brain Injury.2016; 30(13-14): 1605. CrossRef
 PubReader
 Cite
Cite
