
Articles
- Page Path
- HOME > Osong Public Health Res Perspect > Volume 8(5); 2017 > Article
-
Original Article
Regional Disparity and Factors Influencing Unmet Medical Needs: A Study Based on the Sixth Korea National Health and Nutrition Examination Survey (2015) - Ji Hye Lim
-
Osong Public Health and Research Perspectives 2017;8(5):295-301.
DOI: https://doi.org/10.24171/j.phrp.2017.8.5.02
Published online: October 31, 2017
Department of Healthcare Management, College of Health Science, Youngsan University, Yangsan, Korea
- Corresponding author: Ji Hye Lim, E-mail: limjiart@ysu.ac.kr
• Received: June 15, 2017 • Revised: August 22, 2017 • Accepted: September 5, 2017
Copyright ©2017, Korea Centers for Disease Control and Prevention
This is an open access article under the CC BY-NC-ND license (http://creativecommons.org/licenses/by-nc-nd/4.0/).
Abstract
-
Objectives
- This study aimed to determine regional differences and the factors that affect unmet medical needs.
-
Methods
- Data from the 6th Korea National Health and Nutrition Examination Survey (2015) were used, and 4,946 health survey participants who provided responses on medical utilization and health behavior were included in the study.
-
Results
- A statistically significant difference was observed in the incidence rate of unmet medical needs in terms of region. The independent variables that affected unmet medical needs were sex, age, education, region, household income, insurance type, smoking status, self-reported health status, and stress awareness. Gender (female), lower education level, rural residents, lowest household income, poor self-reported health status, and stress awareness increased the probability of unmet medical needs.
-
Conclusion
- Our findings suggested that different policies and approaches should be considered for each population that is at risk to address the primary cause of the unmet medical needs. Further studies that include medical expenses and the relevant variables of an area should be conducted in the future.
- According to the World Health Report 2000 by the World Health Organization, to improve health, access to health care should be based on needs rather than the ability to pay [1]. Improvement in economy, healthcare environment, and medical technology satisfies the desire for a healthier life. However, as health is a personal attribute and sometimes affected by social status, people do not have equal health care benefits. Since region affects the life of individuals, regional, social, and economic characteristics are sometimes associated with individual health [2]. It is an unmet medical need that the medical care necessity is not satisfied. In some cases, people needed medical services. However, these needs were not satisfied. These services included medical necessities as assessed by medical professionals [3]. An unmet medical need is sometimes used as an indicator of problems in accessing medical services [4]. Health disparities include differences between the most-advantaged groups in a given category, and not only between the best- and worst-off groups [5].
- More studies are using unmet medical needs, a subjective survey measure, to observe for inequity in healthcare [6]. Han et al. [7] reported that a lower income level is closely related to unmet medical needs. In addition, Kim et al. [8] reported that those residing outside capital areas had a higher likelihood of experiencing unmet medical needs. Craske et al. [9] conducted a study on perceived unmet needs among patients with panic disorder. However, these studies mainly analyzed specific age groups, groups, and diseases. Studies on unmet medical needs and regional disparity using the nationwide data are limited. Therefore, future studies on the factors that influence unmet medical need should be conducted, which has a significant effect on the accessibility and utilization of health care services.
- In this study, we analyzed the factors affecting unmet medical needs and the regional differences in unmet medical needs. Moreover, significant data were proposed for the establishment of healthcare policy for the health improvement of the public and for the equity of medical care.
INTRODUCTION
- In this study, we used data from the 6th Korea National Health and Nutrition Examination Survey (KNHANES) (2015) by the Korea Centers for Disease Control and Prevention. The National Health and Nutrition Survey based on the National Health Promotion Law conducted an in-depth investigation on health behavior, medical care utilization, and quality of life.
- Of the 7,380 participants who included responses on medical utilization and health behavior in the National Health and Nutrition Survey in 2015, 5,944 were adults aged over 19 years. Among these, we excluded participants who did not provide important information, including unmet medical needs. A total of 4,946 individuals were finally included in this study (Figure 1). We assessed the unmet medical needs based on the KNHANES question: “During the past year, was there ever a time when you wanted medical care but could not get it?” A “yes” response was used to define an experience of unmet medical need [10]. Since independent variables show general characteristics, the following variables were used: sex, age, education, type of insurance, residence, marital status, economic activity, household income, and private health insurance. Household income levels were divided into categories (1st quartile, 2nd quartile, 3rd quartile, and 4th quartile) based on the quartile of household equalization income. The types of insurance included national health insurance and medical care, and the residence variable was divided into urban and rural. Lifestyle- and health status-related variables included alcohol drinking, smoking, self-reported health status, stress awareness, cancer, and number of chronic diseases. The self-reported health status variable was divided into good, moderate, and poor. The number of chronic diseases was classified into 0, 1, 2, or more categories (24 chronic diseases) based on the number of participants who responded “exist.”
- The Institutional Review Board of the Korea Centers for Disease Control and Prevention (2015-01-02-6c) approved the use of the 6th KNHANES raw data.
- Data were analyzed using the IBM SPSS program version 21.0 (IBM Co., Armonk, NY, USA). Frequency analysis was conducted to examine the regional distribution of the unmet medical needs. To observe for the differences in unmet medical needs according to general characteristics, lifestyle, and health status characteristics, chi-squared analysis was conducted. Multiple logistic regression analysis was also carried out to examine the factors that affect unmet medical needs.
MATERIALS AND METHODS
- Table 1 shows the distribution of the rates of unmet medical needs across 16 regions in Korea. The rate of unmet medical needs in Chungbuk area was the highest (19.0%), followed by that of Jeju (18.7%), Ulsan (17.5%), Gyeongbuk (17.1%), and Jeonbuk (16.1%). A statistically significant difference was observed in terms of the experience rate of unmet medical needs by region (p < 0.05) (Table 1).
- Table 2 shows the rates of unmet medical needs based on the general characteristics of the variables. The rate of unmet medical needs was high among female individuals aged 30 to 39 years and those with low educational attainment (less than elementary education). Moreover, individuals who are bereaved and divorced also had a high rate of unmet medical needs. People who live in rural region and those without private insurance and with lower household income also experienced a high rate of unmet medical needs. Thus, a statistically significant difference was observed (p < 0.05) (Table 2).
- To examine the differences in unmet medical needs according to lifestyle and health status, a chi-square test was conducted. The rates of unmet medical needs according to smoking, self-reported health status, stress awareness, and number of chronic diseases were significantly different (p < 0.05). The rate of unmet medical needs of current smokers was 14.3%, which was significantly higher than that of former smokers (7.7%). The rate of unmet medical needs was the highest in participants who responded poorly to self-reported health status (24.9%). When the participants often feel stressed, the rate of unmet medical needs was significantly higher than that of those who rarely felt stressed. Based on the number of chronic diseases, those with more than 2 chronic diseases had the highest rate of unmet medical needs (15.3%) (Table 3).
- Table 4 shows the results of the multiple logistic regression analysis that was performed to examine the factors influencing unmet medical needs. Based on the results, independent variables, such as sex, age, education, region, household income, insurance type, smoking status, self-reported health status, and stress awareness, affected unmet medical needs. The rate of unmet medical needs in women was significantly higher (by 1.630 times) than that in men. In addition, the rate of unmet medical needs of individuals aged 60 years or older was significantly lower than that of individuals aged 19 to 29 years. With regard to education, the rate of unmet medical needs was 1,664 times higher in individuals who completed elementary school or less compared to that of individuals who completed college or higher education. The rate of the unmet medical needs of rural residents was significantly higher (by 1.329 times) than that of urban residents. Based on the lowest income level (1st quartile) compared with the highest income level (4th quartile), the rate of unmet medical needs was significantly higher by 1.548 times. The rate of unmet medical needs in individuals who had a poor self-reported health was significantly higher (by 3.179 times) than that of participants who responded good, and the rate of the unmet medical needs of former smoker was significantly lower than that of non-smokers. The rate of the unmet medical needs of those who were often stressed was significantly higher (by 1.843 times) than that of those who rarely felt stressed. The result of the likelihood ratio test was p < 0.05 (Table 4).
RESULTS
- This cross-sectional study aimed to assess the rate of regional unmet medical needs and understand the factors that affect the unmet medical care using the representative KNHANES data.
- An unmet medical need is not only a result of certain phenomenon and numerical results. However, it can also increase the mortality rate of elderly individuals [11]. In addition, it may increase the severity of the disease and the likelihood of complications because of untimely treatments [12].
- In the present study, a statistically significant difference was observed in individuals who experienced unmet medical care according to the area. Results showed that individuals who are in urban and rural areas had a higher rate of unmet medical experience than those who are living in metropolitan areas. Regional differences in unmet medical needs may cause disparities in regional health. Numerous studies have shown regional disparities in health according to social and economic characteristics and healthcare resources [13,14]. In addition, based on the regression analysis conducted in the present study, an unmet medical need was significantly associated with sex, age, education level, residential area, income level, type of insurance, smoking, self-reported health status, and stress awareness. Gender (female), lower education level, rural residents, lowest household income, poor self-reported health status, and often stress awareness increased the probability of unmet medical needs. This result is consistent with that of a previous study that analyzed factors that are related to unmet medical needs caused by financial burden [10]. Furthermore, Kim et al. [8] reported that lower education level is associated with higher odds of unmet medical needs. Han et al. [7] reported that the lowest-income population had a high odds ratio of unmet medical needs.
- Although the association between chronic diseases and unmet medical needs was not significant in this study, a previous study showed that the crude relative risk for dying was 1.79 in elderly individuals who had unmet medical needs among those who suffered from two or more chronic conditions [11]. As result, the strongest predictor of unmet medical needs was self-reported health status, a finding supported by prior studies [6,10].
- In Korea, since 1997, through the introduction of a health insurance system, we have implemented a medical insurance system covering the whole nation, and efforts have been made to improve the access to medical care. However, the results of the research suggested that barriers for accessing medical care were observed, depending on socio-economic characteristics and regions. Understanding whether or not medical needs were met from the patient’s point of view has significance as a criterion of the overall evaluation of the health care system. Therefore, the result of this study is useful for observing the actual condition that is related to the equity of medical utilization and accessibility.
- However, this study has several limitations. First, this study was cross sectional, making the investigation of the causal relationship between variables difficult. Second, we did not investigate the burden cost of diseases and the status of medical care utilization that is related to unmet medical needs. Third, the factors affecting unmet medical needs were not distinguished by region. Future studies that include medical expenses and relevant variables in an area should be conducted. Our finding suggested that different policies and approaches should be considered for each risk population to address the primary cause of unmet medical needs. In addition, these findings can be used as important data for health care policy and assessment.
DISCUSSION
-
Acknowledgements
- This work was supported by the Research Grant of Youngsan University in 2017.
ACKNOWLEDGMENTS
-
CONFLICTS OF INTEREST
No potential conflict of interest relevant to this article was reported.
Article information
- 1. Van der Stuyft P, Unger JP. Improving the performance of health systems: the World Health Report as go-between for scientific evidence and ideological discourse. Trop Med Int Health 2000;5:675−7. https://doi.org/10.1046/j.1365-3156.2000.00635.x. PMID: 10.1046/j.1365-3156.2000.00635.x. PMID: 11044260.ArticlePubMed
- 2. Diez Roux AV. Investigating neighborhood and area effects on health. Am J Public Health 2001;91:1783−9. PMID: 10.2105/AJPH.91.11.1783. PMID: 11684601.ArticlePubMedPMC
- 3. Donabedian A. Aspects of medical care administration: specifying requirements for health care. Cambridge, MA: Harvard University Press; 1973.
- 4. Newacheck PW, Stoddard JJ, Hughes DC, et al. Health insurance and access to primary care for children. N Engl J Med 1998;338:513−9. https://doi.org/10.1056/NEJM199802193380806. PMID: 10.1056/NEJM199802193380806. PMID: 9468469.ArticlePubMed
- 5. Braveman P. Health disparities and health equity: concepts and measurement. Annu Rev Public Health 2006;27:167−94. https://doi.org/10.1146/annurev.publhealth.27.021405.102103. PMID: 10.1146/annurev.publhealth.27.021405.102103. PMID: 16533114.ArticlePubMed
- 6. Ko H. Unmet healthcare needs and health status: Panel evidence from Korea. Health Policy 2016;120:646−53. https://doi.org/10.1016/j.healthpol.2016.04.005. PMID: 10.1016/j.healthpol.2016.04.005. PMID: 27095277.ArticlePubMed
- 7. Han KT, Park EC, Kim SJ. Unmet healthcare needs and community health center utilization among the low-income population based on a nationwide community health survey. Health Policy 2016;120:630−7. https://doi.org/10.1016/j.healthpol.2016.04.004. PMID: 10.1016/j.healthpol.2016.04.004. PMID: 27117134.ArticlePubMed
- 8. Kim J, Kim TH, Park EC, et al. Factors influencing unmet need for health care services in Korea. Asia Pac J Public Health 2015;27:NP2555−69. https://doi.org/10.1177/1010539513490789. PMID: 10.1177/1010539513490789. PMID: 23858512.ArticlePubMed
- 9. Craske MG, Edlund MJ, Sullivan G, et al. Perceived unmet need for mental health treatment and barriers to care among patients with panic disorder. Psychiatr Serv 2005;56:988−94. https://doi.org/10.1176/appi.ps.56.8.988. PMID: 10.1176/appi.ps.56.8.988. PMID: 16088017.ArticlePubMed
- 10. Lee SE, Yeon M, Kim CW, et al. The association among individual and contextual factors and unmet healthcare needs in South Korea: a multilevel study using national data. J Prev Med Public Health 2016;49:308−22. https://doi.org/10.3961/jpmph.16.035. PMID: 10.3961/jpmph.16.035. PMID: 27744672.ArticlePubMedPMC
- 11. Alonso J, Orfila F, Ruigómez A, et al. Unmet health care needs and mortality among Spanish elderly. Am J Public Health 1997;87:365−70. PMID: 10.2105/AJPH.87.3.365. PMID: 9096535.ArticlePubMedPMC
- 12. Diamant AL, Hays RD, Morales LS, et al. Delays and unmet need for health care among adult primary care patients in a restructured urban public health system. Am J Public Health 2004;94:783−9. https://doi.org/10.2105/AJPH.94.5.783. PMID: 10.2105/AJPH.94.5.783. PMID: 15117701.ArticlePubMedPMC
- 13. Filate WA, Johansen HL, Kennedy CC, et al. Regional variations in cardiovascular mortality in Canada. Can J Cardiol 2003;19:1241−8. PMID: 14571309.PubMed
- 14. Müller-Nordhorn J, Binting S, Roll S, et al. An update on regional variation in cardiovascular mortality within Europe. Eur Heart J 2008;29:1316−26. https://doi.org/10.1093/eurheartj/ehm604. PMID: 10.1093/eurheartj/ehm604. PMID: 18256043.ArticlePubMed
REFERENCES
Figure 1
Selection process of the study population.
KNHANES, Korea National Health and Nutrition Examination Survey.
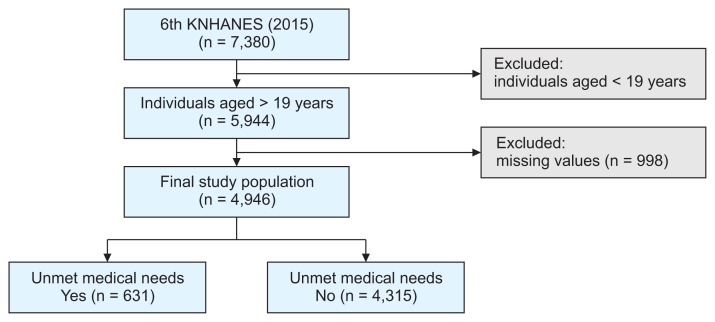
Table 1Regional distribution of unmet medical needs in Korea (n = 4,946)
Table 2Distribution of unmet medical needs according to general characteristics
Table 3Distribution of unmet medical needs according to lifestyle and health status
Table 4Factors influencing unmet medical needs among Korean adults (n = 4,946)
Figure & Data
References
Citations
Citations to this article as recorded by 
- Determinants of unhealthy living by gender, age group, and chronic health conditions across districts in South Korea using the 2010-2017 Community Health Surveys
Thi Tra Bui, Thi Huyen Trang Nguyen, Jinhee Lee, Sun Young Kim, Jin-Kyoung Oh
Epidemiology and Health.2024; : e2024014. CrossRef - Linking neighbourhood safety and children's internalizing and externalizing problems: Mediating role of maternal depression
Youngmin Cho
Child & Family Social Work.2023; 28(4): 1089. CrossRef - Not One for All
Hae-Wol Cho, Chaeshin Chu
Osong Public Health and Research Perspectives.2017; 8(5): 293. CrossRef
 PubReader
 Cite
Cite
