
Articles
- Page Path
- HOME > Osong Public Health Res Perspect > Volume 15(1); 2024 > Article
-
Review Article
Predictors of outcomes 3 to 12 months after traumatic brain injury: a systematic review and meta-analysis -
Younes Iderdar1
 , Maryem Arraji1, Nadia Al Wachami1, Morad Guennouni1,2, Karima Boumendil1, Yassmine Mourajid1, Noureddine Elkhoudri1, Elmadani Saad1, Mohamed Chahboune1
 -
Osong Public Health and Research Perspectives 2024;15(1):3-17.
DOI: https://doi.org/10.24171/j.phrp.2023.0288
Published online: February 5, 2024
1Hassan First University of Settat, Higher Institute of Health Sciences, Laboratory of Health Sciences and Technologies, Settat, Morocco
2Science and Technology Team, Higher School of Education and Training, Chouaîb Doukkali University of El Jadida, El Jadida, Morocco
- Corresponding author: Younes Iderdar Hassan First University of Settat, Higher Institute of Health Sciences, Laboratory of Health Sciences and Technologies, University Complex, Casablanca’s Road B.P 555, Settat 26000, Morocco E-mail: iderdarunes@gmail.com
© 2024 Korea Disease Control and Prevention Agency.
This is an open access article under the CC BY-NC-ND license (http://creativecommons.org/licenses/by-nc-nd/4.0/).
- 1,046 Views
- 72 Download
Abstract
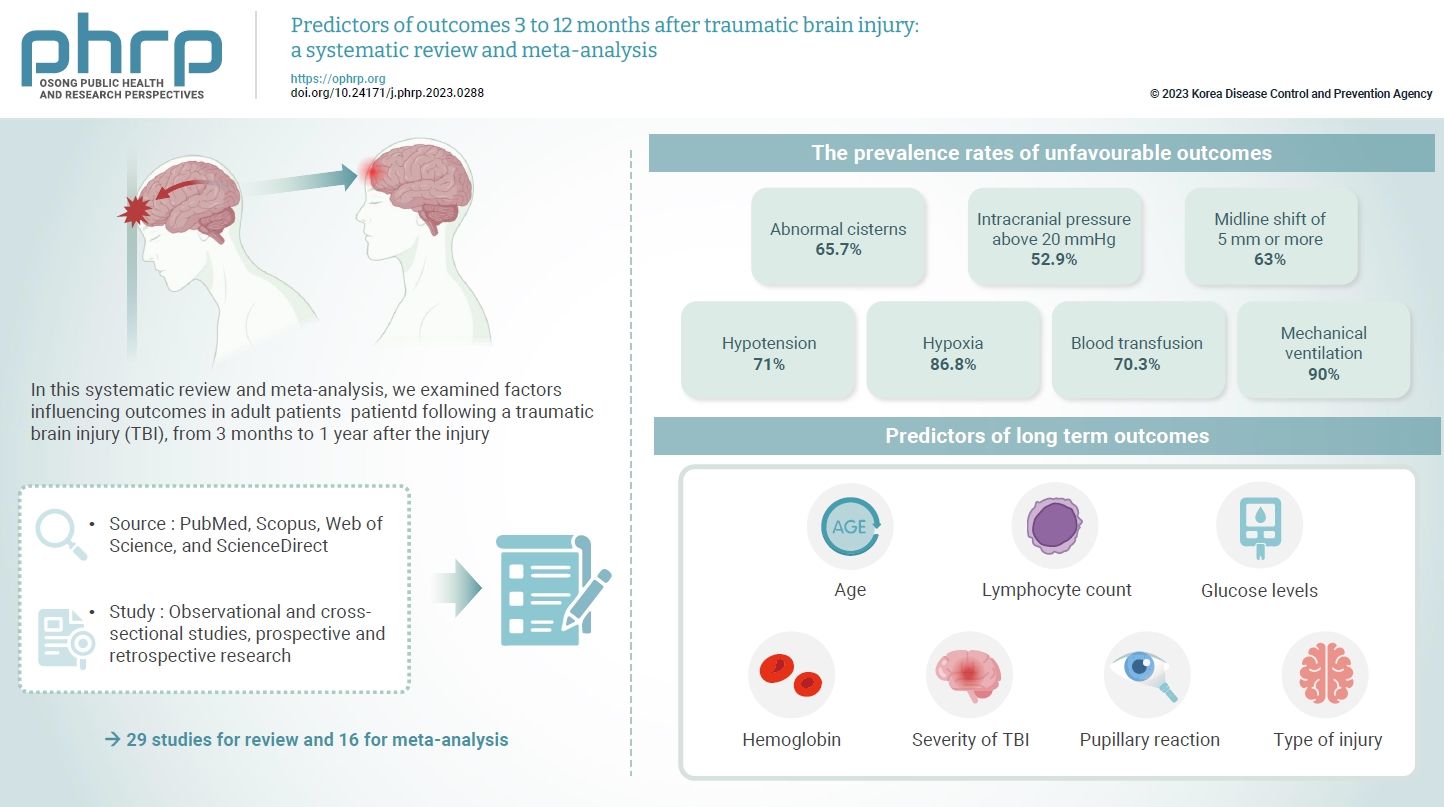
- The exact factors predicting outcomes following traumatic brain injury (TBI) remain elusive. In this systematic review and meta-analysis, we examined factors influencing outcomes in adult patients with TBI, from 3 months to 1 year after injury. A search of four electronic databases—PubMed, Scopus, Web of Science, and ScienceDirect—yielded 29 studies for review and 16 for meta-analysis, in accordance with the Preferred Reporting Items for Systematic Reviews and Meta-Analysis guidelines. In patients with TBI of any severity, mean differences were observed in age (8.72 years; 95% confidence interval [CI], 4.77–12.66 years), lymphocyte count (−0.15 × 10⁹/L; 95% CI, −0.18 to −0.11), glucose levels (1.20 mmol/L; 95% CI, 0.73–1.68), and hemoglobin levels (−0.91 g/dL; 95% CI, −1.49 to −0.33) between those with favourable and unfavorable outcomes. The prevalence rates of unfavorable outcomes were as follows: abnormal cisterns, 65.7%; intracranial pressure above 20 mmHg, 52.9%; midline shift of 5 mm or more, 63%; hypotension, 71%; hypoxia, 86.8%; blood transfusion, 70.3%; and mechanical ventilation, 90%. Several predictors were strongly associated with outcome. Specifically, age, lymphocyte count, glucose level, hemoglobin level, severity of TBI, pupillary reaction, and type of injury were identified as potential predictors of long-term outcomes.
- Traumatic brain injury (TBI) represents a major cause of global morbidity and mortality. This condition has a profound impact on affected individuals [1], with both direct and indirect social and economic repercussions stemming from the substantial costs associated with medical care and rehabilitation, in addition to functional impairments and loss of productivity [2]. Annually, an estimated 10 million individuals are impacted by TBI, with some cases necessitating hospitalization or resulting in death [3].
- TBI is often referred to as a “hidden epidemic” because the long-term disabilities it causes are largely invisible [4]. Individuals who experience severe brain injuries may face permanent impairments that affect their ability to learn, work, and care for their families [5]. These impairments can rob them of productive years and lead to prolonged periods of debilitation. Moreover, TBI imposes a substantial financial toll on individuals, their families, and society at large. With increased prevention efforts, many lives could be spared, and the burden of disability could be substantially reduced [6]. Indicators such as unresponsive pupils, cerebral mass lesions, and the need for neurosurgical interventions have been associated with higher mortality rates and worse functional outcomes at the time of hospital discharge among patients who present to the emergency department [7]. This article details the factors and outcomes associated with such injuries.
- Depending on their functional outcomes after TBI, individuals may regain essential skills and return to everyday activities. Assessing the probability of adverse functional outcomes following TBI is critical, as it provides patients, families, and healthcare providers with valuable prognostic insights that can guide decisions regarding the suitability of therapeutic interventions. Accurate outcome prediction can shape prognosis, influence treatment choices, and impact policy [8].
- Most studies have identified age as the primary predictor of outcomes following head injury, although age appears to be a stronger indicator of mortality and survival than of functional outcomes [9]. Unlike findings from animal research, the majority of human studies have not supported sex as a predictor of outcomes [9,10]. In contrast, the importance of the Glasgow coma scale (GCS) and pupillary response as prognostic factors cannot be overstated, as these have been consistently identified as significant predictors in the literature. Indeed, 100% of studies evaluating pupillary response and 94% of those assessing GCS have reported these measures to be statistically significant in outcome prediction [9].
- Outcomes following TBI have been extensively studied, but the results have been inconsistent. Some research has been focused on the immediate and short-term effects of TBI, examining the acute phase of the injury, outcomes of hospitalization, and early rehabilitation progress. However, the present study sought to clarify the long-term outcomes, which have received less attention in the current body of research. To identify the most reliable predictors of TBI outcomes, a systematic review and meta-analysis are necessary. These methods can provide a comprehensive and critical assessment of the factors that influence recovery from TBI. Understanding these factors will improve our knowledge of the prognosis for TBI and aid in the development of customized interventions to improve outcomes.
- The selection of a 3- to 12-month timeframe for the study was informed by the characteristics of TBIs and the research objectives. TBIs can lead to a diverse spectrum of outcomes that vary according to injury severity and the response of the patient to treatment and rehabilitation. The chosen period enabled the evaluation of extended recovery patterns. The 3-month minimum delay ensured that the study concentrated on individuals who had moved beyond the acute phase and were comparatively likely to have attained a plateau in their recuperation.
- This review was conducted to identify significant factors influencing the outcomes of TBI and to ascertain which variables can predict patient outcomes within 3 to 12 months following TBI. By synthesizing data from numerous studies and identifying the most reliable predictors of TBI outcomes, this systematic review augments the existing body of knowledge on TBI prognosis and may improve patient care during the crucial recovery period of 3 to 12 months. Additionally, the review underscores the methodological weaknesses and constraints of the studies examined and suggests directions for future research.
Introduction
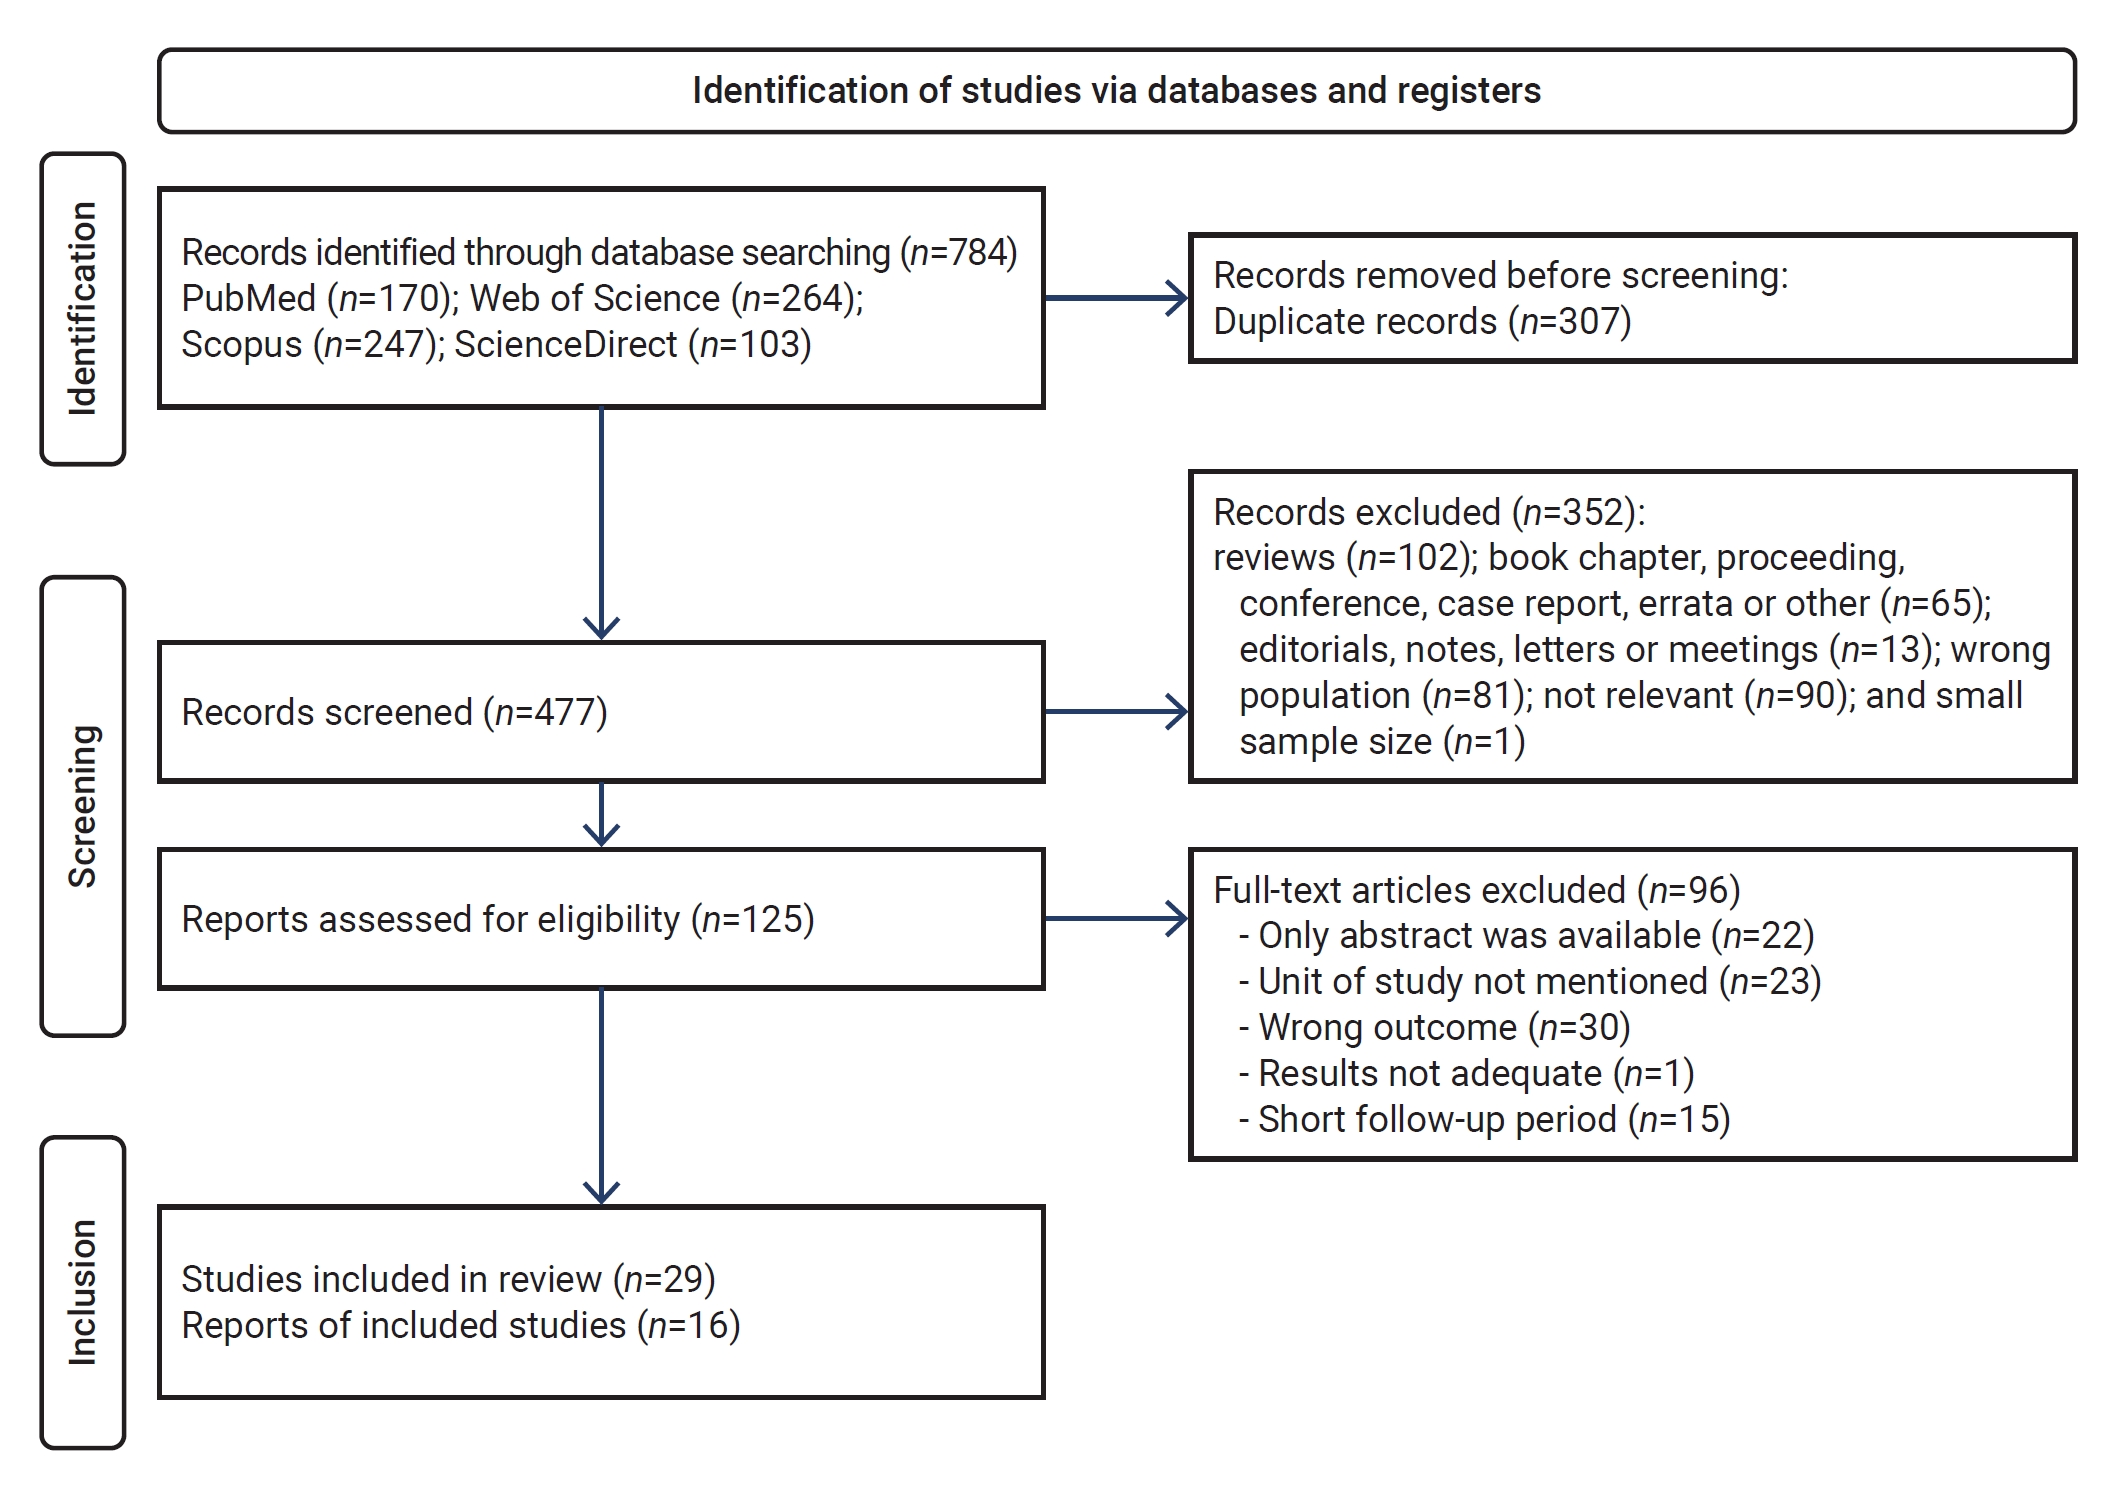
- This systematic review and meta-analysis was conducted on August 18, 2021, utilizing the methodology outlined in “A Systematic Review to Support Evidence-Based Medicine” [10]. The protocol was prospectively registered with the ResearchRegistry (Review Registry UIN: reviewregistry1500). In addition, we adhered to the Preferred Reporting Items for Systematic Reviews and Meta-Analyses (PRISMA) guidelines for the execution and documentation of meta-analyses [11]. The PRISMA statement includes a 27-item checklist and a 4-phase flow diagram that includes identification, screening, eligibility, and inclusion. A critical component of this methodology is the development of a screening protocol with robust eligibility criteria to identify the most relevant studies pertaining to the research topic [12]. The research question for this study was designed to address the following primary concerns, based on population, exposure, and outcome: “Which studies have examined factors that predict outcomes 3 months after a traumatic brain injury?” and “What are these factors, and how significant are they in predicting outcomes?”
- Eligibility Criteria
- Studies of sufficient quality were concentrated on identifying predictors of outcomes in patients with TBI. These included observational and cross-sectional studies, as well as both prospective and retrospective research. Excluded from the analysis were conference presentations, case reports, interventions, and proceedings. Articles that failed to satisfy the inclusion criteria (Table 1) were also omitted. Studies were selected for inclusion if their titles contained the strategic keywords and if the title, abstract, and keywords were free of terms like “dark ages,” “mice,” “rat,” or “ancient”. The rationale for excluding these terms was to filter out studies that were not relevant to the current state of knowledge on TBIs. For example, studies that used historical data or animal models, or that focused on ancient treatments or practices. These terms were chosen based on a preliminary search of the literature, which revealed that they were often associated with such studies.
- Information Sources
- To comprehensively identify publications reporting on outcome predictors in patients with TBI, data were systematically gathered from major databases including PubMed, Scopus, Web of Science, and ScienceDirect. This effort was conducted in collaboration with search specialists and researchers within the field of TBI.
- Search Strategy
- The search process included only observational studies, excluding other article types. A total of 103 studies were identified via Science Direct, 247 through Scopus, 264 from Web of Science, and 170 through PubMed. This was achieved by searching study titles for the following keywords to ensure relevance to the research strategy: head trauma, head injury, brain trauma, TBI, traumatic head injury, predictors, predicting outcome, predict outcome, predictive factors, prediction factors, outcome prediction, survival prediction, and outcome predictors. Given the extensive number of studies, this title-based keyword search was necessary to meet the eligibility criteria of the research. The search was conducted from January 2017 to August 2021.
- Selection Process and Data Collection
- In the initial phase of article selection, 2 reviewers (Y.I. and M.C.) excluded articles with irrelevant titles or abstracts. Subsequently, the second phase involved a detailed review of the full texts of the articles to determine their eligibility based on the inclusion criteria. The organization and evaluation of titles and abstracts, as well as the identification of duplicate articles, were facilitated using Mendeley reference management software. Any disagreements that arose during each phase were settled through consensus with a third reviewer (E.S.). The full texts were independently assessed by 2 authors (K.B. and N.A.W.), who selected articles for inclusion based on mutual agreement that they satisfied the study criteria. Data extraction from the selected articles was performed by 2 reviewers (Y.I. and M.C.) using a standardized data collection form. For each study, details such as study characteristics, sample size, severity of TBI, and the scoring system used to measure outcomes were documented. Additionally, a meta-analysis was conducted of studies that investigated both favorable and unfavorable outcomes at 3 to 12 months following TBI.
- Assessment of Study Risk of Bias
- Two reviewers, N.E. and Y.M., assessed the quality of the articles using the Newcastle-Ottawa scale (NOS) [13]. The NOS awards a maximum of 9 points to studies with the lowest risk of bias across 3 domains: (1) the selection of study groups (which can earn up to 4 points); (2) the comparability of groups (worth up to 2 points); and (3) the ascertainment of exposure and outcomes (worth up to 3 points) [13], and this can be seen in Figure S1. Survey questions were formulated based on the NOS criteria, encompassing all 3 domains and enabling authors to provide details about their studies [14].
- Synthesis Methods
- A meta-analysis was conducted to estimate the differences between favorable and unfavorable outcomes in terms of predictive factors, utilizing rBiostatistics.com (Cloud Graphical User Interface for R Statistics and eLearning Platform, https://www.rbiostatistics.com, 2017) for the analysis of mean differences [15]. Both random and fixed-effects models were employed in the meta-analysis. Forest plots, illustrating outcomes after TBI along with 95% confidence intervals (CIs), were generated based on these models. Additionally, a meta-analysis of proportions was carried out using the Freeman-Tukey transformation [16] to compute the weighted summary proportion under both fixed and random effects models [17]. To investigate publication bias, statistical analysis was performed using Egger tests [18], which are methods employed in meta-analysis to detect the presence of publication bias.
- Heterogeneity was assessed with the I-square (I2) method [19,20]. I2 represents the percentage of variability in results between studies due to heterogeneity rather than sampling error [21]. The magnitude of I2 signifies the degree of heterogeneity: an I2 value ranging from 50% to 75% suggests moderate heterogeneity, while an I2 value exceeding 75% denotes high heterogeneity. Conversely, an I2 value below 50% suggests homogeneity among the study results. Forest plots were employed to visually depict the extent of heterogeneity.
- For 1-way analysis of variance (ANOVA), we utilized IBM SPSS ver. 25.0 (IBM Corp.) to determine whether any associations or differences existed between groups regarding the mean proportions of unfavorable outcomes. The Levene test [22] was employed to evaluate the homogeneity of variance among the studies. The purpose of this test was to ascertain whether the variances in the mean proportion of unfavorable outcomes differed significantly across the levels of TBI severity. According to the null hypothesis of the Levene test, the variances were equivalent across all studies. If the p-value obtained from the Levene test exceeded 0.05, this would suggest that variance was homogenous across the studies.
- The least significant difference (LSD) test, also referred to as the Fisher LSD test, functioned as a post hoc analysis employed following ANOVA to ascertain which group means exhibited significant differences [23]. Upon achieving a significant outcome in ANOVA, the LSD test facilitated the pairwise comparison of mean values across TBI severity groups to identify those that differed significantly from each another.
Materials and Methods
- Study Selection
- Figure 1 presents a modified PRISMA diagram, outlining the research process for study identification, selection, eligibility determination, and inclusion. This selection process yielded 784 articles, of which 307 were excluded due to duplication. The application of inclusion and exclusion criteria during the eligibility assessment of titles and abstracts narrowed the field to 127 papers. Subsequent full-text article reviews permitted the inclusion of 58 articles in the review, following the exclusion of an additional 69 articles.
- Study Characteristics
- Table 2 summarizes the characteristics of the included studies. Within the meta-analysis, 10 studies focused on the outcomes of individuals with severe TBI [24–33], 1 study addressed outcomes in those with mild TBI [34], 7 studies considered participants with moderate to severe TBI [35–41], and 11 studies encompassed all levels of TBI severity [42–52], assessing outcomes (including mortality) as either favorable or unfavorable. A variety of scales were employed to measure outcomes, such as the Glasgow outcome scale in 19 studies, the Glasgow outcome scale-extended in 9 studies, the quality of life after traumatic brain injury-overall scale in 1 study, the disability rating scale in 1 study, absolute functional gain in 1 study, the functional independence measure in 1 study, and the Rancho Los Amigos scale in 1 study, among others. Additional characteristics are detailed in Figure 1.
- Risk of Bias in Studies
- In nearly all cases, evaluating publication bias was not feasible due to the meta-analysis for each factor incorporating fewer than 8 studies. However, an assessment of publication bias was conducted specifically regarding sex. The findings from the Egger test, which yielded a p-value of 0.775, suggest an absence of publication bias.
- Results of Syntheses
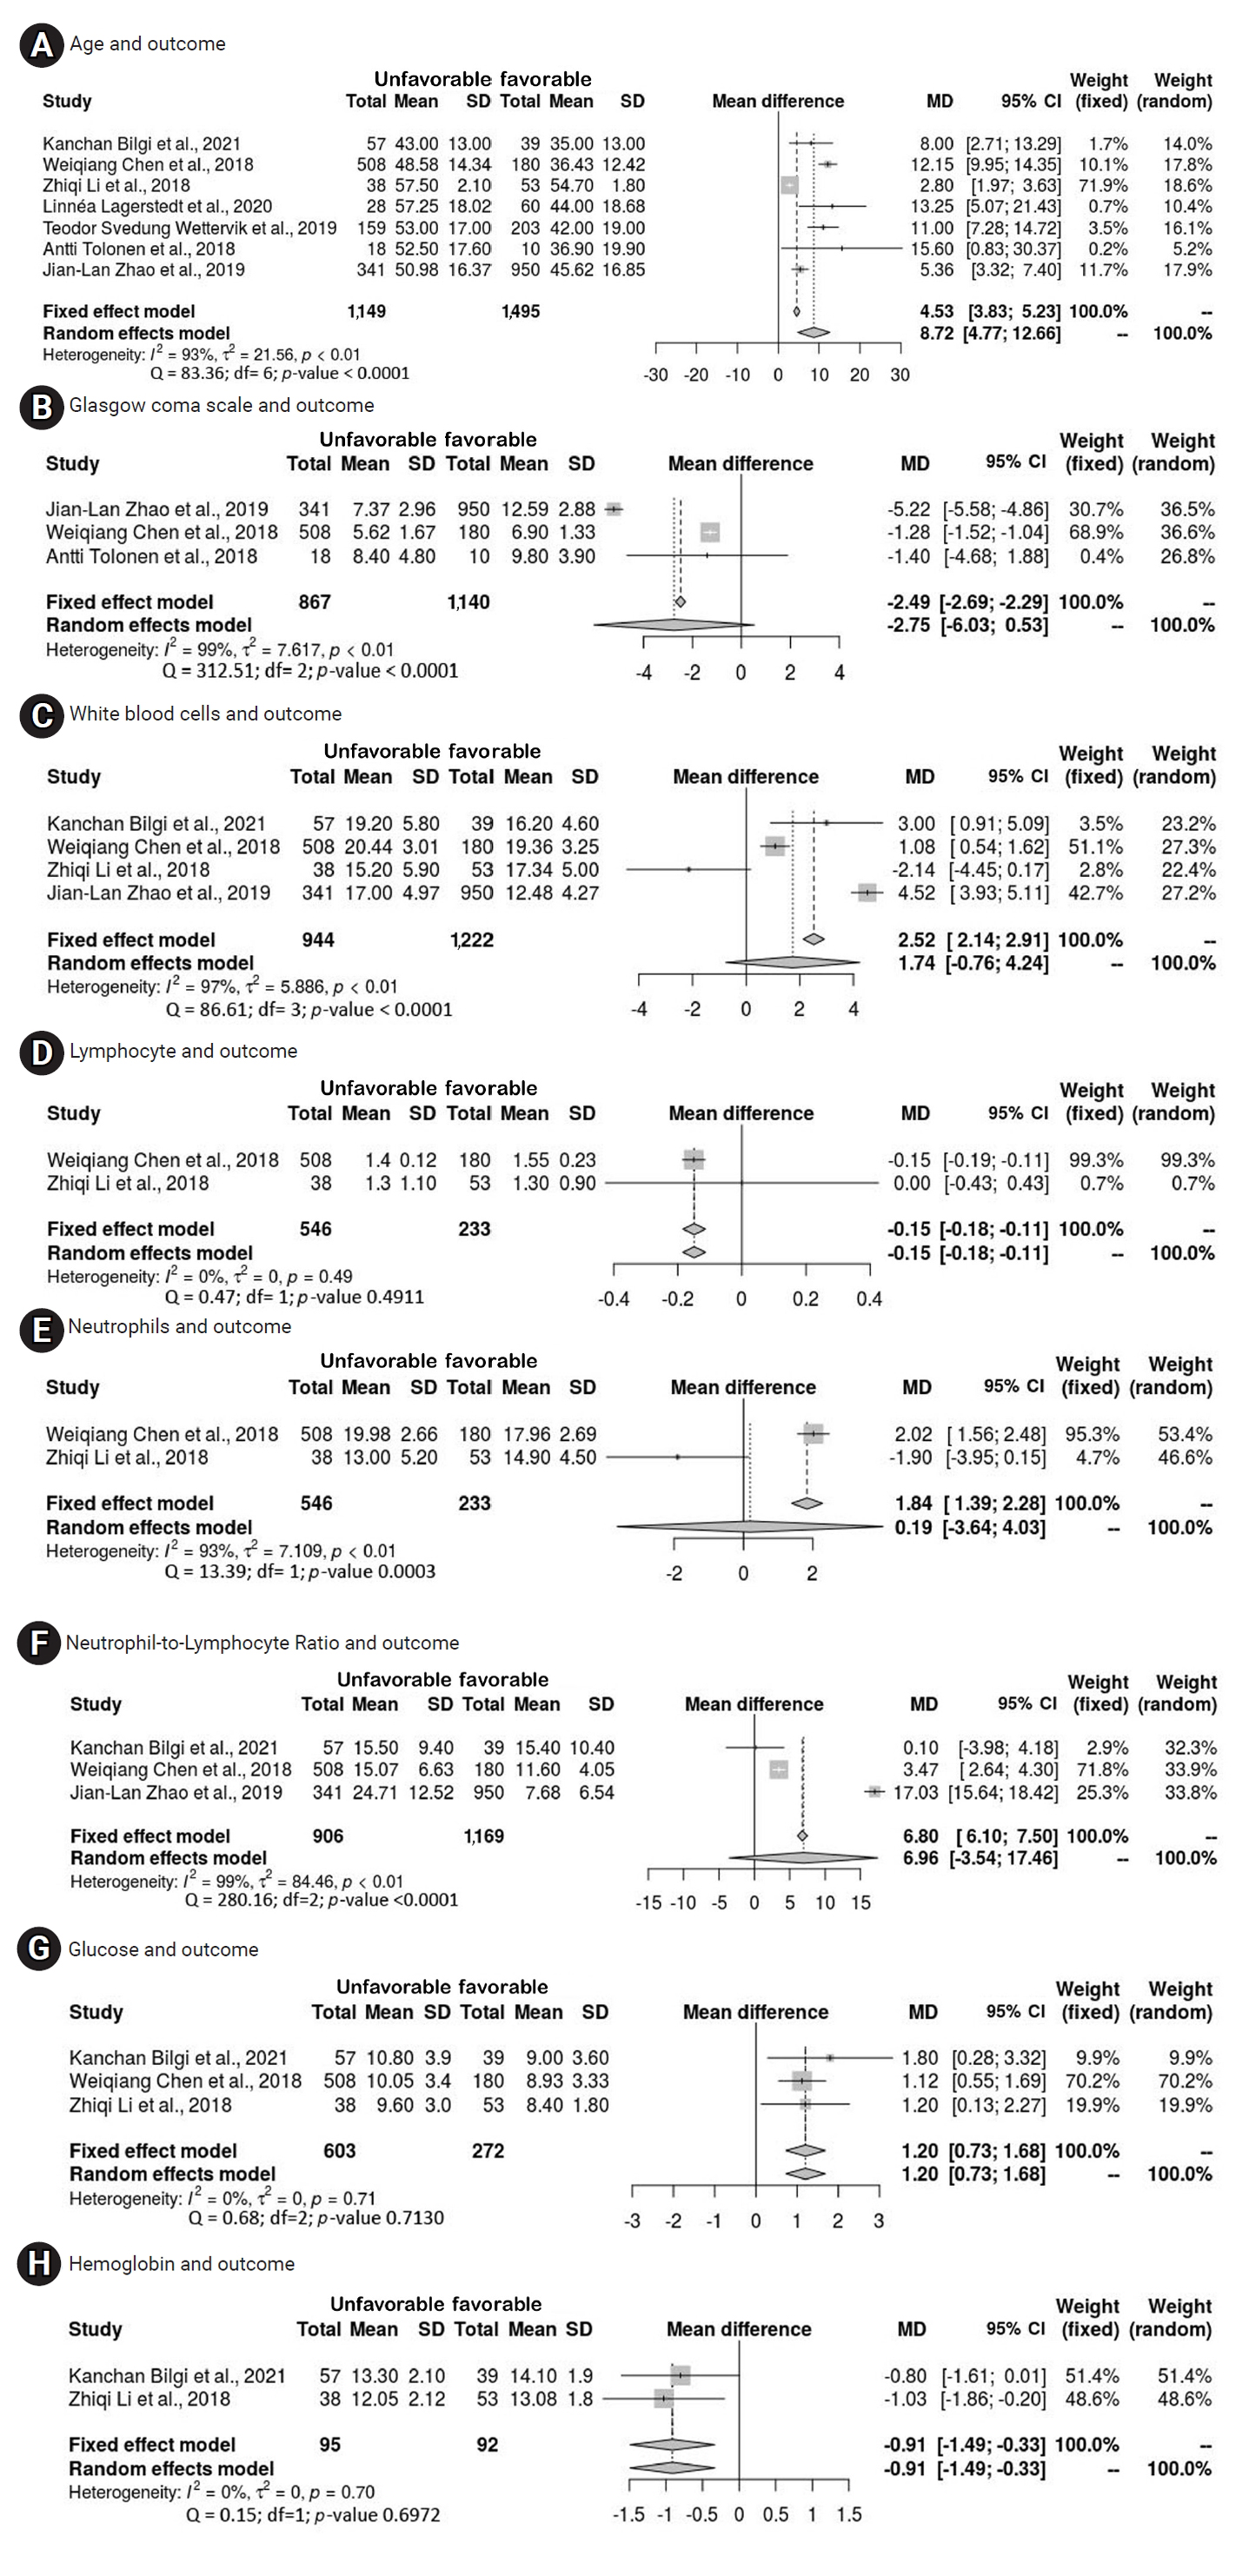
- The present study incorporated various factors, with an independent meta-analysis conducted for factors that were investigated in multiple studies. Forest plots for outcome predictors, as shown in Figure 2, revealed a significant mean difference in age of 8.72 years (95% CI, 4.77–12.66 years) between those with favorable and unfavorable outcomes. Additionally, the plots indicated significant mean differences for lymphocyte count (−0.15 × 10⁹/L; 95% CI, −0.18 to −0.11), glucose levels (1.20 mmol/L; 95% CI, 0.73–1.68), and hemoglobin levels (−0.91 g/dL; 95% CI, −1.49 to −0.33). White blood cells (WBCs), however, did not exhibit a significant mean difference, with a pooled result of 1.74 × 10⁹/L (95% CI, −0.76 to 4.24) across 4 studies. Neutrophils, analyzed in 2 articles, also showed no significant mean difference, with a result of 0.19 × 10⁹/L (95% CI, −3.64 to 4.03). The neutrophil-to-lymphocyte ratio (NLR) similarly did not demonstrate a significant mean difference, with a pooled result of 6.96 (95% CI, −3.54–17.46) based on 3 studies. Despite its frequent mention in the literature, GCS did not achieve a significant mean difference, with a result of −2.75 (95% CI, −6.03 to 0.53). The studies included in the present meta-analysis exhibited considerable heterogeneity. Furthermore, while age exhibited a significant mean difference, it also displayed substantial interstudy heterogeneity. This is most evident in the forest plots for each variable, presented in Figure 2.
- Another comparison was conducted through a meta-analysis of proportions to investigate all factors predicting an unfavorable outcome. The prevalence rates of such outcomes among patients with abnormal cisterns, intracranial pressure (ICP) exceeding 20 mmHg, a midline shift of 5 mm or greater, hypotension, hypoxia, the requirement for blood transfusion, and the need for mechanical ventilation were 65.7%, 52.9%, 63%, 71%, 86.8%, 70.3%, and 90%, respectively.
- As shown in Table 3, analysis of the patients with unfavorable outcomes revealed no significant differences in sex, injury severity score (ISS), motor score, Marshall score, type of surgery, or injury mechanism relative to those with favorable results [25,27,28,30,31,33,35,37,38,40−42,44-46,49,50]. However, significant differences were noted in several areas. Regarding GCS score, a distinction was evident between GCS 13–15, with a prevalence of unfavorable outcomes of 6.9% (95% CI, 2.535%–13.161%), and GCS 3–8, with a proportion of 58.6% (95% CI, 32.838%–82.035%). Pupillary reactions also differed significantly, with 31.8% (95% CI, 18.228%–47.153%) of patients with both pupils reactive demonstrating poor outcomes compared to 71.6% (95% CI, 53.901%–86.469%) among those with no pupillary reaction and 59.5% (95% CI, 51.214%–67.428%) of those with only 1 reactive pupil. Additionally, the type of injury was a significant factor, with 76.6% of those with intraventricular hemorrhage (IVH) experiencing poor outcomes (95% CI, 59.685%–89.971%) compared to 35.9% (95% CI, 19.776%–53.833%) of patients with intracerebral hematoma. When comparing epidural hematoma (24.9%; 95% CI, 18.079%–32.446%) and subdural hematoma (44.0%; 95% CI, 37.108%–51.097%) to IVH, significant differences were again observed (Table 3).
- We explored the association between the severity of TBI and the rate of unfavorable outcomes from 3 months to 1 year after injury across all included studies. First, we confirmed the homogeneity of variances using the Levene test, which yielded a significance value of 0.628. Subsequently, we observed variations in the mean proportions of unfavorable outcomes across 3 categories of TBI severity: TBI of any severity, moderate to severe TBI, and severe TBI. To determine whether these differences were statistically significant, we employed 1-way ANOVA. The results revealed a significant disparity (p=0.032) only between patients with TBI of any severity and those with severe TBI, as determined by the post hoc LSD test.
Results
- Across the included studies, a significant association was found between the proportion of unfavorable outcomes and the GCS severity when investigating the link between poor outcomes and TBI severity. The studies that included individuals with severe TBI reported a significant proportion of patients experiencing unfavorable outcomes, aligning with findings from prior research. Patients with mild GCS scores exhibited the greatest frequency of favorable outcomes, whereas those with severe GCS scores experienced the highest mortality rates and the lowest rates of favorable outcomes [53].
- The pooled results of this study indicate a disparity between the favorable and unfavorable groups, specifically suggesting that older patients with TBI are particularly likely to experience unfavorable outcomes. Age has been identified as a predictor of both mortality and unfavorable outcomes in several studies [29,33,35]. Separate research has substantiated the significant age difference between those with favorable and unfavorable outcomes [38,40], with age showing a significant correlation with outcomes at 6 months [40]. However, one study reported that the difference between individuals aged 21 to 40 years and those aged 41 to 60 years was not statistically significant [44]. In contrast, another investigation determined that age (odds ratio, 0.96; 95% CI, 0.93–0.98; p=0.005) independently predicted a positive functional outcome [41]. Overall, a substantial body of additional research [28,39,46,47,50] has indicated that age is a significant predictor of outcome.
- Regarding the proportion of patients with unfavorable outcomes, no significant differences were observed in relation to ISS, sex, or mechanism of injury. ISS did not show a significant correlation with patient outcomes [42]. Similarly, sex did not exhibit any noticeable differences. While the frequency of injury severity did not significantly correlate with sex, a significant difference was evident in the occurrence of TBI between sexes [35]. No noticeable differences were found between favorable and unfavorable patient outcomes when considering sex [40]. The most common cause of injury was motor vehicle collision, and injuries most frequently occurred in public areas [35]. The mechanism of injury did not significantly relate to the proportion of patients with unfavorable outcomes. Although 71% of patients with hypotension experienced poor outcomes in our combined results, hypotension was not significantly associated with overall outcomes [33].
- Between the groups with favorable and unfavorable results, significant differences were observed in median GCS score, GCS motor score, and pupillary reactivity [38,40]. GCS score upon admission, motor score, and pupillary reactivity have been identified as independent predictors of outcomes [46,47,50] or simply found to be associated with outcomes [40,44]. Poor outcomes have been shown to be associated with low GCS scores at admission and low GCS motor scores [33,44]. In the present meta-analysis of proportions, a significant difference was found in the proportion of patients with unfavorable outcomes between those with both pupils reacting and those with 1 or no pupils reacting.
- Within the subset of patients experiencing ICP exceeding 20 mmHg, 52.9% encountered unfavorable outcomes. A strong correlation was observed between elevated ICP and both hospital mortality and long-term outcomes [33]. ICP was identified as a strong predictor of outcomes at 6 months following TBI [25]. Specifically, an average ICP above 21.3 mmHg throughout the monitoring period was associated with poor outcomes in certain patients [29]. Patients with poor outcomes exhibited significantly higher mean values of pressure reactivity index (PRx) and 20-minute-long pressure reactivity index (20-LPRx). While both PRx and 20-LPRx demonstrated statistical significance in predicting unfavorable outcomes through univariate regression analysis, only PRx maintained this significance in multivariate analysis [52]. Additionally, a mean PRx between 55 and 15, as well as a cerebral perfusion pressure (CPP) exceeding the optimal CPP threshold, were identified as significant independent predictors of outcomes [46]. The most critical prognostic indicators included GCS score, serum glucose levels, and the duration of the longest event of cerebrovascular autoregulation impairment, specifically when PRx exceeded 0.5 within 24 hours after admission [29].
- The meta-analysis indicated that patients with poor outcomes exhibited significantly lower hemoglobin levels and lymphocyte ratios relative to those with favorable outcomes. Patients with favorable outcomes after TBI had significantly higher hemoglobin levels than those with poor results [49]. Furthermore, individuals with unfavorable outcomes presented with much lower lymphocyte ratios than their counterparts with favorable outcomes, although this finding was not specifically associated with outcomes at 6 months [50]. Significant differences were observed in blood transfusions, mean international normalized ratio (INR), and mean hemoglobin levels between the groups with favorable and unfavorable outcomes [38]. Patients with TBI who experienced poor outcomes also had markedly higher glucose levels. A significant difference was noted in the median mean glucose levels between the 2 outcome groups [38], with significantly lower levels in patients who had favorable outcomes [49]. Glucose levels were found to be substantially correlated with outcomes among the established International Mission for Prognosis and Clinical Trial predictors [47].
- In the meta-analysis, no significant differences were observed in WBC counts, NLR, or neutrophil counts between the 2 outcome groups. Specifically, WBC counts were similar across both groups [49]. This finding contrasts with other research, where patients with poor outcomes exhibited significantly elevated WBC counts compared to those with favorable outcomes [50]. Similarly, although the results indicated no difference in neutrophil counts between groups [49], other studies have identified a significantly higher neutrophil ratio in patients with poor outcomes relative to those with favorable results [50]. The apparent discrepancies may be attributed to the substantial heterogeneity present within this meta-analysis.
- Contrary to previous findings, subsequent research has shown that NLR at the time of admission remained a significant predictor of an unfavorable outcome 1 year later [28]. Furthermore, NLR was identified as an independent predictive factor for the 6-month prognosis of patients with TBI [50]. Although neutrophils, WBC count, and NLR did not demonstrate strong correlations with 6-month prognosis, patients with poor outcomes exhibited significantly higher NLRs compared to those with favorable outcomes [50]. We also found that the total leukocyte count (TLC) served as a predictor of both mortality and poor neurological outcomes at 6 months [38], with the mean TLC values differing substantially between the 2 groups [38]. Monocyte count at admission was linked to 6-month prognosis in patients with moderate to severe TBI, with higher monocyte counts observed in patients who experienced favorable outcomes [49]. Additionally, coagulopathy and caspase 3 were identified as highly significant predictors of outcomes 6 months after TBI [25,50].
- Throughout this review, several methodological issues emerged that require attention. The diversity of predictor variables used in the research was particularly noteworthy. The initial aim of this study was to evaluate all known predictor variables for outcomes between 3 and 12 months; however, the existing research encompasses many predictors. For example, of the 29 studies included in the current analysis, 81 different predictor variables were identified. Another point of concern is the variation in methodological rigor. Building on insights from prior studies, the assessment of potential research for inclusion in this review revealed that the literature is characterized by numerous studies with small sample sizes, findings of statistical significance that lack clinical importance, and models derived from limited datasets. Furthermore, we noted frequent omissions in the reporting of sociodemographic information regarding study samples. This omission poses a serious challenge for researchers and clinicians who wish to generalize the findings to other populations.
- A second issue was the variability in methodological quality. The existing literature is characterized by a multitude of analyses with small sample sizes, instances where statistical significance may have little clinical relevance, and models developed from small sample sizes, based on findings from previous research. Moreover, studies often did not report the sociodemographic characteristics of their samples. This omission similarly complicates the generalizability of the study’s findings. Additionally, our review was limited by our method of retrieving reports, which relied on searching titles for keywords. We also found considerable heterogeneity among the studies included in the meta-analysis, which was most notably reflected in the varying degrees of TBI severity and the samples used in each study.
- This study adhered to the PRISMA guidelines for the conduct and reporting of meta-analyses [11], and this can be seen in Supplementary Material 1 and 2 [11]. It was focused on identifying research published from January 2017 to August 2021 that examined factors predicting outcomes 3 months following TBI. Studies that met the eligibility criteria and demonstrated sufficient quality were selected, and their quality was evaluated using the NOS [13].
- A meta-analysis of mean differences was utilized to estimate the disparity between favorable and unfavorable outcomes, as well as to produce forest plots employing both random-effects and fixed-effects models. Subsequently, a second meta-analysis was conducted, focusing on proportions. This analysis employed the Freeman-Tukey transformation [16] to compute the weighted summary proportion in both fixed and random effects models [17]. The potential for publication bias was statistically explored through the application of Egger tests [18], while heterogeneity was quantified using the I2 method [19].
- After confirming the homogeneity of variance across various studies with the Levene test [22], 1-way ANOVA was conducted to investigate any association between groups regarding the mean proportion of unfavorable outcomes. Subsequently, the LSD test was utilized to ascertain which group means differed significantly from each another [23].
- Previous reviews have examined outcomes following TBI, with some focusing on long-term and others on short-term effects. Various aspects of recovery have been investigated, including functional outcomes—categorized as either favorable or unfavorable, and fatal or non-fatal—as well as return to work and social participation. These reviews identified factors such as NLR [54], level of education, age, mechanism of injury, psychiatric history [55,56], and injury severity [57] as good predictors of outcomes after TBI. In contrast, other studies found no differences in recovery rates between older and younger individuals [58] and reported no significant disparities in TBI mortality related to obesity [59]. The research concerning long-term outcomes after TBI is limited and varied [60], which may account for the inconsistency in identified predictors across reviews.
- This meta-analysis examined predictors of long-term functional outcomes—favorable or unfavorable—following TBI of any severity at the time of hospital admission, incorporating both clinical and sociodemographic variables. The analysis revealed a set of predictive factors including age, lymphocyte count, glucose level, hemoglobin concentration, severity of TBI, pupillary response, and type of injury. Together, these factors are valuable in forecasting long-term outcomes that span from 3 to 12 months after injury. Within the scope of this review, significant heterogeneity was observed among several variables, which led to the exclusion of WBCs, neutrophils, neutrophil-lymphocyte ratio, and a range of other variables from consideration as potential predictors for long-term outcomes.
Discussion
- The findings of this study indicate that a range of factors are associated with unfavorable outcomes at 3 to 12 months, including advanced age, low GCS score upon admission, diminished lymphocyte count, elevated glucose level, increased NLR, the presence of mass lesions, IVH, high neutrophil ratio, elevated WBC count, high sodium concentration, elevated Oxford Handicap Scale score, increased monocyte count, and high hemoglobin level. These factors can assist healthcare professionals in estimating patient prognosis following TBI and enable them to predict outcomes swiftly and effectively, thereby facilitating timely and appropriate intervention. Although current evidence does not support the creation of a specific triage tool for predicting TBI severity based on each of these predictors, ongoing research may enable the development of such tools in the near future.
Conclusion
- • This study demonstrated that age, lymphocyte count, glucose level, hemoglobin level, Glasgow coma scale score, pupillary reaction, and type of injury can aid in predicting outcomes following traumatic brain injury.
- • Variables such as neutrophil count, white blood cell count, and neutrophil-to-lymphocyte ratio were found to lack significance for outcome prediction.
- • Predictors of outcomes 3 to 12 months after injury were examined.
HIGHLIGHTS
Supplementary Material
Supplementary Material 1.
Supplementary Material 2.
Figure S1.
-
Ethics Approval
Not applicable.
-
Conflicts of Interest
The authors have no conflicts of interest to declare.
-
Funding
None.
-
Availability of Data
All data generated or analyzed during this study are included in this published article. For other data, these may be requested through the corresponding author.
-
Authors’ Contributions
Conceptualization: YI, MC, ES; Data curation: YI, MG; Formal analysis: YI, MG; Investigation: YI, NAW, MA, NE, YM, KB, MG, AI; Methodology: YI; Project administration: YI, MC, ES; Resources: YI; Software: YI, MG; Supervision: MC, ES; Validation: ES, MC; Visualization: NE; Writing–original draft: YI; Writing–review & editing: all authors. All authors read and approved the final manuscript.
Article information


| Study | Year | Principal predictive factors of outcome | Study design | Location | TBI degree | Outcome assessment tool | Follow-up period (mo) | Sample size | Quality score (NOS) |
|---|---|---|---|---|---|---|---|---|---|
| Kokkinou et al. [35] | 2020 | Age | Longitudinal | Cyprus | Moderate to severe TBI | GOS-E and QOLIBRI-OS | 6 | 203 | Good |
| Latronico et al. [36] | 2020 | Posttraumatic cerebral infarction | Prospective | Italy | Moderate and severe TBI | GOS | 6 | 143 | Good |
| Bennis et al. [24] | 2020 | CRASH model and combined model | Retrospective | Netherlands | Severe TBI | GOS | 6 | 45 | Fair |
| Vijapur et al. [37] | 2021 | Innate immunity, soluble molecules, chemokines | Prospective | USA | Moderate to severe TBI | GOS and DRS | 6–12 | 221 | Fair |
| Dullaert et al. [51] | 2020 | CRASH model | Retrospective | Belgium | All severities | GOS | 6 | 417 | Fair |
| Jiang et al. [25] | 2020 | ICP, caspase 3 | Prospective | China | Severe TBI | GOS | 6 | 45 P and 25 C | Good |
| Thelin et al. [47] | 2019 | Age, glucose level, CT scan results, UCH-L1, GFAP, S100B | Prospective | Sweden | All severities | GOS | 12 | 172 | Good |
| Charry et al. [48] | 2019 | CT scan results, IMPACT model, CRASH model | Retrospective | Colombia | All severities | GOS | 6 | 309 | Fair |
| Hellstrom et al. [34] | 2017 | Brain imaging data, clinical data | Prospective | Norway | Mild TBI | GOS-E, RPQ, PHQ-9 | 12 | 147 | Good |
| Riemann et al. [52] | 2020 | PRx and 20-LPRx | Retrospective | Germany | All severities | GOS | 6 | 855 | Fair |
| Khaki et al. [43] | 2021 | IMPACT base model, CT scan results | Retrospective | Sweden | All severities | GOS | 12 | 158 | Fair |
| Thelin et al. [26] | 2017 | CT scan results | Prospective | Sweden and Finland | Severe TBI | GOS | 12 | 1115 | Good |
| Lindblad et al. [27] | 2021 | QA, cerebrospinal fluid, serum | Prospective | Sweden | Severe TBI | GOS | 6–12 | 90 P and 15 C | Good |
| Chen et al. [28] | 2018 | Age, GCS, glucose, hypoxia, pupillary reactivity, neurological deterioration, seizure, SpO2, CT scan results, mechanical ventilation, intracranial surgery, NLR | Retrospective | China | Severe TBI | GOS | 12 | 688 | Fair |
| Petkus et al. [29] | 2020 | Age, duration of LCAI (PRx>0.5), glucose, GCS | Retrospective | Lithuania | Severe TBI | GOS | 6 | 81 | Fair |
| Bilgi et al. [38] | 2021 | Age, time from injury to surgery, GCS, pupillary reactivity, hemoglobin, glucose, TLC, INR, blood transfusion, decompressive craniectomy | Prospective | India | Moderate and severe isolated head injury | GOS-E | 6 | 96 | Good |
| Bendinelli et al. [30] | 2017 | GCS, injury severity score, days in ICU, CT scan results | Prospective | Australia | Severe TBI | GOS-E | 6 | 50 | Good |
| Tolonen et al. [31] | 2018 | None | Retrospective | Finland | Severe TBI | GOS | 6 and 12 | 28 | Good |
| Gritti et al. [39] | 2019 | Oxford Handicap Scale score, posttraumatic cerebral infarction, posttraumatic hydrocephalus, hygroma, length of stay, invasive ventilation | Retrospective | Italy | Moderate and severe | GOS-E | 12 | 193 | Fair |
| Dolmans et al. [32] | 2020 | Age, hematocrit, hemoglobin, red blood cells, sodium, blood urea nitrogen, INR, prothrombin time | Retrospective | USA | Severe TBI | GOS | 3 | 255 | Fair |
| Bonow et al. [33] | 2018 | Age, race, education, mechanism of injury, motor score, pupillary reactivity, Abbreviated Injury Scale Head score, CT scan results, initial cerebral perfusion pressure | Prospective | Bolivia and Ecuador | Severe TBI | GOS-E | 6 | 550 | Good |
| Li et al. [49] | 2018 | Monocyte level | Observational and non-interventional | China | All severities | GOS-E | 6 | 141 | Good |
| Lindblad et al. [42] | 2018 | Age, GCS, pupil responsiveness, CT scan results, SpO2, arachidonic acid receptor, thrombin receptor, activated partial thromboplastin time, platelet transfusion, COX inhibitor treatment | Retrospective observational | Sweden | All severities | GOS | 12 | 178 | Fair |
| Palekar et al. [44] | 2021 | CT scan results, GCS, pupillary reactivity | Prospective | India | All severities | GOS | 1, 3, and 6 | 108 | Good |
| Yao et al. [40] | 2017 | Age, GCS, motor score, pupillary reactivity, mass lesions, mass lesion size, intraventricular hemorrhage, suprasellar cisterns | Retrospective cohort | China | Moderate, severe, and complicated mild | GOS | 3–6 | 302 | Fair |
| Lagerstedt et al. [45] | 2020 | NA | Prospective, observational | Finland | All severities | GOS-E | 6–12 | 88 | Good |
| Zhao et al. [50] | 2019 | Age, mechanism of injury, pupillary reactivity, GCS, CT scan results, coagulopathy, WBC count, neutrophil ratio, lymphocyte ratio, NLR | Retrospective, observational | China | All severities | GOS | 6 | 1291 | Fair |
| Svedung Wettervik et al. [46] | 2019 | Age, GCS, pupillary reactivity, CT scan results, arterial blood pressure | Retrospective | Sweden | All severities | GOS-E | 6 | 362 | Fair |
| Al-Hassani et al. [41] | 2018 | Age | Retrospective observational | Qatar | Moderate to severe TBI | RLA, FIM, AFG, disability scale | 3 | 201 | Fair |
TBI, traumatic brain injury; NOS, Newcastle-Ottawa scale; GOS-E, Glasgow outcome scale-extended; QOLIBRI-OS, quality of life after traumatic brain injury-overall scale; GOS, Glasgow outcome scale; DRS, disability rating scale; CRASH, Corticosteroid Randomization after Significant Head Injury; ICP, intracranial pressure; P, patients with TBI; C, controls; CT, computed tomography; UCH-L1, ubiquitin carboxy-terminal hydrolase L1; GFAP, glial fibrillary acidic protein; S100B, S100 calcium-binding protein B; PRx, pressure reactivity index; LPRx, long pressure reactivity index; IMPACT, International Mission for Prognosis and Clinical Trial; RPQ, Rivermead Post-Concussion Symptoms Questionnaire; PHQ-9, Patient Health Questionnaire-9; QA, CSF-serum albumin quotient; GCS, Glasgow coma scale; SpO2, blood oxygen saturation; NLR, neutrophil-to-lymphocyte ratio; LCAI, longest cerebrovascular autoregulation impairment; TLC, total leukocyte count; INR, international normalized ratio; ICU, intensive care unit; COX, cyclooxygenase; NA, not applicable; WBC, white blood cell; RLA, Rancho Los Amigos; FIM, functional independence measure; AFG, absolute functional gain.
| Variable | Studies (n) | Proportion (%) | 95% CI |
Test for heterogeneity |
|
|---|---|---|---|---|---|
| I2 (%) | p | ||||
| Sex [25,27,28,30,35,37,41,42,45,46,49] | |||||
| Male | 11 | 47.098 | 34.423–59.966 | 97.62 | <0.001 |
| Female | 11 | 55.355 | 39.858–70.336 | 94.58 | <0.001 |
| GCS [40,44,45] | |||||
| 13–15 | 3 | 6.888 | 2.535–13.161 | 0.00 | 0.535 |
| 9–12 | 3 | 22.361 | 5.599–46.087 | 85.83 | <0.001 |
| 3–8 | 3 | 58.584 | 32.838–82.035 | 91.91 | <0.001 |
| ISS [33,45] | |||||
| 0 to 15 | 2 | 35.317 | 5.741–73.566 | 96.50 | <0.001 |
| 16 or more | 2 | 60.299 | 40.686–78.327 | 72.92 | 0.055 |
| Motor score [33,40,46] | |||||
| 1–2 | 3 | 57.074 | 14.514–93.932 | 98.25 | <0.001 |
| 3–6 | 3 | 51.431 | 39.643–63.139 | 91.50 | <0.001 |
| Marshall score | |||||
| I or II [31,33,45,49] | 4 | 34.433 | 14.880–57.252 | 84.67 | 0.002 |
| III or IV [31,33,45,49] | 4 | 54.197 | 39.698–68.343 | 65.48 | 0.034 |
| V or VI [28,31,33,45,49] | 5 | 62.488 | 50.174–74.033 | 82.52 | <0.001 |
| Abnormal cisterns [28,33,40] | 3 | 65.713 | 48.943–80.675 | 96.45 | <0.001 |
| ICP >20 mmHg [33,49] | 2 | 52.915 | 31.329–73.944 | 68.07 | 0.077 |
| Midline shift of 5 mm or more [28,33,44] | 3 | 63.063 | 48.815–76.235 | 87.92 | <0.001 |
| Hypotension present [33,49] | 2 | 71.004 | 60.059–80.834 | 0.00 | 0.353 |
| Hypoxia present [28,49] | 2 | 86.785 | 77.704–93.767 | 0.00 | 0.406 |
| Blood transfusion [38,49] | 2 | 70.278 | 35.585–95.170 | 92.01 | <0.001 |
| Mechanical ventilation [28,49] | 2 | 90.016 | 38.859–93.648 | 98.25 | <0.001 |
| Surgery | |||||
| Craniectomy [38,46,49] | 3 | 62.456 | 43.356–79.732 | 74.71 | 0.019 |
| Craniotomy [30,46,49] | 3 | 50.511 | 32.933–68.023 | 73.51 | 0.023 |
| Pupillary reaction | |||||
| Both reacting [33,40,44,49,50] | 5 | 31.790 | 18.228–47.153 | 96.14 | <0.001 |
| Neither reacting [33,38,40,44,49,50] | 6 | 71.647 | 53.901–86.469 | 87.95 | <0.001 |
| One reacting [33,38,40,44,49,50] | 6 | 59.451 | 51.214–67.428 | 32.05 | 0.195 |
| Mechanism | |||||
| Violence [31,49,50] | 3 | 30.471 | 18.629–43.801 | 9.34 | 0.332 |
| Road [31,33,49,50] | 4 | 47.120 | 28.696–65.960 | 96.28 | <0.001 |
| Fall [31,33,49,50] | 4 | 47.923 | 23.246–73.155 | 94.23 | <0.001 |
| Others [31,33,49,50] | 4 | 28.353 | 9.265–52.835 | 83.35 | <0.001 |
| Type of injury | |||||
| DAI [30,44,50] | 3 | 65.987 | 53.922–77.082 | 0.00 | 0.649 |
| Epidural hematoma [40,49,50] | 3 | 24.914 | 18.079–32.446 | 50.09 | 0.135 |
| Skull fracture [33,50] | 2 | 39.813 | 9.429–75.544 | 98.55 | <0.001 |
| Intracerebral hematoma [40,44] | 2 | 35.885 | 19.776–53.833 | 55.92 | 0.132 |
| Intraventricular hemorrhage [33,40] | 2 | 76.586 | 59.685–89.971 | 47.48 | 0.168 |
| Subarachnoid hemorrhage [28,33,44,49,50] | 5 | 49.232 | 29.013–69.584 | 98.22 | <0.001 |
| Subdural hematoma [40,44,49,50] | 4 | 44.043 | 37.108–51.097 | 53.49 | 0.092 |
- 1. GBD 2016 Neurology Collaborators. Global, regional, and national burden of neurological disorders, 1990-2016: a systematic analysis for the Global Burden of Disease Study 2016. Lancet Neurol 2019;18:56−87.PubMedPMC
- 2. Nguyen R, Fiest KM, McChesney J, et al. The international incidence of traumatic brain injury: a systematic review and meta-analysis. Can J Neurol Sci 2016;43:774−85.ArticlePubMed
- 3. Puvanachandra P, Hyder AA. The burden of traumatic brain injury in Asia: a call for research. Pakistan J Neurol Sci 2009;4:27−32.
- 4. Rutland-Brown W, Langlois JA, Thomas KE, et al. Incidence of traumatic brain injury in the United States, 2003. J Head Trauma Rehabil 2006;21:544−8.ArticlePubMed
- 5. Seifert J. Incidence and economic burden of injuries in the United States. J Epidemiol Community Health 2007;61:926. Article
- 6. World Health Organization (WHO). Neurological disorders: public health challenges [Internet]. WHO; 2006 [cited 2024 Jan 4]. Available from: https://iris.who.int/handle/10665/43605.
- 7. Ritchie PD, Cameron PA, Ugoni AM, et al. A study of the functional outcome and mortality in elderly patients with head injuries. J Clin Neurosci 2000;7:301−4.ArticlePubMed
- 8. Brown AW, Malec JF, McClelland RL, et al. Clinical elements that predict outcome after traumatic brain injury: a prospective multicenter recursive partitioning (decision-tree) analysis. J Neurotrauma 2005;22:1040−51.ArticlePubMed
- 9. Oremakinde AA, Malomo AO, Dairo MD, et al. Assessment of predictors of one-month outcome in head injury in a Nigerian tertiary hospital. Interdiscip Neurosurg 2019;15:89−97.Article
- 10. Khan KS, Kunz R, Kleijnen J, et al. Five steps to conducting a systematic review. J R Soc Med 2003;96:118−21.ArticlePubMedPMCPDF
- 11. Page MJ, McKenzie JE, Bossuyt PM, et al. The PRISMA 2020 statement: an updated guideline for reporting systematic reviews. BMJ 2021;372:n71. ArticlePubMedPMC
- 12. McLeroy KR, Northridge ME, Balcazar H, et al. Reporting guidelines and the American Journal of Public Health’s adoption of Preferred Reporting Items for Systematic reviews and Meta-Analyses. Am J Public Health 2012;102:780−4.ArticlePubMedPMC
- 13. Wells GA, Shea B, O’Connell D, et al. The Newcastle-Ottawa Scale (NOS) for assessing the quality of nonrandomised studies in meta-analyses [Internet]. Ottawa Hospital Research Institute; 2021 [cited 2024 Jan 4]. Available from: http://www.ohri.ca/programs/clinical_epidemiology/oxford.htm.
- 14. Lo CK, Mertz D, Loeb M. Newcastle-Ottawa Scale: comparing reviewers’ to authors’ assessments. BMC Med Res Methodol 2014;14:45. ArticlePubMedPMCPDF
- 15. rBiostatistics.com. rBiostatistics.com (alpha version) [Internet]. rBiostatistics.com; 2017 [cited 2022 Dec 19]. Available from: https://www.rbiostatistics.com/.
- 16. Freeman MF, Tukey JW. Transformations related to the angular and the square root. Ann Math Stat 1950;21:607−11.Article
- 17. DerSimonian R, Laird N. Meta-analysis in clinical trials. Control Clin Trials 1986;7:177−88.ArticlePubMed
- 18. Egger M, Davey Smith G, Schneider M, et al. Bias in meta-analysis detected by a simple, graphical test. BMJ 1997;315:629−34.ArticlePubMedPMC
- 19. Borenstein M, Hedges LV, Higgins JP, et al. Introduction to meta-analysis. 2nd ed. Wiley; 2021.
- 20. Borenstein M, Higgins JP, Hedges LV, et al. Basics of meta-analysis: I(2) is not an absolute measure of heterogeneity. Res Synth Methods 2017;8:5−18.ArticlePubMedPDF
- 21. von Hippel PT. The heterogeneity statistic I(2) can be biased in small meta-analyses. BMC Med Res Methodol 2015;15:35. PubMedPMC
- 22. Gastwirth JL, Gel YR, Miao W. The impact of Levene’s test of equality of variances on statistical theory and practice. Stat Sci 2009;24:343−60.Article
- 23. Williams LJ, Abdi H. Fisher’s least significant difference test. Edited by Salkind NJ: Encyclopedia of research design. SAGE Publications Inc; 2010. pp 492−4.
- 24. Bennis FC, Teeuwen B, Zeiler FA, et al. Improving prediction of favourable outcome after 6 months in patients with severe traumatic brain injury using physiological cerebral parameters in a multivariable logistic regression model. Neurocrit Care 2020;33:542−51.ArticlePubMedPMCPDF
- 25. Jiang W, Jin P, Wei W, et al. Apoptosis in cerebrospinal fluid as outcome predictors in severe traumatic brain injury: an observational study. Medicine (Baltimore) 2020;99:e20922.PubMedPMC
- 26. Thelin EP, Nelson DW, Vehvilainen J, et al. Evaluation of novel computerized tomography scoring systems in human traumatic brain injury: an observational, multicenter study. PLoS Med 2017;14:e1002368.ArticlePubMedPMC
- 27. Lindblad C, Pin E, Just D, et al. Fluid proteomics of CSF and serum reveal important neuroinflammatory proteins in blood-brain barrier disruption and outcome prediction following severe traumatic brain injury: a prospective, observational study. Crit Care 2021;25:103. ArticlePubMedPMCPDF
- 28. Chen W, Yang J, Li B, et al. Neutrophil to lymphocyte ratio as a novel predictor of outcome in patients with severe traumatic brain injury. J Head Trauma Rehabil 2018;33:E53−9.Article
- 29. Petkus V, Preiksaitis A, Chaleckas E, et al. Optimal cerebral perfusion pressure: targeted treatment for severe traumatic brain injury. J Neurotrauma 2020;37:389−96.ArticlePubMed
- 30. Bendinelli C, Cooper S, Evans T, et al. Perfusion abnormalities are frequently detected by early CT perfusion and predict unfavourable outcome following severe traumatic brain injury. World J Surg 2017;41:2512−20.ArticlePubMedPDF
- 31. Tolonen A, Sarkela MO, Takala RS, et al. Quantitative EEG parameters for prediction of outcome in severe traumatic brain injury: development study. Clin EEG Neurosci 2018;49:248−57.ArticlePubMedPDF
- 32. Dolmans RG, Hulsbergen AF, Gormley WB, et al. Routine blood tests for severe traumatic brain injury: can they predict outcomes? World Neurosurg 2020;136:e60−7.ArticlePubMed
- 33. Bonow RH, Barber J, Temkin NR, et al. The outcome of severe traumatic brain injury in Latin America. World Neurosurg 2018;111:e82−90.ArticlePubMed
- 34. Hellstrom T, Kaufmann T, Andelic N, et al. Predicting outcome 12 months after mild traumatic brain injury in patients admitted to a neurosurgery service. Front Neurol 2017;8:125. PubMedPMC
- 35. Kokkinou M, Kyprianou TC, Kyriakides E, et al. A population study on the epidemiology and outcome of brain injuries in intensive care. NeuroRehabilitation 2020;47:143−52.ArticlePubMed
- 36. Latronico N, Piva S, Fagoni N, et al. Impact of a posttraumatic cerebral infarction on outcome in patients with TBI: the Italian multicenter cohort INCEPT study. Crit Care 2020;24:33. ArticlePubMedPMCPDF
- 37. Vijapur SM, Vaughan LE, Awan N, et al. Treelet transform analysis to identify clusters of systemic inflammatory variance in a population with moderate-to-severe traumatic brain injury. Brain Behav Immun 2021;95:45−60.ArticlePubMedPMC
- 38. Bilgi K, Gopalakrishna KN, Chakrabarti D, et al. Outcome prediction of TBI: are there parameters that affect the IMPACT and CRASH models? World Neurosurg 2021;146:e590−6.ArticlePubMed
- 39. Gritti P, Zangari R, Carobbio A, et al. Acute and subacute outcome predictors in moderate and severe traumatic brain injury: a retrospective monocentric study. World Neurosurg 2019;128:e531−40.ArticlePubMed
- 40. Yao S, Song J, Li S, et al. Helsinki computed tomography scoring system can independently predict long-term outcome in traumatic brain injury. World Neurosurg 2017;101:528−33.ArticlePubMed
- 41. Al-Hassani A, Strandvik GF, El-Menyar A, et al. Functional outcomes in moderate-to-severe traumatic brain injury survivors. J Emerg Trauma Shock 2018;11:197−204.ArticlePubMedPMC
- 42. Lindblad C, Thelin EP, Nekludov M, et al. Assessment of platelet function in traumatic brain injury: a retrospective observational study in the neuro-critical care setting. Front Neurol 2018;9:15. ArticlePubMedPMC
- 43. Khaki D, Hietanen V, Corell A, et al. Selection of CT variables and prognostic models for outcome prediction in patients with traumatic brain injury. Scand J Trauma Resusc Emerg Med 2021;29:94. ArticlePubMedPMCPDF
- 44. Palekar SG, Jaiswal M, Patil M, et al. Outcome prediction in patients of traumatic brain injury based on midline shift on CT scan of brain. Indian J Neurosurg 2021;10:210−5.Article
- 45. Lagerstedt L, Azurmendi L, Tenovuo O, et al. Interleukin 10 and heart fatty acid-binding protein as early outcome predictors in patients with traumatic brain injury. Front Neurol 2020;11:376. ArticlePubMedPMC
- 46. Svedung Wettervik T, Howells T, Enblad P, et al. Temporal neurophysiological dynamics in traumatic brain injury: role of pressure reactivity and optimal cerebral perfusion pressure for predicting outcome. J Neurotrauma 2019;36:1818−27.ArticlePubMed
- 47. Thelin E, Al Nimer F, Frostell A, et al. A serum protein biomarker panel improves outcome prediction in human traumatic brain injury. J Neurotrauma 2019;36:2850−62.ArticlePubMedPMC
- 48. Charry JD, Navarro-Parra S, Solano J, et al. Outcomes of traumatic brain injury: the prognostic accuracy of various scores and models. Neurol Neurochir Pol 2019;53:55−60.ArticlePubMed
- 49. Li Z, Wu X, Wu X, et al. Admission circulating monocytes level is an independent predictor of outcome in traumatic brain injury. Brain Inj 2018;32:515−22.ArticlePubMed
- 50. Zhao JL, Du ZY, Yuan Q, et al. Prognostic value of neutrophil-to-lymphocyte ratio in predicting the 6-month outcome of patients with traumatic brain injury: a retrospective study. World Neurosurg 2019;124:e411−6.ArticlePubMed
- 51. Dullaert M, Oerlemans J, De Paepe P, et al. Comparison of the CRASH score-predicted and real outcome of traumatic brain injury in a retrospective analysis of 417 patients. World Neurosurg 2020;137:e159−65.ArticlePubMed
- 52. Riemann L, Beqiri E, Younsi A, et al. Predictive and discriminative power of pressure reactivity indices in traumatic brain injury. Neurosurgery 2020;87:655−63.ArticlePubMedPDF
- 53. McIntyre A, Mehta S, Janzen S, et al. A meta-analysis of functional outcome among older adults with traumatic brain injury. NeuroRehabilitation 2013;32:409−14.ArticlePubMed
- 54. Mishra RK, Galwankar S, Gerber J, et al. Neutrophil-lymphocyte ratio as a predictor of outcome following traumatic brain injury: systematic review and meta-analysis. J Neurosci Rural Pract 2022;13:618−35.ArticlePubMedPMC
- 55. Madhok DY, Yue JK, Sun X, et al. Clinical predictors of 3- and 6-month outcome for mild traumatic brain injury patients with a negative head CT scan in the emergency department: a TRACK-TBI pilot study. Brain Sci 2020;10:269. ArticlePubMedPMC
- 56. van der Naalt J, Timmerman ME, de Koning ME, et al. Early predictors of outcome after mild traumatic brain injury (UPFRONT): an observational cohort study. Lancet Neurol 2017;16:532−40.ArticlePubMed
- 57. Cappa KA, Conger JC, Conger AJ. Injury severity and outcome: a meta-analysis of prospective studies on TBI outcome. Health Psychol 2011;30:542−60.ArticlePubMed
- 58. Hume CH, Wright BJ, Kinsella GJ. Systematic review and meta-analysis of outcome after mild traumatic brain injury in older people. J Int Neuropsychol Soc 2022;28:736−55.ArticlePubMed
- 59. Mishra R, Galwankar S, Konar S, et al. Obesity as a predictor of outcome following traumatic brain injury: a systematic review and meta-analysis. Clin Neurol Neurosurg 2022;217:107260. ArticlePubMed
- 60. Mostert CQ, Singh RD, Gerritsen M, et al. Long-term outcome after severe traumatic brain injury: a systematic literature review. Acta Neurochir (Wien) 2022;164:599−613.ArticlePubMedPDF
References
Figure & Data
References
Citations
 Cite
Cite- Figure
-

- Related articles
-
- Global prevalence of enterobiasis in young children over the past 20 years: a systematic review and meta-analysis
- Effects of medication adherence interventions for older adults with chronic illnesses: a systematic review and meta-analysis
- Effect of clofibrate on reducing neonatal jaundice: a systematic review and meta-analysis
- Associations of pre-existing cardiovascular morbidity with severity and the fatality rate in COVID-19 patients: a systematic review and meta-analysis
