
Articles
- Page Path
- HOME > Osong Public Health Res Perspect > Volume 7(1); 2016 > Article
-
Original Article
Mediating and Moderating Effects in Ageism and Depression among the Korean Elderly: The Roles of Emotional Reactions and Coping Reponses - Il-Ho Kima,b, Samuel Noha,b, Heeran Chunc
-
Osong Public Health and Research Perspectives 2015;7(1):3-11.
DOI: https://doi.org/10.1016/j.phrp.2015.11.012
Published online: December 12, 2015
aSocial and Epidemiological Research, Centre for Addiction and Mental Health, Toronto, Canada
bDepartment of Psychiatry, University of Toronto, Toronto, Canada
cDepartment of Health Administration, Jungwon University, Goesan, Korea
- ∗Corresponding author. heeranchun@gmail.com
• Received: November 22, 2015 • Accepted: November 30, 2015
Copyright © 2015 Korea Centers for Disease Control and Prevention. Published by Elsevier Korea LLC.
This is an open access article under the CC BY-NC-ND license (http://creativecommons.org/licenses/by-nc-nd/4.0/).
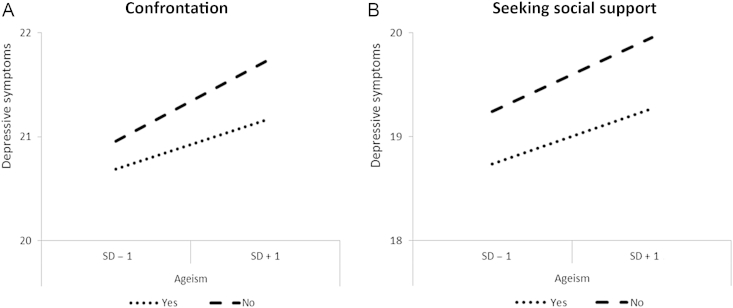
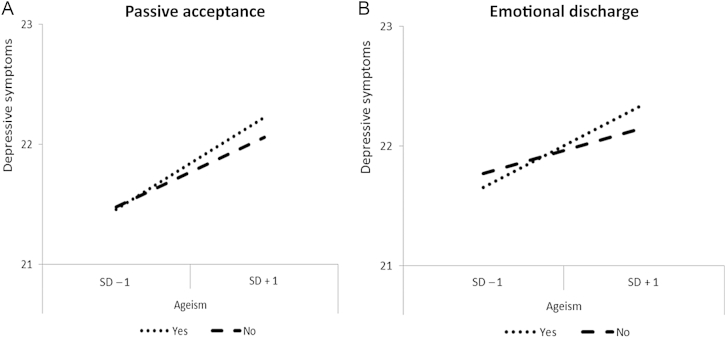
Figure & Data
References
Citations
Citations to this article as recorded by 
- Can Residents Access Leisure Spaces in Our City: Investigating the Leisure Space Distribution in Seoul, South Korea
Hyun-Young Jin, Junhee Cho, Yujin Kim, Lisa Lim
Leisure Sciences.2024; : 1. CrossRef - Reducing negative attitudes toward older adults and increasing advocacy for policies to support older adults: Bayesian analysis approach
Yuho Shimizu, Takaaki Hashimoto, Kaori Karasawa
Acta Psychologica.2023; 239: 103995. CrossRef - Changes in perceived ageism during the COVID-19 pandemic: impact on quality of life and mental well-being among Dutch adults aged 55 and older
Lotte P. Brinkhof, J. M. J. Murre, S. de Wit, H. J. Krugers, K. R. Ridderinkhof
Aging & Mental Health.2023; 27(12): 2490. CrossRef - Impact of a Nonfamilial Intergenerational Program With a Mobile Application on College Students’ Attitudes Toward Older Adults in Taiwan
Jeffrey Tsifan Tseng, Hsinyi Hsiao, Amy Pei-Lung Yu, Yi Chen
Journal of the Society for Social Work and Researc.2023; 14(2): 365. CrossRef - A phenomenological, intersectional understanding of coping with ageism and racism among older adults
Andrew T. Steward, Yating Zhu, Carson M. De Fries, Annie Zean Dunbar, Miguel Trujillo, Leslie Hasche
Journal of Aging Studies.2023; 67: 101186. CrossRef - Do we all perceive experiences of age discrimination in the same way? Cross-cultural differences in perceived age discrimination and its association with life satisfaction
M. Clara P. de Paula Couto, Jana Nikitin, Sylvie Graf, Helene H. Fung, Thomas M. Hess, Shyhnan Liou, Klaus Rothermund
European Journal of Ageing.2023;[Epub] CrossRef - The Trajectory of Depressive Symptoms Across Years of Community Care Utilization Among Older Adults: A 14-Year Follow-up Study Using the ‘Korean Welfare Panel Survey’
Il-Ho Kim, Cheong-Seok Kim, Min-Hyeok Jeong
Journal of Preventive Medicine and Public Health.2023; 56(6): 495. CrossRef - Mitigating the Harmful Impact of Ageism among Older Individuals: The Buffering Role of Resilience Factors
Lotte P. Brinkhof, Sanne de Wit, Jaap M. J. Murre, K. Richard Ridderinkhof
Geriatrics.2023; 9(1): 1. CrossRef - Reducing ageism focusing on stereotype embodiment theory: Pre-registered study and Bayesian analysis approach
Yuho Shimizu
Experimental Results.2023;[Epub] CrossRef - Association Between Self-Perceived Stigma and Quality of Life Among Urban Chinese Older Adults: The Moderating Role of Attitude Toward Own Aging and Traditionality
Tao Sun, Shu-E Zhang, Meng-yao Yan, Ting-hui Lian, Yi-qi Yu, Hong-yan Yin, Chen-xi Zhao, Yan-ping Wang, Xiao Chang, Ke-yu Ji, Si-yu Cheng, Xiao-he Wang, Xian-hong Huang, De-pin Cao
Frontiers in Public Health.2022;[Epub] CrossRef - You’re Too Old for That! Ageism and Prescriptive Stereotypes in the Workplace
Elizabeth A Hanrahan, Courtney L Thomas, Lisa M Finkelstein, Mo Wang
Work, Aging and Retirement.2022;[Epub] CrossRef - Ageism and Psychological Well-Being Among Older Adults: A Systematic Review
Hyun Kang, Hansol Kim
Gerontology and Geriatric Medicine.2022; 8: 233372142210870. CrossRef - The Subjective Experience of Ageism: The Perceived Ageism Questionnaire (PAQ)
Lotte P. Brinkhof, Sanne de Wit, Jaap M. J. Murre, Harm J. Krugers, K. Richard Ridderinkhof
International Journal of Environmental Research an.2022; 19(14): 8792. CrossRef - Depressive Symptoms and Ageism among Nursing Home Residents: The Role of Social Support
Dongjuan Xu, Yaqi Wang, Ming Li, Meng Zhao, Zhenhua Yang, Kefang Wang
International Journal of Environmental Research an.2022; 19(19): 12105. CrossRef - Coping Style, Insomnia, and Psychological Distress Among Persons With Gastrointestinal Cancer
Gaorong Lv, Di Zhao, Guopeng Li, Qing Wang, Miao Zhou, Yiming Gao, Xiangyu Zhao, Ping Li
Nursing Research.2022; 71(6): 450. CrossRef - Assessing knowledge and ageist attitudes and behaviors toward older adults among undergraduate nursing students
Mohammad Rababa, Tariq Al-Dwaikat, Maysa H. Almomani
Gerontology & Geriatrics Education.2021; 42(3): 347. CrossRef - Day-to-Day Variability in Subjective Age and Ageist Attitudes and Their Association With Depressive Symptoms
Ehud Bodner, Amit Shrira, Yaakov Hoffman, Yoav S Bergman, Shevaun Neupert
The Journals of Gerontology: Series B.2021; 76(5): 836. CrossRef - Association of nurses’ characteristics and level of knowledge with ageist attitudes toward older adults: a systematic review
Mohammad Rababa, Ammar M. Hammouri, Sami Al-Rawashdeh
Working with Older People.2021; 25(1): 21. CrossRef - Associations of perceived poor societal treatment among the oldest-old
M Knuutila, TE Lehti, H Karppinen, H Kautiainen, TE Strandberg, KH Pitkala
Archives of Gerontology and Geriatrics.2021; 93: 104318. CrossRef - Ageism and the Factors Affecting Ageism among Korean Nursing Students: A Cross-Sectional Study
Jiyeon Ha, Juah Kim
International Journal of Environmental Research an.2021; 18(4): 1798. CrossRef - Psychometrics of Persian Version of the Ageism Survey Among an Iranian Older Adult Population During COVID-19 Pandemic
Hamid Sharif Nia, Long She, Ratneswary Rasiah, Fatemeh Khoshnavay Fomani, Omolhoda Kaveh, Saeed Pahlevan Sharif, Lida Hosseini
Frontiers in Public Health.2021;[Epub] CrossRef - Global reach of ageism on older persons’ health: A systematic review
E-Shien Chang, Sneha Kannoth, Samantha Levy, Shi-Yi Wang, John E. Lee, Becca R. Levy, Antony Bayer
PLOS ONE.2020; 15(1): e0220857. CrossRef - The Role of Socio-demographics in Adoption of Religious–Spiritual and Other Coping Strategies Among Muslim Chronic Patients with Hepatitis C in Pakistan
Malik Muhammad Sohail, Saeed Ahmad, Fauzia Maqsood
Journal of Religion and Health.2020; 59(1): 234. CrossRef - Association of nurses' level of knowledge and attitudes to ageism toward older adults: Cross‐sectional study
Mohammad Rababa, Ammar M. Hammouri, Issa M. Hweidi, Julie L. Ellis
Nursing & Health Sciences.2020; 22(3): 593. CrossRef - How does ageism influence frailty? A preliminary study using a structural equation model
Bo Ye, Junling Gao, Hua Fu, Hao Chen, Wenjing Dong, Ming Gu
BMC Geriatrics.2020;[Epub] CrossRef - Ageism, Attitudes Toward Aging, and Body Satisfaction by Subjective Socioeconomic and Health Status Among Older Women
Haekyung Yu, Minsun Lee
Fashion & Textile Research Journal.2019; 21(5): 586. CrossRef - Where are we now in relation to determining the prevalence of ageism in this era of escalating population ageing?
Donna M. Wilson, Begoña Errasti-Ibarrondo, Gail Low
Ageing Research Reviews.2019; 51: 78. CrossRef
 PubReader
 Cite
Cite

