
Articles
- Page Path
- HOME > Osong Public Health Res Perspect > Volume 10(6); 2019 > Article
-
Original Article
Estimation of the Size of Dengue and Zika Infection Among Korean Travelers to Southeast Asia and Latin America, 2016–2017 - Chaeshin Chu, Een Suk Shin
-
Osong Public Health and Research Perspectives 2019;10(6):394-398.
DOI: https://doi.org/10.24171/j.phrp.2019.10.6.10
Published online: December 31, 2019
Division of Risk Assessment and International Cooperation, Korea Centers for Disease Control and Prevention, Osong, Korea
- *Corresponding author: Chaeshin Chu, Division of Risk Assessment and International Cooperation, Korea Centers for Disease Control and Prevention, Osong, Korea, Email: sammidori@empal.com
• Received: October 27, 2019 • Revised: November 27, 2019 • Accepted: December 4, 2019
Copyright ©2019, Korea Centers for Disease Control and Prevention
This is an open access article under the CC BY-NC-ND license (http://creativecommons.org/licenses/by-nc-nd/4.0/).
- 4,193 Views
- 62 Download
- 1 Scopus
Abstract
-
Objectives
- To estimate the number and risk of imported infections resulting from people visiting Asian and Latin American countries.
-
Methods
- The dataset of visitors to 5 Asian countries with dengue were analyzed for 2016 and 2017, and in the Philippines, Thailand and Vietnam, imported cases of zika virus infection were also reported. For zika virus, a single imported case was reported from Brazil in 2016, and 2 imported cases reported from the Maldives in 2017. To understand the transmissibility in 5 Southeast Asian countries, the estimate of the force of infection, i.e., the hazard of infection per year and the average duration of travel has been extracted. Outbound travel numbers were retrieved from the World Tourism Organization, including business travelers.
-
Results
- The incidence of imported dengue in 2016 was estimated at 7.46, 15.00, 2.14, 4.73 and 2.40 per 100,000 travelers visiting Philippines, Indonesia, Thailand, Malaysia and Vietnam, respectively. Similarly, 2.55, 1.65, 1.53, 1.86 and 1.70 per 100,000 travelers in 2017, respectively. It was estimated that there were 60.1 infections (range: from 16.8 to 150.7 infections) with zika virus in Brazil, 2016, and 345.6 infections (range: from 85.4 to 425.5 infections) with zika virus in the Maldives, 2017.
-
Conclusion
- This study emphasizes that dengue and zika virus infections are mild in their nature, and a substantial number of infections may go undetected. An appropriate risk assessment of zika virus infection must use the estimated total size of infections.
- Dengue fever is casued by the dengue virus [1]. Symptoms begin 3 to 14 days after infection and may include a high fever, headache, vomiting, muscle and joint pains, and a skin rash [1,2]. Recovery takes 2 to 7 days [1]. Dengue fever can develop into dengue hemorrhagic fever, the symptoms of which are bleeding, low blood platelets level and leakage of blood plasma, and/or dengue shock syndrome where there is low blood pressure that may cause circulatory collapse [1,2]. The main route of dengue virus transmission is through the bite of female Aedes mosquitoes, mainly A. aegypti and A. albopictus [2]. There are 4 serotypes of dengue virus-1, −2, −3, and −4 [3]. Infection by 1 type of dengue virus does not confer protection against other types. Furthemore infections with another serotype of dengue virus may cause severe complications [1]. Various laborabory testing methods such as detecting antibodies to the virus or its RNA are used for diagnostic confirmation of infection with dengue virus [2].
- Infection with zika virus may also be caused by being bitten by a mosquito carrying the zika virus [4] and in most cases infection is asymptomatic, or only causes mild symptoms [4,5]. The incubation period is less than 7 days [4–6]. Death due to zika has not been reported in Europe [7]. Microcephaly and other brain malformations have been reported in babies of mothers infected with zika virus known as congenital zika syndrome [6]. Guillain–Barré syndrome (GBS) is where there are neurological complication associated with zika virus infection of adults and children [7]. The main route of zika virus is mainly by A. aegypti and A. albopictus [6] although zika virus can be transmitted through sexual contact, blood transfusions, and organ transplantation [6]. The test specimens for the presence of the zika virus RNA are blood, urine or saliva obtained from the affected person, and diagnosis using antibodies in the blood can be performed more than a week after symptoms appeared [5].
- As of September 2019, cases of dengue and zika infection in the Republic of Korea were in people who had entered the country from abroad. Korea Centers for Disease Control and Prevention annually reports about 150–300 cases of dengue infection, and about 3–10 cases of zika infection each year [8]. Korea Centers for Disease Control and Prevention issued several press releases to inform Korean travelers to Southeast Asia to take measures to prevent zika and dengue viral infection during their travel [9–13].
- Given the scarcity of the number of cases observed, it is vital to estimate the potential number of individuals infected with dengue or zika virus amongst travelers from the Republic of Korea. The present study aimed to estimate the numbers and the risk of infection of Koreans whilst visiting Asian and Latin American countries.
Introduction
- 1. Epidemiological data
- In Korea, upon diagnosis of dengue and zika virus infections, physicians are mandated to report confirmed cases to the government immediately. Specifically, the reported numbers of cases among visitors to countries known to have dengue virus in 2016 and 2017, namely the Philippines (n = 110, n = 41, respectively), Indonesia (n = 58, n = 7, respectively), Thailand (n = 31, n = 26, respectively), Malaysia (n = 21, n = 9, respectively) and Vietnam (n = 37, n = 41, respectively) were analyzed. Among Korean visitors to the Philippines, Thailand and Vietnam, imported cases of zika virus infection were also reported. A single imported case of zika virus was reported from Brazil in 2016, and there were 2 imported cases from the Maldives in 2017. There were cases of zika virus imported from Bolivia, Puerto Rico, Guatemala and Cuba, however, the number of travelers to these 4 countries in 2016 and 2017 was unclear.
- To understand the transmissibility in the Philippines, Indonesia, Thailand, Malaysia, and Vietnam the estimate of the force of infection, i.e., the hazard of infection per year, which was estimated for Japanese travelers by Yuan and Nishiura in 2018 [14] was assumed to be similar to what was expected for Koreans. The force of infection estimates in Philippines, Indonesia, Thailand, Malaysia and Vietnam in 2018 were 0.017, 0.045, 0.017, 0.060 and 0.007 per year, respectively [14]. Similarly, the average duration of travel reported for Japanese travelers [14], was assumed to be comparable estimates for Korean travelers.
- 2. Human mobility data
- The total number of Korean travelers to each destination country at risk of dengue or zika virus transmission, was retrieved from publicly accessible data. Specifically, outbound travel numbers were retrieved from the World Tourism Organization [15], including holiday and business travelers.
- Let Ni be the yearly number of travelers to destination i and λi, and Di be the force of infection and the duration of travel in the destination country i. The expected number of infections is described as:
- of which only mi cases are observed. Let αi be the probability that an infected individual results in notification of the authorities.
- Equation (2) and maximum likelihood method were used to estimate αi for each destination country in Southeast Asia.
- Subsequently, the range and median estimates of αi for imputing unascertained infections among travelers returning from Brazil and the Maldives were used. Asymptomatic ratio of dengue and zika virus infections are known to be comparable, estimated at around 80% [16,17]. Thus, here an important assumption was imposed, such that the country specific αi can be utilized for imputation purposes of zika virus infection. Given the estimated α, the expected number of cases was assumed to follow a Poisson distribution, i.e.,
- where ci represents the number of confirmed cases of zika virus infection from country i. Similarly, the average risk of confirming zika virus infection per traveler, by visiting the destination country I was estimated by
- Using equations (3) and (4), along with the travel volume Ni, and estimated αi using dengue data, the number of zika virus infections from Brazil and Maldives in 2016 and 2017, respectively, were estimated.
Materials and Methods
2.1. Mathematical model
- Figure 1 shows the yearly number of Korean travelers visiting Southeast Asian countries, contrasted against those visiting Brazil and the Maldives. The incidence of imported and confirmed dengue virus infections in 2016 was estimated at 7.46, 15.00, 2.14, 4.73 and 2.40 per 100,000 travelers visiting the Philippines, Indonesia, Thailand, Malaysia and Vietnam, respectively. Similarly, the incidence in 2017 was estimated at 2.55, 1.65, 1.53, 1.86 and 1.70 per 100,000 travelers, respectively.
- Figure 2 shows the estimated αi (probability that the authorities are notified of an infected individual) for dengue virus infection. Of the total number of travelers infected with dengue virus, an estimated 0.67% to 5.96% were diagnosed in 2016, and 0.47% to 2.34% were diagnosed in 2017. Significantly differing estimates between 2016 and 2017 may reflect underlying factors of how data was ascertained, and other sources of heterogeneity.
- Using the median and ranges (i.e. minimum and maximum) of αi, there were an estimated 60.1 infections (range: from 16.8 to 150.7 infections) with zika virus in Brazil in 2016. Similarly, there were 345.6 infections (range: from 85.4 to 425.5 infections) estimated with zika virus in Maldives in 2017. Table 1 summarizes the estimated number of zika virus infections, and the risk of infection per trip in Brazil and the Maldives using median value of αi. The risk of zika virus infection per trip to Brazil in 2016 and the Maldives in 2017 was estimated to be 0.12% (95% CI: 0, 0.35) and 0.99% (95% CI: 0, 2.36), respectively.
Results
- The present study explored the undiagnosed numbers of dengue and zika virus infections among Korean travelers returning from endemic areas of Southeast Asia (Philippines, Indonesia, Thailand, Malaysia and Vietnam), Brazil and the Maldives in 2016 and 2017. In addition to notification data, the number of travelers to destination countries of infection were assessed, together with the average duration of travel and the force of infection for dengue virus infection. Due to similarities between dengue and zika virus infections, especially with a published estimate of the asymptomatic ratio being 80%, an assumption that the ascertainment factor of dengue was comparable to that of zika infection was imposed, yielding an estimate of total number of infected individuals. To our knowledge, the present study is the first to have effectively used dengue imported case data to impute zika virus infections with defensible assumptions.
- It must be noted that the estimated total number of zika virus infections from Brazil was as large as 60 infections, while there was only 1 actual case of zika virus infection reported to the authorities. In the case of the Maldives, there may have been as many as 350 infections estimated, while there were only 2 cases notified in Korea. The results from this study emphasizes that both dengue and zika virus infections are mild in their nature, and a substantial proportion of infections may be undetected. Reported cases of infection may represent only the tip of the iceberg of total number of infections in a population, and an appropriate risk assessment of zika virus infection must use the estimated total size of infections. The method used in this study allowed computation of the key quantity required for risk assessment. Given that substantial numbers of travelers that are likely to be infected, it is desirable to consider surveying results of Aedes mosquitoes in Korea during the summer season, as part of a national risk assessment strategy.
- The limitation of this study is as follows: Firstly, the present study inherently assumed that all travelers behaved homogeneously, which is not true. Secondly, while the absence of imported and confirmed cases from many other countries did not result in any estimate of the actual number of infections, that may be simply due to ascertainment bias. Thirdly, seasonal forcing (e.g. seasonally varying transmissibility) was not taken into account during the estimation procedure.
Discussion
-
Acknowledgements
- The authors are thankful to the World Tourism Organization for providing the open dataset of outbound travel numbers.
Acknowledgments
Supplementary Materials
- 1. World Health Organization [Internet]. Dengue and severe dengue Geneva (Switzerland): World Health Organization; 2019 Available from: https://www.who.int/en/news-room/fact-sheets/detail/dengue-and-severe-dengue.
- 2. Kularatne SA. Dengue fever. BMJ 2015;351:h4661PMID: 10.1136/bmj.h4661. PMID: 26374064.ArticlePubMed
- 3. Normile D. Tropical medicine. Surprising new dengue virus throws a spanner in disease control efforts. Science 2013;342(6157). 415PMID: 10.1126/science.342.6157.415. PMID: 24159024.ArticlePubMed
- 4. World Health Organization [Internet]. Zika virus Geneva (Switzerland): World Health Organization; 2018 Available from: https://www.who.int/en/news-room/fact-sheets/detail/zika-virus.
- 5. Rasmussen SA, Jamieson DJ, Honein MA, et al. Zika virus and birth defects — Reviewing the evidence for causality. N Engl J Med 2016;374(20). 1981−7. PMID: 10.1056/NEJMsr1604338. PMID: 27074377.ArticlePubMed
- 6. Chen LH, Hamer DH. Zika virus: rapid spread in the western hemisphere. Ann Intern Med 2016;164(9). 613−5. PMID: 10.7326/M16-0150. PMID: 26832396.ArticlePubMed
- 7. European Centre for Disease Prevention and Control [Internet]. Zika virus 2015 Available from: https://www.ecdc.europa.eu/en/zika-virus-disease.
- 8. Korea Centers for Disease Control and Prevention. Public Health Wkly Rep 2019;12(39). 1579−80. [in Korean].
- 9. Korea Centers for Disease Control & Prevention. Be wary of Zika infection during traveling Southeast Asia Cheongju (Korea): Korea Centers for Disease Control & Prevention; 2018 Available from: https://is.cdc.go.kr/upload_comm/syview/doc.html?fn=157553612744200.pdf&rs=/upload_comm/docu/0015/. [in Korean].
- 10. Korea Centers for Disease Control & Prevention. Be wary of mosquito-borne disease to travelers Cheongju (Korea): Korea Centers for Disease Control & Prevention; 2018 Available from: https://is.cdc.go.kr/upload_comm/syview/doc.html?fn=157553307321500.pdf&rs=/upload_comm/docu/0015/. [in Korean].
- 11. Korea Centers for Disease Control & Prevention. Be wary of mosquitoes against imported dengue fever Cheongju (Korea): Korea Centers for Disease Control & Prevention; 2016 Available from https://www.cdc.go.kr/board.es?mid=a20501000000&bid=0015. [in Korean].
- 12. Korea Centers for Disease Control & Prevention. Dengue virus identified during mosquito monitoring Cheongju (Korea): Korea Centers for Disease Control & Prevention; 2019 Available from: https://is.cdc.go.kr/upload_comm/syview/doc.html?fn=156732913531100.pdf&rs=/upload_comm/docu/0015/. [in Korean].
- 13. Korea Centers for Disease Control & Prevention. Be wary of Dengue fever during overseas travel Cheongju (Korea): Korea Centers for Disease Control & Prevention; 2019 Available from: https://is.cdc.go.kr/upload_comm/syview/doc.html?fn=156733150026200.pdf&rs=/upload_comm/docu/0015/. [in Korean].
- 14. Yuan B, Nishiura H. Estimating the actual importation risk of dengue virus infection among Japanese travelers. PLoS One 2018;13(6). e0198734PMID: 10.1371/journal.pone.0198734. PMID: 29924819. PMID: 6010241.ArticlePubMedPMC
- 15. Korea, Republic Of: Country-specific: Outbound tourism 1995 – 2018 (10.2019) [Internet] World Tourism Organization; 2019 Available from: https://www.e-unwto.org/doi/suppl/10.5555/unwtotfb0410250119952018201910.
- 16. Brady OJ, Gething PW, Bhatt S, et al. Refining the global spatial limits of dengue virus transmission by evidence-based consensus. PLoS Negl Trop Dis 2012;6(8). e1760PMID: 10.1371/journal.pntd.0001760. PMID: 22880140. PMID: 3413714.ArticlePubMedPMC
- 17. Duffy MR, Chen TH, Hancock WT, et al. Zika virus outbreak on Yap Island, Federated States of Micronesia. N Engl J Med 2009;360(24). 2536−43. PMID: 10.1056/NEJMoa0805715. PMID: 19516034.ArticlePubMed
References
Figure 1Number of outbound passengers by destination country in Korea in 2016 and 2017. Yearly number of travelers visiting the designated destination with dengue or Zika virus transmission is shown. Numbers at the top of white bars represent the absolute value in 2017.
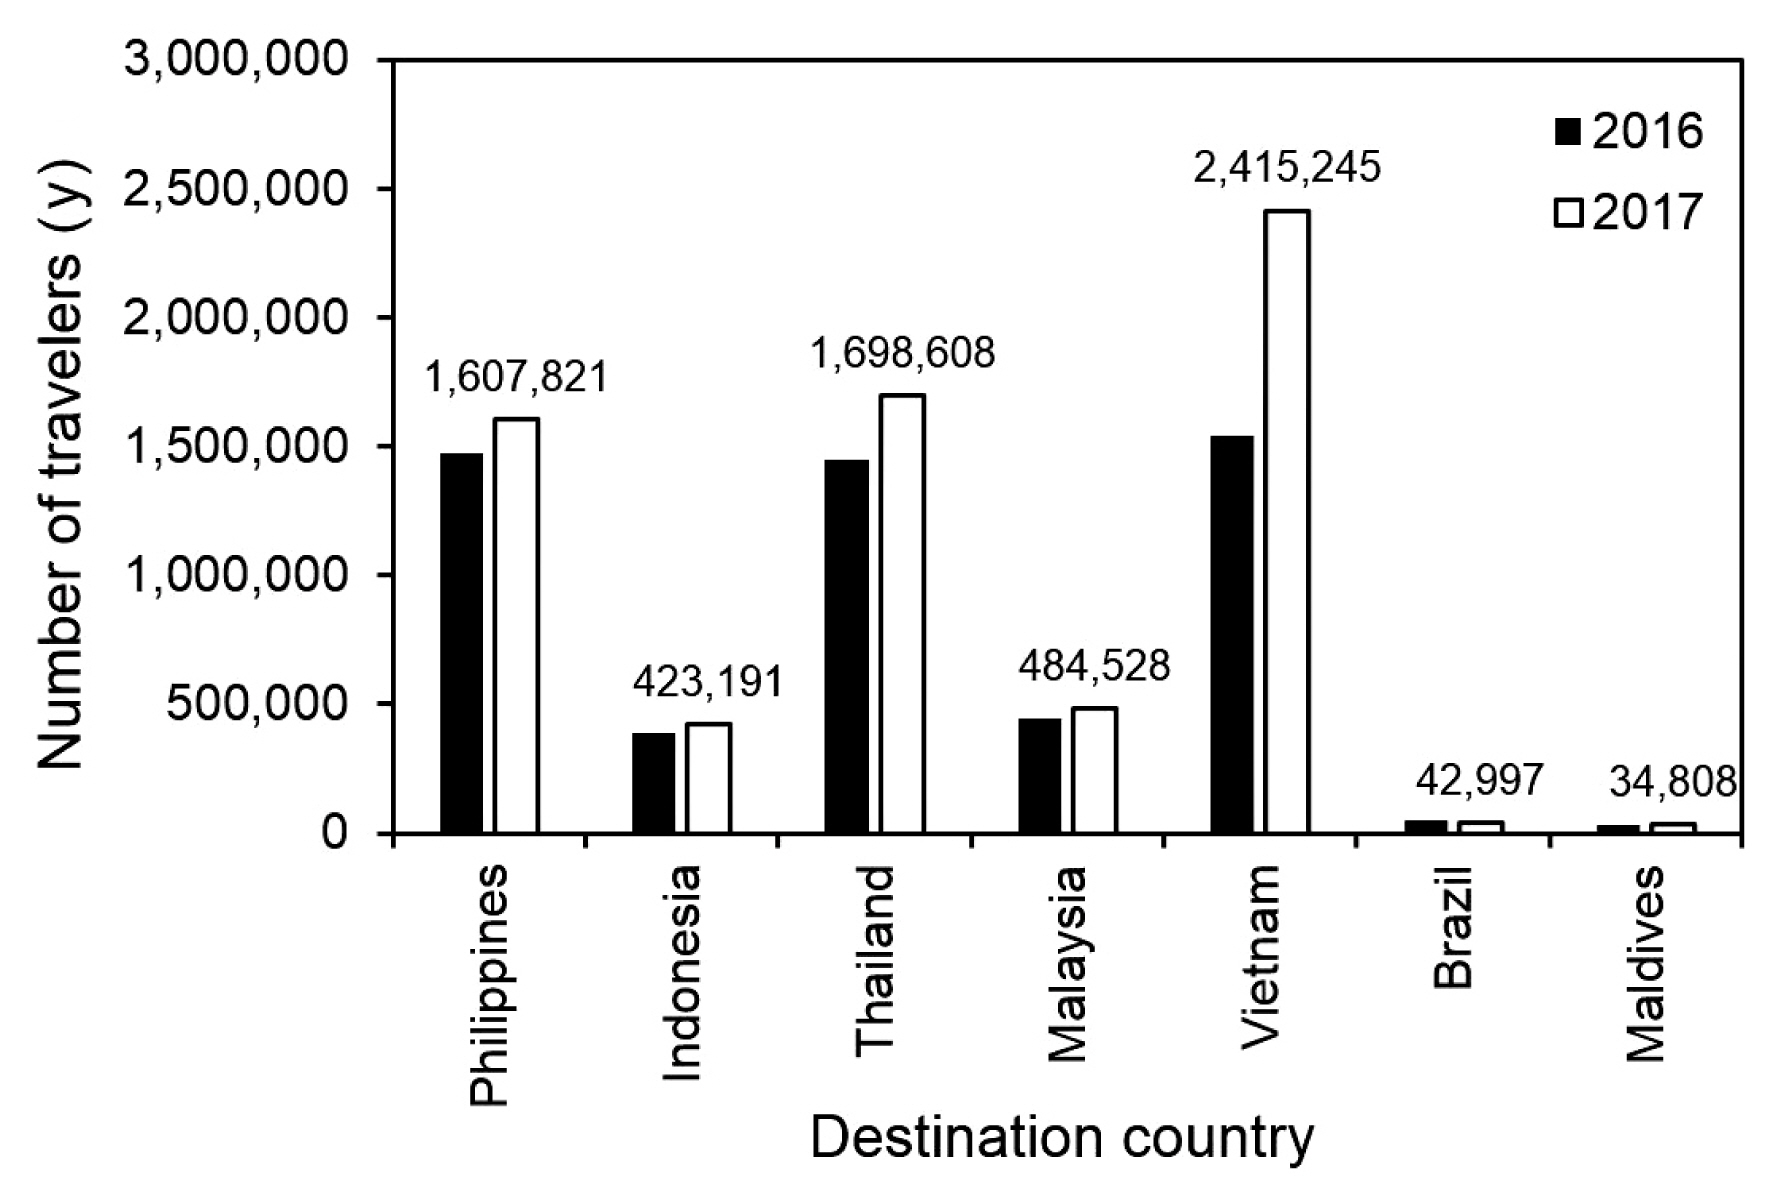
Figure 2Estimates of reporting coverage of imported dengue cases in Korea by destination country in 2016 and 2017. Vertical axis measures the reporting coverage out of the total volume of dengue virus infections, inclusive of the risk of symptomatic infection. Depending on year of travel, epidemiological situations of dengue transmission are variable, and estimates are also different by year of travel. The whiskers represent the 95% confidence interval, derived using the Wald method.
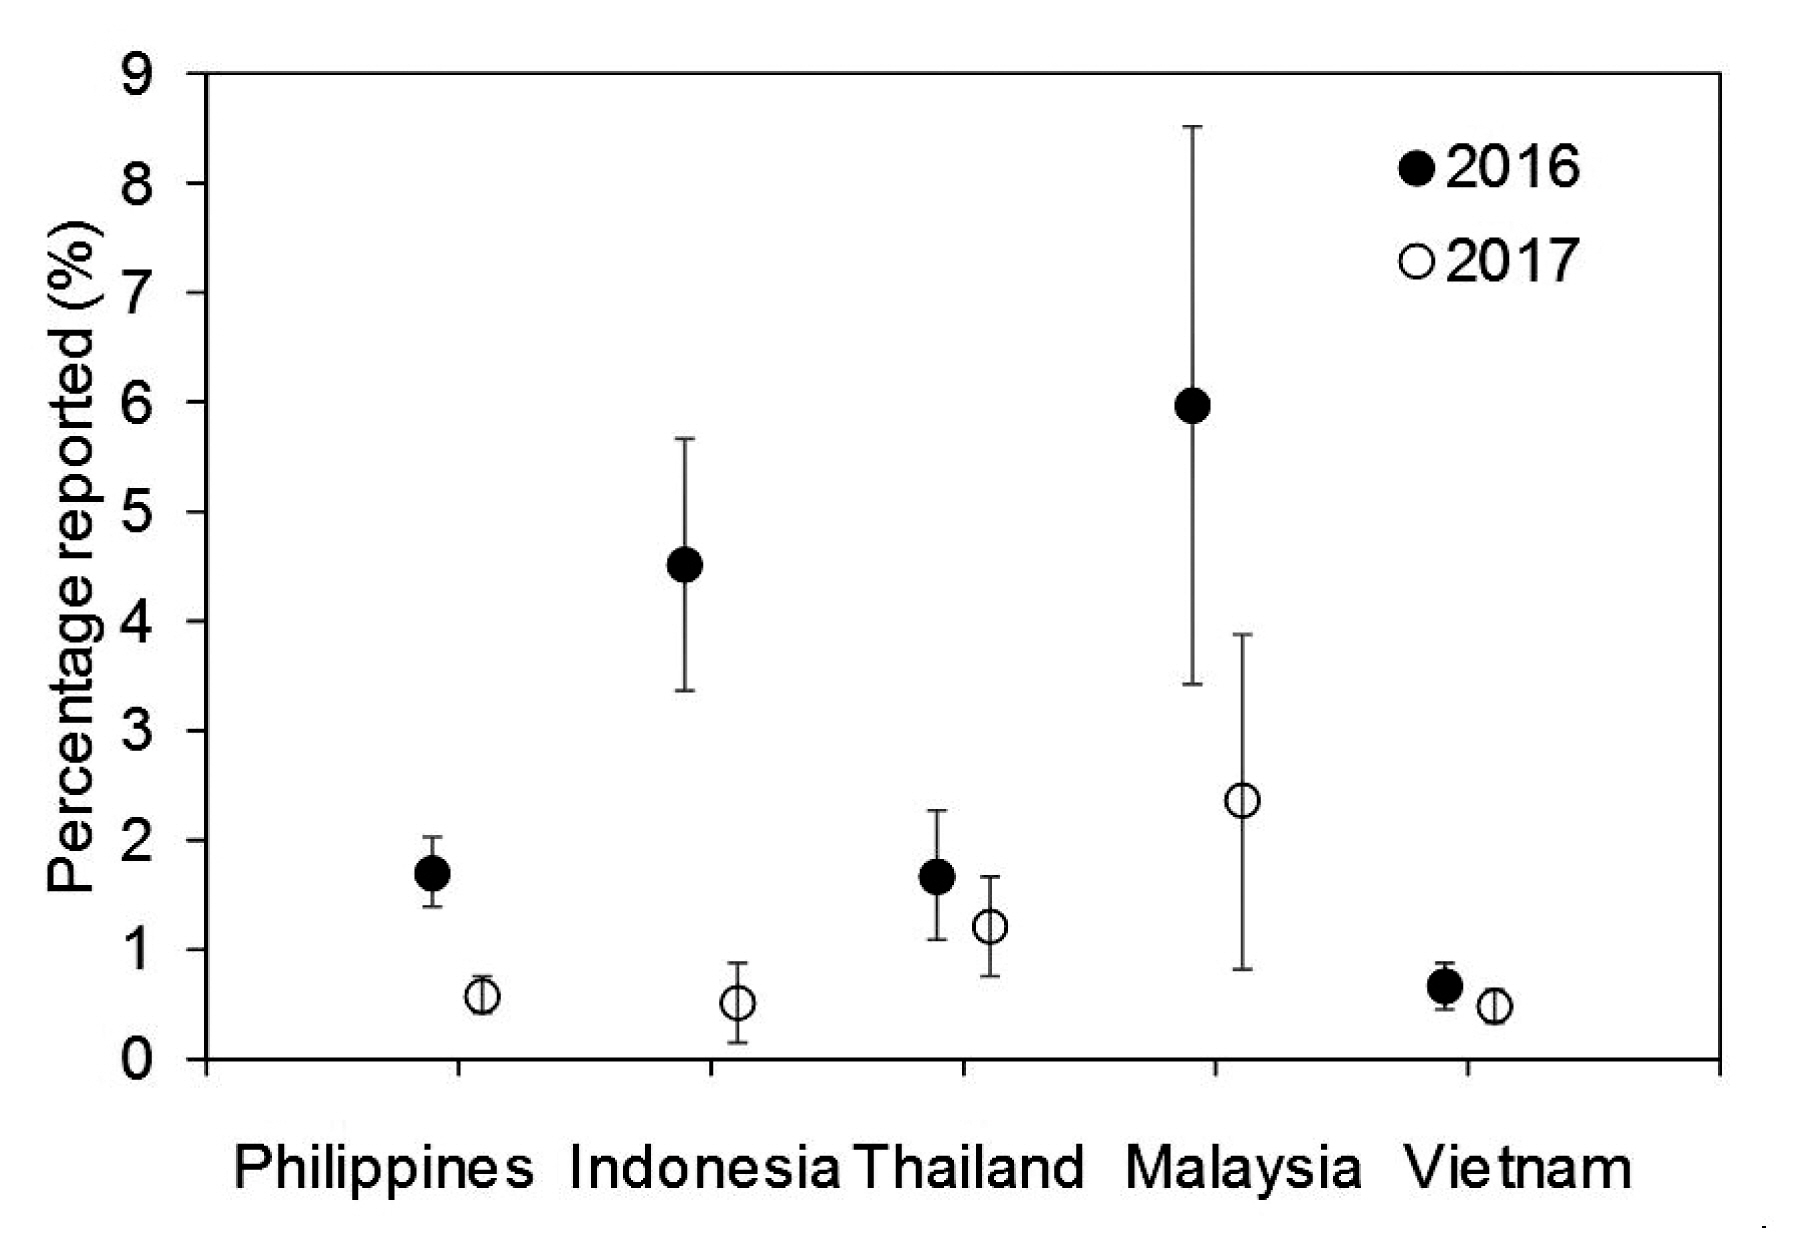
Table 1Estimated number and risk of zika virus infection among Korean travelers visiting Brazil in 2016 and the Maldives in 2017.
Figure & Data
References
Citations
Citations to this article as recorded by 
 PubReader
 ePub Link
 Cite
Cite

