
Articles
- Page Path
- HOME > Osong Public Health Res Perspect > Volume 2(2); 2011 > Article
-
Original Article
Improved HPLC Method Using 2,3-naphthalenedicarboxaldehyde as Fluorescent Labeling Agent for Quantification of Histamine in Human Immunoglobulin Preparations - Jung-Hwan Kima, In Soo Shina, Yoo Kyoung Leea, Ho Jung Ohb, Sang Ja Bana
-
Osong Public Health and Research Perspectives 2011;2(2):127-134.
DOI: https://doi.org/10.1016/j.phrp.2011.07.003
Published online: July 29, 2011
aBlood Products Teams, National Institute of Food and Drug Safety Evaluation, Osong, Korea
bBiologics Division, Korea Food and Drug Administration, Osong, Korea
- ∗Corresponding authors. kshin33@korea.krsjban@korea.kr
- ∗Corresponding authors. kshin33@korea.krsjban@korea.kr
© 2011 Published by Elsevier B.V. on behalf of Korea Centers for Disease Control and Prevention.
This is an Open Access article distributed under the terms of the Creative Commons Attribution Non-Commercial License (http://creativecommons.org/licenses/by-nc/3.0) which permits unrestricted non-commercial use, distribution, and reproduction in any medium, provided the original work is properly cited.
Abstract
-
Objectives
- To develop and optimize quantitative HPLC method using 2,3-naphthalenedicarboxaldehyde (NDA) after simple and efficient solid phase extraction to determine the histamine in a biopharmaceutical (Histobulin™).
-
Methods
- The HPLC method was established using NDA-induced Histobulin and compared with the recently reported HPLC method using o-phthaldehyde (OPA). The validated NDA-applied HPLC method was adjusted to 15 lots of Histobulin and compared by the current lot-release-test method using fluorimetry in recovery of histamine and reproducibility.
-
Results
- Analyses of six HPLC chromatograms using NDA and OPA each were compared. NDA produced a more stable chromatogram baseline than OPA, and showed better stability. The HPLC analysis was validated in accuracy (91–103%), precision (interday/intraday assay CV ≤2.30%), and linearity of dose–response curve (R2 ≥ 0.9919). The detection limit was 0.0076 μg/mL and the quantitative limit was 0.0229 μg/mL. The amount of histamine per 12 mg of immunoglobulin was determined to be 0.17 ± 0.016 μg by the HPLC and 0.025 ± 0.013 μg by the current lot-release-test method using fluorimetry.
-
Conclusion
- NDA derivatization showed better stability compared with the OPA method. Therefore the newly established NDA-derivatizated HPLC method may be more suitable than the fluorimetric method in lot-release-tests of biopharmaceuticals.
- Allergy is one of the most prevalent diseases worldwide. More than half (54.6%) of all US citizens test positive to ≥1 allergen [1], and 300 million people worldwide have asthma, with 250,000 annual deaths attributed to the disease [2]. As a therapeutic agent against allergy, histamine-fixed immunoglobulin (Ig) preparation has been used for bronchial asthma, allergic rhinitis, and atopic dermatitis [3–6].
- The histamine-fixed Ig preparation Histobulin™ (Green Cross PD, Korea) comprises 0.15 μg of histamine dihydrochloride and 12 mg of IgG. Histobulin was developed from histamine-fixed serum that was able to inhibit antigen-induced histamine release from human peripheral blood basophils and rat peritoneal mast cells [7,8]. Some scholars assumed that the histamine from the Ig induces antihistamine antibody, so as to provide resistance after allergen challenge [3].
- However, excessive administration of histamine may cause hypotension or hypertension, headaches, or anaphylactic shock syndrome [9]. Therefore the histamine content in the pharmaceutical should be controlled by regulation. Since the Ig of Histobulin is derived from human blood plasma, it is regulated by national authority as a biological that should pass the lot-release test before marketing [10]. Therefore development of a validated quantitative method for the quantification of histamine in Histobulin is very important for quality control of the drug to increase safety. Besides the safety aspect, Histobulin does not have a potency test; therefore, histamine quantification can also serve as potency test related to the efficacy of the drug.
- Analysis of histamine is mainly based on chromatographic methods such as thin-layer chromatography (TLC), capillary electrophoresis (CE), and high-performance liquid chromatography (HPLC) [11]. The current method for histamine detection of preparations in lot-release test (specification: histamine should be <0.5 μg/12 mg Ig) uses o-phthaldehyde (OPA)-derivatized histamine detection by fluorimetric method or TLC after serial solvent extraction of Histobulin. However, these analyses have low accuracy and specificity. Therefore HPLC methods have mainly been used for histamine quantification, because they provide good specificity and sensitivity when coupled with a highly sensitive detector. Whereas histamine does not have UV-visible absorbance in its chemical structure, derivatization with fluorogenic reagents is the popular way to detect it by fluorescence detector with HPLC, which can improve the detection limit compared with the current test methods for the national lot-release test mentioned above. Therefore the majority of histamine assays employ fluorometric detection with pre- or post-column derivatization [12,13] using dansyl chloride [13,14], fluorescamine [14], and OPA as labeling agents [15–17].
- Recently, a new analytical method including separation of histamine from pharmaceutical matrices using a polystyrene-divinylbenzene (PS-DVB) polymer and subsequent pre-column derivatization with OPA prior to HPLC analysis was reported [18]. However, OPA derivatization of the preparation may not have enough stability to adjust national lot-release test [19]. Therefore the aim of this study was to develop an HPLC method using the novel fluorescent derivatizing agent 2,3-naphthalenedicarboxaldehyde (NDA) and to optimize the analytical conditions, including extraction column selection and steps to improve sensitivity and reproducibility compared with OPA-derivatized histamine HPLC analysis. In addition, this study compared the current lot-release test methods, TLC and fluorimetry, with the new HPLC method for application to the national lot-release test. The HPLC method was also validated following FDA guidelines for validation of analytical assays [20].
Introduction
- 2.1 Materials and reagents
- Histamine dihydrochloride (2-[4-imidazole]ethylamine · dihydrochloride, C5H9N3 · 2HCl; FW, 184.1), 2-mercaptoethanol, 3-methyl-histamine dihydrochloride (C6H11N32H Cl; FW, 198.1), sodium hydroxide, OPA (C8H6O2; FW, 134.13), and NDA (C12H8O2; FW, 184.2) were purchased from Sigma-Aldrich Co. (St. Louis, MO, USA). HPLC-grade acetonitrile and methanol were supplied by Fisher Scientific (Fair Lawn, NJ, USA). The reagents used for HPLC mobile phase were used as HPLC grade. All chemicals and reagents of analytical grade were used without further purification. Deionized water (DIW) was obtained from a Milli-Q water purification system (Millipore, Bedford, MA, USA). The Ig pharmaceutical (Histobulin™), human gamma-Ig with histamine and matrix compositions, was provided by Green-Cross PD Co. (Oh Chang, Chung Buk Province, Korea). One vial of Histobulin™ comprises 12 mg of lyophilized human IgG (hIgG) and 0.15 μg of histamine. Other ingredients include sodium chloride (isotonic agent, 4 mg), glycine (stabilizer, 45 mg), D-mannitol (builder, 4 mg), and sodium hydroxide (pH adjuster, trace amount). The blank matrix included the same composition with the pharmaceutical except histamine. Two reverse-phase solid-phase extraction (SPE) cartridges with styrenedivinylbenzene (SDB)-coated resin, Strata SDB-L (500 mg; particle size, 83 μm; pore size, 260Å, surface area, 500 m2/g), Strata SDB-X (500 mg; particle size, 33 μm; pore size, 85Å; surface area, 800 m2/g), and one cation exchange SPE cartridge, Strata SDB-X-CW (500 mg; 3 mL; particle size, 33 μm; pore size, 85Å; surface area, 800 m2/g) were purchased from Phenomenex Co. (Torrance, CA, USA).
- 2.2 Instruments and apparatus
- The HPLC system was the Waters 2695 separation module equipped with a Waters 2475 multi-λ fluorescence detector (Milford, MA, USA) and a CH-150 column oven (Eldex Lab, CA, USA). Injected samples were separated on a Luna®phenylhexyl analytical column (5 mm; 103 A 250 × 4.6 mm i.d.; Phenomenex) preceded by a phenyl guard column (3.0 × 4.0 mm i.d.; Phenomenex). The HPLC software was DsChrom (ver. 2000 Net, Donam Inst., Seoul, Korea). Shimadzu RF-1501 spectro-fluoro-photometer (Tokyo, Japan) or Perkin Elmer LS 45 fluorescence spectroscopy (Perkin Elmer, Waltham, MA, USA) was used for fluorimetry.
- 2.3 Standards preparation
- Histobulin™ was reconstituted with 1 mL of water for injection (WFI) per vial then were added 150 μL of 3-methylhistamine · 2HCl, internal standard (IS; 1 μg/mL), and 170 μL of 1 N sodium hydroxide to adjust to pH 9.5 followed by adding DIW to make final volume 2 mL. Histamine · 2HCl was diluted to 0, 25, 50, 75, 100, and 150 ng/mL with 100 mM sodium acetate, pH 9.5, containing 150 ng of 3-methylhistamine · 2HCl as IS.
- 2.4 Solid-phase extraction and sample preparation
- Three SPE cartridges were washed with 2 mL methanol three times followed by three times of 2 mL DIW rinsing. Each concentration of standards or sample solution was loaded to rinsed SPEs by gravity. The vials of standard or sample were rinsed with 1 mL of DIW then loaded to the cartridges to bed volume (1.2 mL). The columns were washed with 2 mL of DIW three times followed by 1 mL of 40% (v/v) methanol in DIW washing three times. Then, the cartridges were eluted with 2 or 5 mL of 100 mM sodium acetate, pH 9.5, and methanol (20% v/v). The histamine-containing eluent was used for derivatization reaction.
- 2.5 Derivatization reaction
- For NDA-fluorescent labeling, 0.6 mL of extract of standard or sample was mixed with 0.2 mL borate buffer, pH 9.5, with 10% (v/v) acetonitrile, then 0.2 mL of 20 mM sodium cyanide solution was added and the mixture vortexed for 1 minute. The mixture reacted with 0.4 mL of NDA (0.3 mM in methanol) at room temperature for 4 hours because of relatively slow reaction [19,21] (Scheme 1). After the reaction, 50 μL of aliquots were injected into the HPLC system. For OPA-derivatization of histamine in the extracts, 20 mg of OPA was dissolved in 1 mL ethanol and 20 μL of 2-mercaptoethanol was added to the solution. Then, 100 mM borate buffer, pH 9.5, was added to the OPA-containing solution to make a final volume of 20 mL (OPA solution). OPA solution of 0.4 mL was added to 1.6 mL of standard or sample extracts and mixed vigorously for 30 seconds [18].
- 2.6 HPLC analysis
- HPLC separation was performed on a reversed-phase phenyl-hexyl column (4.6 × 250 mm; particle size, 5 μm; Phenomenex) kept at 40°C using a mobile phase consisting of acetonitrile–phosphate buffer (pH 6.8; 50 mM) (35:65 v/v) at flow rate 1 mL/minute for OPA and 2 mL/minute for NDA with 50 μL sample injection. Fluorescence detection was achieved for OPA and NDA at excitation maximum of 340 and 424 nm and emission maximum 450 and 484 nm, respectively. The chromatogram peak area of histamine from standard and samples to the area of internal standard was calculated to determine histamine content.
- 2.7 Fluorimetry analysis
- Fluorimetry followed a modified method of Glick et al [22]. Briefly, histamine standard solution (15 μg/mL in DIW) was diluted to 0, 0.15, 0.3, and 0.6 μg/mL with DIW. Three vials of Histobulin™ were reconstituted with 1 mL DIW, then pooled (total volume, 3 mL). After serial extraction steps with organic solvents, 2.5 mL of water layer in the bottom of the solution was collected then were added 0.14 mL 4 N hydroxide and 0.1 mL OPA (1 mg/mL in methanol) and reacted in the dark for 5 minutes. To stop the reaction 0.28 mL of 42% citric acid was added. The reactant was read by fluorescence spectroscopy at 360 nm excitation maximum and 450 nm emission maximum to determine histamine concentration in the sample from the standard dose–response curve.
Materials and Methods
- 3.1 Sample cleanup by various SPE cartridges
- The biggest difficulty encountered for histamine analysis of pharmaceuticals is the complexity of the real drug matrix and the quite low amounts of histamine to be monitored. In Histobulin, glycine is used as stabilizer, which has an amine in the molecule that can react with fluorescent materials, causing low reproducibility in the analysis. Therefore pre-column derivatization can be an effective solution not only to remove the matrix signal, but also to determine submicro amounts of histamine in the drug that affect the fluorogenic labeling reaction. Accordingly, separation of the submicro amounts of histamine (0.15 μg) from the main components, glycine (45 mg) and Ig (12 mg), which can also react with fluorogenic reagents, is critical in terms of adequate recovery prior to HPLC analysis.
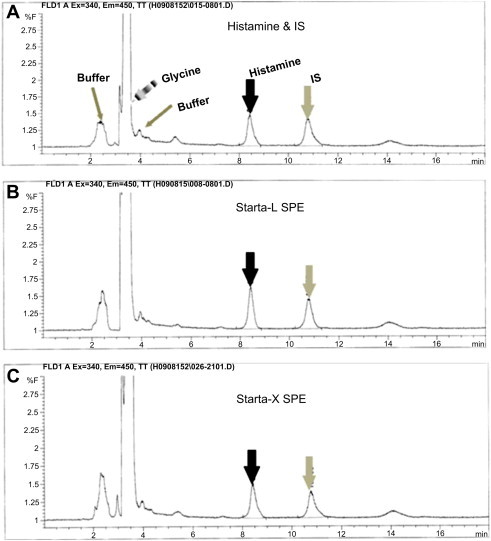
- Although many cleanup procedures can be used for isolation of biogenic amines from samples with complex matrices, the C18-bonded silica SPE cartridge has been widely used for trace enrichment of nonpolar and moderately polar solutes. Recently, Kim et al. [18] reported that SDB-L SPE was simple to use, stable in alkaline pH, and effective to separate organic compounds from hydrophilic samples; sample pH 9–10 was optimal in extraction yield (>90%). In this study, we used three types of SPE to increase recovery and decrease other matrices in the eluent, including glycine, which can be conjugated with fluorescent signal generator in the next step. SDB-L showed 73.7% recovery of histamine and 74.0% of 3-methyl-histamine as an internal standard, which was similar to a previous study [18]. Comparable results were observed when the polymeric sorbent surface-modified SDB-X extraction was used. The recovery of SDB-X to histamine and 3-methyl-histamin was determined as 74.4% and 85.9%, respectively. However, polymeric sorbent surface-modified SDB-X-CW did not show good recovery yield (data not shown). Although polymeric sorbent SDB-L and SDB-X showed similar recovery, SDB-L had a shorter extraction time. Therefore we determined that SDB-L was optimal for the separation. From the results, it was concluded that histamine interacted strongly with SDB-L sorbent and SDB-X even if they existed in free base or singly charged form between pH 9–10 according to its pK values. To increase sensitivity of histamine in HPLC analysis, the concentration of eluent was optimized. The elution volume at the histamine recovery stage was reduced from 5 to 2 mL, which was used in a previous study [18]. Comparing HPLC analyses of the extracted samples with elution volume of 2 and 5 mL, the 2-mL eluent showed more than twice the increase in sensitivity of histamine and IS in a chromatogram with OPA as the labeling agent (Table 1, Figure 1). Additional washing solution after 2 mL elution did not show any histamine peak in the chromatogram of HPLC, suggesting that our system maintained histamine recovery even though the elution volume was reduced to a minimum. Most of the Ig of large molecular size washed out during the initial washing step. Meanwhile, histamine was strongly retained in the SPE sorbent phase during the washing steps, whereas almost all histamine was eluted in small volumes (approximately 2 mL) of eluent.
- 3.2 Comparison of fluorescent labeling agents OPA with NDA in histamine derivatization
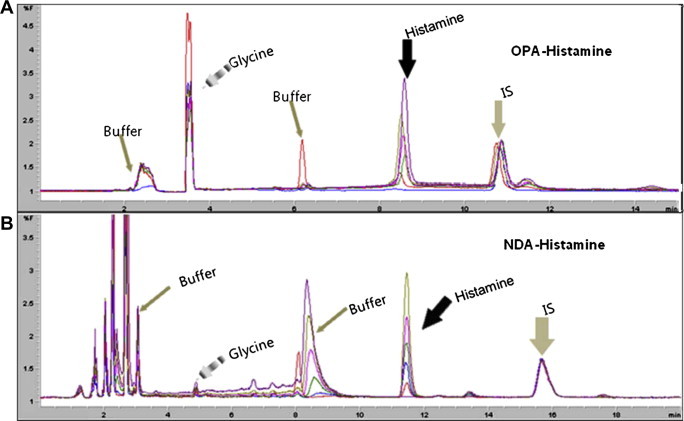
- Histamine and OPA reacted faster than NDA in the presence of 2-mercaptoethanol as co-ligand [18]. However, the stability of OPA is questionable, which might affect reproducibility of the assay [19,23]. Therefore we selected NDA as an alternative fluorescent agent; NDA produced an improved chromatogram with stable baseline and retention time within the target in our system (Figure 2), but longer reaction time was needed because of the relatively slow chemical reaction [19]. However, the longer reaction time (4 hours at room temperature) did not affect any factors in point-of-method validation, such as specificity, accuracy, and precision. The chromatogram baseline around the histamine peak, which might affect sensitivity of the analysis, was stabilized when NDA was used as a fluorescent labeling agent because of reduced byproducts formation, whereas OPA gave some byproduct peaks around the histamine peak and relatively unstable baselines during 6 samples analyses period, because of instability of OPA (Figure 2). These findings made us decide that NDA was the optimal fluorescent agent in this derivatization step.
- 3.3 HPLC analysis
- Due to the optimization of eluent concentration in the extraction step, the detection limit of histamine was lowered to 7.58 ng/mL using NDA-labeled samples on reversed-phase HPLC with isocratic elution of the mobile phase of acetonitrile–phosphate buffer (pH 6.8; 50 mM) (35:65 v/v). In the preliminary study, we compared methanol versus acetonitrile as the mobile phase with a 0.5–2 mL/minute flow rate. However, methanol and the slower flow rate gave lower sensitivity and an inapplicable detection limit (data not shown) when NDA was utilized as a fluorescent derivatizer. Therefore 35% acetonitrile with 2 mL/minute was decided to be optimal. The mean retention time of histamine was 8.80 ± 0.1 minutes for OPA-labeled histamine and 11.80 ± 0.001 minutes for NDA-labeled histamine. IS retention time for OPA– and NDA-labeled IS was 11.07 ± 0.1 and 16.70 ± 0.001 minutes, respectively, which also showed complete baseline separation with histamine in both fluorescents (Figure 2). The HPLC retention time of OPA-labeled histamine and IS was similar to that in the previous report [18].
- 3.4 Validation of HPLC analysis
- Using this optimized NDA-derivatized histamine analysis method, validation tests were performed with histamine-spiked matrix solution, including accuracy, precision, linearity, specificity, and detection limit,. The accuracy test used histamine (0.025, 0.05, 0.075, 0.10, and 0.15 μg/mL)-spiked matrix solution with 0.15 μg/mL IS. Recovery was 90–105% at each concentration; relative standard deviation (RSD) was <4.0% (Tables 2 and 3) and R2 of the dose–response curve was >0.992 (Table 4), which was comparable to the control solution with the same range of histamine-added matrix solution (R2 = 0.992; n = 3). The histamine concentration of Histobulin™ is 0.075 μg/mL. Therefore histamine in the pharmaceutical can be quantitatively determined by this dose–response curve. Day-to-day analysis for 3 days (n = 6 per day) showed good intraday and interday precision (RSD <2%) (Table 3). Therefore the accuracy, linearity, and repeatability of the analysis were validated. Using 0.075 μg/mL of IS only and histamine standard-spiked solution revealed baseline separated peaks in HPLC, suggesting that this system had good specificity. Based on the above reproducibility assessment data, detection limit and range was determined. The equation (10 × б)/S was used for quantization limit and (3.3 × б)/S for detection limit, where б is the standard deviation of intercept and S the average of the slope of the dose–response curve based on accuracy test. Quantitative limit and detection limit were determined as 0.0229 and 0.0076 μg/mL, respectively; both were in the targeted range 0.025–0.15 μg/mL. This dose–response curve can be used for quantification of histamine in pharmaceuticals.
- 3.5 Comparison of histamine content test from Histobulin™ for lot-release test
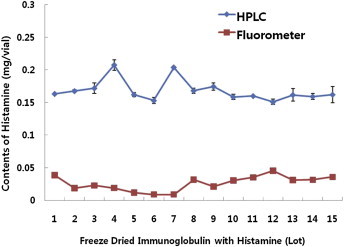
- Current lot-release test methods for Histobulin, TLC and fluorimetry were compared with HPLC analysis of histamine from Histobulin using NDA as the fluorescent agent. With 15 lots of Histobulin™ as samples, an average of 0.17 ± 0.016 μg/12 mg Ig per vial (range, 0.15–0.21 μg/vial) was determined by HPLC analysis. Meanwhile the fluorimetry method produced a result of 0.025 ± 0.013 μg/vial (range, 0.0045–0.0454 μg/vial; Figure 3). The TLC method only provided a qualitative analysis. The amount of histamine in the pharmaceutical satisfied the current specification (<0.5 μg/vial) in both analyses. However, that from the new HPLC method resulted in a slightly higher than expected amount (0.15 μg/vial). Therefore we plan to investigate the reason for this with the manufacturer of Histobulin as a further study, to set new specifications for histamine in this pharmaceutical.
- 3.6 Conclusion
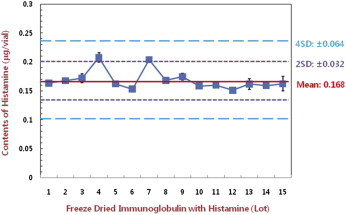
- The histamine quantification method using HPLC after pre-column extracted Ig preparation with NDA derivatization was optimized and validated. NDA utilized HPLC method for histamine quantification in the preparation may compensate current test method for histamine detection which has complicate extract steps resulting inaccurate results frequently. This method will soon be applied to the national lot-release test and the specification of histamine content in pharmaceuticals including histamine-added hIg will be set with the accumulated lot-release test based on standard deviation ranges (Figure 4).
Results and Discussion
-
Acknowledgements
- This study was conducted as 2009 R&D (No. 4032-301-210-13) of the Korea Food and Drug Administration. We specially thank Mr. Jung Seop Shin and Hyunwoo Yang for their assistance in the HPLC analysis.
Acknowledgements
-
This is an Open Access article distributed under the terms of the Creative Commons Attribution Non-Commercial License (http://creativecommons.org/licenses/by-nc/3.0) which permits unrestricted non-commercial use, distribution, and reproduction in any medium, provided the original work is properly cited.
Article information
- 1. Arbes S.J. Jr., Gergen P.J., Elliott L., Zeldin D.C.. Prevalences of positive skin test responses to 10 common allergens in the US population: results from the third National Health and Nutrition Examination Survey. J Allergy Clin Immunol 116(2). 2005 Aug;377−383. PMID: 16083793.ArticlePubMed
- 2. WHO. Global surveillance, prevention and control of chronic respiratory diseases: a comprehensive approach. 2007. World Health Organization; Geneva: Available from:. http://www.who.int/gard/publications/GARD_Manual/en/index.html.
- 3. Gushchin I.S., Luss L.V., Il’ina N.I.. [Therapeutic effectiveness of histaglobin preparations in patients with allergic rhinitis and chronic urticaria]. Ter Arkh 71(3). 1999;57−62. PMID: 10234769.
- 4. Liebhart J., Zak-Najmark T., Malolepszy J.. Changes of histaminopexy in patients with bronchial asthma and chronic urticaria after histaglobin administration. Arch Immunol Ther Exp (Warsz) 34(4). 1986;385−389. PMID: 2432849.PubMed
- 5. Paci A., Taddeucci-Brunelli G., Barachini P.. [Therapy of atopic dermatitis in children. Study on the use of a desensitizing preparation]. Pediatr Med Chir 8(6). 1986 Nov–Dec;839−844. PMID: 2440012.
- 6. Mohanty S.M., Pattnaik K.P., Swain T.R.. Prevention of multiple drug allergy by histaglobulin. Indian J Pharmacol 38(1). 2006;68−69.Article
- 7. Ishikawa T., Shimada T., Kessoku N., Kiyoi M.. Inhibition of rat mast cell degranulation and histamine release by histamine-rat gammaglobulin conjugate. Int Arch Allergy Appl Immunol 59(4). 1979;403−407. PMID: 87381.ArticlePubMed
- 8. Parrot J.L., Laborde C.. [The histamine-fixing power of blood serum; its modification after an injection of normal human serum or of an azoprotein of histamine.]. J Physiol Paris 46(1). 1954;492−495. PMID: 13192734.
- 9. Gilbert R.J., Hobbs G., Murray C.K.. Scombrotoxic fish poisoning: features of the first 50 incidents to be reported in Britain (1976–9). Br Med J 281(6232). 1980 Jul;71−72. PMID: 7190856.PubMed
- 10. KFDA. Biologics test and specification. 2005. Korea Food and Drug Administration; Seoul.
- 11. Oguri S., Yoneya Y., Mizunuma M.. Selective detection of biogenic amines using capillary electrochromatography with an on-column derivatization technique. Anal Chem 74(14). 2002 Jul;3463−3469. PMID: 12139055.ArticlePubMed
- 12. Ferreira I.M., Pinho O.. Biogenic amines in Portuguese traditional foods and wines. J Food Prot 69(9). 2006 Sep;2293−2303. PMID: 16995541.ArticlePubMed
- 13. May S., Sturman G., Perrett D.. Determination of histamine in tissues using reversed phase-HPLC with post column fluorimetric detection. Inflamm Res 48(Suppl. 1). 1999 Apr;S94−S95. PMID: 10350180.ArticlePubMed
- 14. Molins-Legua C., Campins-Falco P., Sevillano-Cabeza A.. Automated pre-column derivatization of amines in biological samples with dansyl chloride and with or without post-column chemiluminescence formation by using TCPO–H2O2. Analyst 123(12). 1998 Dec;2871−2876. PMID: 10435349.ArticlePubMed
- 15. Soleas G.J., Carey M., Goldberg D.M.. Method development and cultivar-related differences of nine biogenic amines in Ontario wines. Food Chem 64:1999;49−58.Article
- 16. Valeria FaC L.. Histamine and histidine determination in tuna fish samples using high-performance liquid chromatography. J Chromatogr A 809:1998;241−245. PMID: 9677717.ArticlePubMed
- 17. Beljaars P.R., Van Dijk R., Jonker K.M., Schout L.J.. Liquid chromatographic determination of histamine in fish, sauerkraut, and wine: interlaboratory study. J AOAC Int 81:1999;991−998. PMID: 9772741.Article
- 18. Kim N.H., Park Y., Jeong E.S.. A liquid chromatographic method for the determination of histamine in immunoglobulin preparation using solid phase extraction and pre-column derivatization. Arch Pharm Res 30(10). 2007 Oct;1350−1357. PMID: 18038915.ArticlePubMed
- 19. Oguri S., Mizusawa A., Kamada M., Kohori M.. A new method of histamine colorimetry using 2,3-naphthalenedicarboxaldehyde on a silica-gel column cartridge. Anal Chim Acta 558(1–2). 2006;326−331.Article
- 20. FDA. Analytical procedures and methods validation. 2000. FDA Guidance for Industry; Rockville, MD, USA: Available from:. http://www.fda.gov/downloads/Drugs/GuidanceComplianceRegulatoryInformation/Guidances/ucm122858.pdf.
- 21. Oguri S., Enami M., Soga N.. Selective analysis of histamine in food by means of solid-phase extraction cleanup and chromatographic separation. J Chromatogr A 1139(1). 2007 Jan;70−74. PMID: 17097671.ArticlePubMed
- 22. von Redlich D., Glick D.. Studies in histochemistry: LXXVI. Fluorometric determination of histamine in microgram samples of tissue or microliter volumes of body fluids. Anal Biochem 10(3). 1965;459−467.Article
- 23. Zhang L.Y., Sun M.X.. Determination of histamine and histidine by capillary zone electrophoresis with pre-column naphthalene-2,3-dicarboxaldehyde derivatization and fluorescence detection. J Chromatogr A 1040(1). 2004 Jun;133−140. PMID: 15248433.Article
References

| Extraction volume | Recovery (%) | Histamine area | IS area |
|---|---|---|---|
| 2 mL | 111.72–112.92 | 19.12–20.16 | 29.63–30.88 |
| 5 mL | 108.63–115.92 | 9.69–10.60 | 14.45–14.54 |
Figure & Data
References
Citations
- DNAzyme-based and smartphone-assisted colorimetric biosensor for ultrasensitive and highly selective detection of histamine in meats
Junjun Wang, Yue Tang, Jia Zheng, Zhengmin Xie, Jianli Zhou, Yuangen Wu
Food Chemistry.2024; 435: 137526. CrossRef - Effects of the immunoglobulin/histamine complex on panic disorder concurrent with chronic spontaneous urticaria: a case report
Hyuk Soon Kim, Geunwoong Noh
Journal of Medical Case Reports.2023;[Epub] CrossRef - Rapid detection of histamine in fish based on the fluorescence characteristics of carbon nitride
Xiaobin Lin, Chengyi Hong, Zhengzhong Lin, Zhiyong Huang
Journal of Food Composition and Analysis.2022; 112: 104659. CrossRef - Immunotherapy using Histobulin™ in psoriasis: A case report
Hyuk Soon Kim, Geunwoong Noh
Clinical Case Reports.2022;[Epub] CrossRef - Histobulin as a complementary but essential therapeutic for Intravenous Immune Globulin Therapy of Pfeiffer‐Weber‐Christian disease with multiple allergic diseases and its effects on allergic disease: A case report
Geunwoong Noh
Clinical Case Reports.2021; 9(2): 966. CrossRef - Immunotherapy using Histobulin in atopic dermatitis
Geunwoong Noh
Clinical Case Reports.2021; 9(1): 113. CrossRef - Colorimetric sensing of histamine in aqueous solution by a system composed of alizarin complexone and Ni2+ complex via indicator displacement approach
Yasumasa Fukushima, Shunichi Aikawa
Tetrahedron Letters.2021; 72: 153088. CrossRef - Induction of remission in chronic urticaria by immunotherapy using immunoglobulin/histamine complex (Histobulin™): a case report
Hyuk Soon Kim, Geunwoong Noh
Allergy, Asthma & Clinical Immunology.2021;[Epub] CrossRef - Motion sickness-relieving effects of Tamzin, a herbal formulation: In vitro and in vivo studies
N. Ilaiyaraja, Dongzagin Singsit, Mahantesh M Patil, S. Priyadharshini, V. Rashmi, Farhath Khanum
Food Bioscience.2020; 35: 100595. CrossRef - Trends in the Analysis of Biopharmaceuticals by HPLC
Angela Tartaglia, Marcello Locatelli, Victoria Samanidou
Current Analytical Chemistry.2020; 16(1): 52. CrossRef - Validation of HPLC Method for Determination of Histamine in Human Immunoglobulin Formulations
Michikazu Tanio, Toru Nakamura, Hideki Kusunoki, Kyohei Ideguchi, Kazuyuki Nakashima, Isao Hamaguchi
Journal of AOAC INTERNATIONAL.2020; 103(5): 1223. CrossRef - 4-Methoxy-ortho-phthalaldehyde: a promising derivatizing agent for the fluorimetric evaluation of histamine in seafood
Clémence Moitessier, Khémesse Kital, Pierre-Edouard Danjou, Francine Cazier-Dennin
Talanta Open.2020; 2: 100014. CrossRef - A novel biomimetic immunoassay method based on Pt nanozyme and molecularly imprinted polymer for the detection of histamine in foods
Xiaofeng Wang, Xiaoqing Song, Lin Si, Longhua Xu, Zhixiang Xu
Food and Agricultural Immunology.2020; 31(1): 1036. CrossRef - Development of a Rapid and Eco-Friendly UHPLC Analytical Method for the Detection of Histamine in Fish Products
Antonello Cicero, Francesco Giuseppe Galluzzo, Gaetano Cammilleri, Andrea Pulvirenti, Giuseppe Giangrosso, Andrea Macaluso, Antonio Vella, Vincenzo Ferrantelli
International Journal of Environmental Research an.2020; 17(20): 7453. CrossRef - Silver nanoparticles decorated graphene nanoribbon modified pyrolytic graphite sensor for determination of histamine
Neeraj Kumar, Rajendra N. Goyal
Sensors and Actuators B: Chemical.2018; 268: 383. CrossRef - Amperometric Biosensor Based on Diamine Oxidase/Platinum Nanoparticles/Graphene/Chitosan Modified Screen-Printed Carbon Electrode for Histamine Detection
Irina Apetrei, Constantin Apetrei
Sensors.2016; 16(4): 422. CrossRef - Comparison of Methods for Measuring Histamine by ELISA and HPLC-MS Assay In Vitro
In Hee Lee, Yoo Hyun Kim
Korean Journal of Clinical Laboratory Science.2015; 47(4): 306. CrossRef - UPLC versus HPLC on Drug Analysis: Advantageous, Applications and Their Validation Parameters
Mehmet Gumustas, Sevinc Kurbanoglu, Bengi Uslu, Sibel A. Ozkan
Chromatographia.2013; 76(21-22): 1365. CrossRef
 PubReader
 Cite
Cite


