
Articles
- Page Path
- HOME > Osong Public Health Res Perspect > Volume 5(2); 2014 > Article
-
Original Article
Under-reporting of Energy Intake from 24-hour Dietary Recalls in the Korean National Health and Nutrition Examination Survey - Seunghee Kyea, Sung-Ok Kwonb, Soon-Young Leea, Jiyoon Leec, Bok Hee Kimd, Hee-Jae Suhe, Hyun-Kyung Moonf
-
Osong Public Health and Research Perspectives 2014;5(2):85-91.
DOI: https://doi.org/10.1016/j.phrp.2014.02.002
Published online: February 28, 2014
aDepartment of Preventive Medicine and Public Health, School of Medicine, Ajou University, Suwon, Korea
bDepartment of Food and Nutrition, Kyunghee University, Seoul, Korea
cSchool of Journalism and Mass Communication, University of Minnesota, MN, USA
dDepartment of Food and Nutrition, Chosun University, Gwangju, Korea
eDepartment of Food Science, Sunmoon University, Asan, Korea
fDepartment of Food and Nutrition, Dankook University, Yongin, Korea
- ∗Corresponding author. moonhk52@dankook.ac.kr
- 1These authors contributed equally to this work.
© 2014 Published by Elsevier B.V. on behalf of Korea Centers for Disease Control and Prevention.
This is an Open Access article distributed under the terms of the Creative Commons Attribution Non-Commercial License (http://creativecommons.org/licenses/by-nc/3.0) which permits unrestricted non-commercial use, distribution, and reproduction in any medium, provided the original work is properly cited.
Abstract
-
Objectives
- Chronic degenerative diseases are closely related to daily eating habits, nutritional status, and, in particular, energy intake. In clarifying these relationships it is very important for dietary surveys to report accurate information about energy intake. This study attempted to identify the prevalence of the under-reporting of energy intake and its related characteristics based on the Korean National Health and Nutrition Examination Survey conducted in the years 2007–2009.
-
Methods
- The present study analyzed dietary intake data from 15,133 adults aged ≥19 years using 24-hour dietary recalls. Basal metabolic rates were calculated from the age- and gender-specific equations of Schofield and under-reporting was defined as an energy intake <0.9, represented by the ratio of energy intake to estimated basal metabolic rate.
-
Results
- Under-reporters (URs) accounted for 14.4% of men and 23.0% of women and the under-reporting rate was higher in the age group 30–49 years for both men and women. The results from an analysis of the age-specific socioeconomic characteristics of participants classified as URs showed that under-reporting was high in women living alone and in women with only elementary school education or no education. The results from an analysis of the health-specific characteristics of URs showed that a large proportion of URs had poor self-rated health or were obese, or both, compared with non-URs. The proportion of participants who consumed less than the estimated average requirements for nutrients was significantly higher in URs compared with non-URs.
-
Conclusion
- The under-reporting of energy intake was associated with age, gender, education level, income level, household status (single-person or multi-person), self-rated health, physical activity, and obesity.
- It is very important to assess dietary intake accurately in nutrition surveys. Many studies have pointed out the under-reporting of energy intake from dietary surveys [1–8]. As the importance of a proper calorie intake has recently been emphasized, especially in association with chronic diseases, it has become very important to assess energy intake accurately. Overweight and obesity have been reported as major factors influencing under-reporting [3–7]. There have been reports demonstrating that under-reporting is common in elderly people and women [2–4,6] and that it is associated with socioeconomic and psychological characteristics [3–7]. However, no clear conclusion has yet been reached. Most nutrition surveys or epidemiological studies investigating dietary intake have methodological limitations related to misreporting and measurement errors [8–11].
- In general, under-reporting is less likely in 24-hour dietary recalls than in self-reporting surveys in which participants are asked to record their own food intake [12,13]. However, it is difficult to determine whether under-reporting is a result of the misreporting of the kinds and amounts of food consumed, or from other factors influencing the participants' actual food intake. The National Health and Nutrition Examination Survey (NHANES), which is conducted in Korea based on the National Health Promotion Act, provides critical data for monitoring the health and nutritional status of Korean populations. These data can be used to aid in selecting populations vulnerable to health problems. These populations should be given priority consideration in related policies and in developing new policies by evaluating whether the current health nutrition policies and programs are being effectively implemented.
- Based on data from NHANES, this study attempted to analyze the prevalence of under-reporting of energy intake by age and to identify the socioeconomic characteristics and risk factors relating to health that influence such under-reporting.
Introduction
- 2.1 Study population and data sets
- In Korea, NHANES is conducted nationwide to assess the health status, disease prevalence, and nutrient intake of Korean people and consists of questionnaires, physical examinations, and health interviews. This study attempted to identify the prevalence of under-reporting and its related characteristics based on the NHANESs carried out in the period 2007–2009. This study analyzed daily dietary intake data from 15,133 men and women aged ≥19 years using 24-hour dietary recalls. The study referred to basic interviews for socioeconomic information on the participants and health questionnaires for their age, smoking status, alcohol consumption, health, and physical activity. Physical examinations were used to determine anthropometric data. Participants were classified into four levels of education: elementary school or no education; middle school graduate; high school graduate; and college graduate or higher. They were also stratified into quartiles according to household income level: lowest; medium–low; medium–high; and highest. On the basis of their body mass index, their weight was classified as underweight (<18.5 kg/m2), normal (18.5–25.0 kg/m2), and obese (≥25.0 kg/m2). Walking exercise was defined as walking for ≥30 minutes at a time at least five times per week, either indoors or outdoors. Physical activity was defined as moderate exercise for ≥30 minutes at a time at least five times per week, or as vigorous exercise for ≥20 minutes at a time at least three times per week.
- 2.2 Estimation of energy requirements
- The under-reporting of energy intake was evaluated by determining the ratio of reported energy intake to estimated basal metabolic rate, or EI:BMRest. The basal metabolic rate was estimated from the age- and gender-specific equations proposed by Schofield [14]. A cutoff value of 0.9 was used to define the under-reporting of energy intake in terms of the EI:BMRest ratio [15]. The participants were divided between under-reporters (URs) (<0.9) and non-under-reporters (non-URs) (≥0.9).
- 2.3 Statistical analysis
- All statistical analyses were conducted using SAS version 9.2 (SAS Institute, Cary, NC, USA). The statistics presented included the distributions (%) of sociodemographic and health-related variables for URs and non-URs and the means and standard deviations of nutrient and food group intakes. A Chi-square test was used to verify the differences in distributions of categorical variables by UR status (i.e., sociodemographic and health-related variables) and a t test was used to test for the difference in means of a continuous variable (i.e., food group intake).
Materials and methods
- Table 1 shows the rates of under-reporting by gender and age. Under-reporting was higher in women (23.0%) than in men (14.4%) and higher in the age group 30–49 years for both men and women.
- Table 2 shows the results from our analysis of indicators that represent the household status, education level, and income level of URs and non-URs. Odd ratios were used to estimate the probability for under-reporting. Under-reporting was high in women living alone. Under-reporting by final education level was higher in men with a high school diploma and in women with elementary school education or no education. Both men and women showed the highest under-reporting rate at the lowest income level.
- The percentage of individuals classified as obese (body mass index ≥25) was higher in URs than in non-URs (42.2% vs. 33.1% for men; 37.9% vs. 27.0% for women) and in those who reported poor or very poor self-rated health (25.6% vs. 19.2% for men; 34.7% vs. 27.0% for women; Table 3). As shown in Table 4, higher odds ratios were found for individuals who were classified as obese and who reported poor or very poor self-rated health. This indicates that obesity and poor health influenced under-reporting. Current women smokers were associated with higher under-reporting, as indicated by the odds ratio (1.29 for smoking vs. 1.0 for nonsmoking; Table 4).
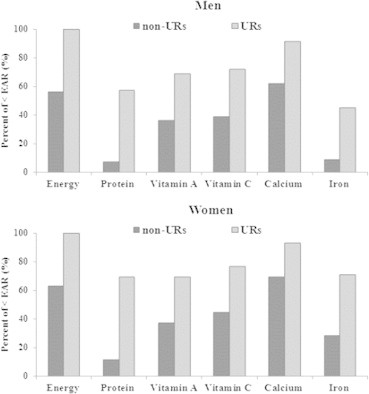
- Figure 1 shows the proportions of participants who did not meet the estimated average requirements for nutrients by gender and UR status. For every nutrient, the proportion of participants who consumed less than the estimated average requirement was significantly higher in URs than in non-URs.
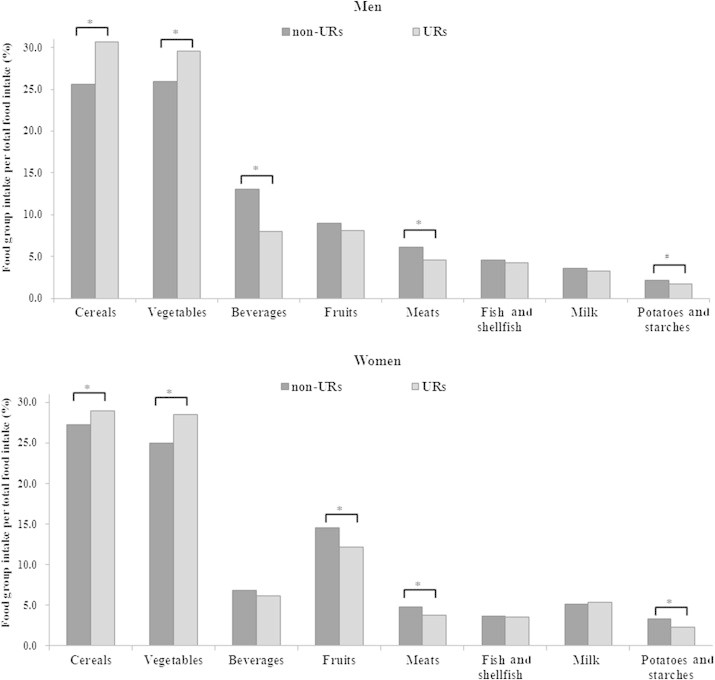
- Figure 2 shows food group intakes expressed as percentages of the total food intake. Food groups whose intake accounted for a high percentage of the total food intake in URs compared with non-URs included cereals, vegetables, and seaweeds. Food groups consumed at a lower percentage were potatoes and starches, sugars and sweeteners (for men), nuts, mushrooms, fruits, meats, fish and shellfish, oil and fats, and beverages.
Results
- In a national survey, it is meaningful to identify under-reporting population groups and to determine the socioeconomic characteristics and health indicators that help to predict under-reporting. The prevalence of obesity is increasing, especially in Korea, but the total energy intake is tending to decrease. There is a need to determine whether there is under-reporting of energy intake and other nutrients.
- Previous studies showed that the under-reporting of energy intake is more common among obese or overweight people than among those of normal weight [3–7]. This study also found a higher under-reporting rate in participants who were obese.
- Likewise, age was reported as a strong independent predictor of under-reporting [8]. In this study, the age groups 19–29 years for men and ≥65 years for women were associated with higher under-reporting in URs compared with non-URs. When the under-reporting status of overweight or obese people was compared by age (data not shown), under-reporting was found to be high in all age groups for women in the age group and in the 19–29 year and 30–49 year age groups for men (data not shown). These findings confirmed the association between under-reporting and obesity indicators. It has been reported that there is a tendency for under-reporting in women and older people. This study also found that women tended to under-report their energy intake more than men, but as middle-aged people (aged 30–49 years) displayed higher under-reporting than older people, we could not clarify the association between age and under-reporting.
- Although a low level of household income is known to be associated with a poorer quality diet, Garriguet [1] reported in his analysis of data from the Canadian Community Health Survey that there was no association between household income and under-reporting of energy intake. This study found a high proportion of under-reporters in the lowest income level. From this finding, it can be inferred that a low income led to a decreased food intake by affecting food purchasing power. This may cause dissatisfaction in the quality and quantity of the diet, but further analyses are needed to clarify the correlations.
- The study results indicate that the proportion of women who completed elementary school education or no education is higher in URs than in non-URs. This is consistent with a previous report showing that an education level lower than middle school is associated with under-reporting [1].
- The analysis of data on self-rated health status in this study showed that a larger portion of URs than non-URs reported their self-rated health as poor or very poor. From the finding, it can be inferred that poor self-rated health is associated with an under-reporting of energy intake by reducing appetite and affecting food intake, but this is not clear.
- It has been reported that a great deal of energy intake under-reporting is usually attributable to the under-reporting of unhealthy and energy-dense foods such as sugars, fats, sweets, and sugar-containing desserts [1]. This issue needs to be analyzed in depth in future Korean NHANESs.
Discussion
- All contributing authors declare no conflicts of interest.
Conflicts of interest
-
This is an Open Access article distributed under the terms of the Creative Commons Attribution Non-Commercial License (http://creativecommons.org/licenses/by-nc/3.0) which permits unrestricted non-commercial use, distribution, and reproduction in any medium, provided the original work is properly cited.
Article information
- 1. Garriquet D.. Under-reporting of energy intake in the Canadian Community Health Survey. Health Rep 19(4). 2008 Dec;37−45.
- 2. Jonnalagadda S., Mitchell D.C., Smiciklas-Wright H.. Accuracy of energy intake data estimated by a multipass 24-hour dietary recall technique. J Am Diet Assoc 100(3). 2000 Mar;303−308. PMID: 10719403.ArticlePubMed
- 3. Johansson G., Wikman A., Ahren A.M.. Under-reporting of energy intake in repeated 24-hour recalls related to gender, age, weight status, day of interview, educational level, reported food intake, smoking habits and area of living. Public Health Nutr 4(4). 2001 Aug;919−927. PMID: 11527517.ArticlePubMed
- 4. Pikholz C., Swinburn B., Metcalf P.. Under-reporting of energy intake in the 1997 National Nutrition Survey. N Z Med J 117(1202). 2004 Sep;1−11.
- 5. Tooze J.A., Subar A.F., Thompson F.E.. Psychosocial predictors of energy under-reporting in a large doubly labeled water study. Am J Clin Nutr 79(5). 2004 May;795−804. PMID: 15113717.ArticlePubMed
- 6. Livingstone B.E., Black A.E.. Markers of the validity of reported energy intake. J Nutr 133(Suppl. 3). 2003 Mar;895S−920S. PMID: 12612176.ArticlePubMed
- 7. Johnson R.K., Soultanakis R.P., Matthews D.E.. Literacy and body fatness are associated with under-reporting of energy intake in US low income women using the multiple-pass 24-hour recall, a doubly labelled water study. J Am Diet Assoc 98(10). 1998 Oct;1136−1140. PMID: 9787719.ArticlePubMed
- 8. Briefel R.R., Sempos C.T., McDowell M.A.. Dietary methods research in the third National Health and Nutrition Examination Survey: underreporting of energy intake. Am J Clin Nutr 65(Suppl. 4). 1997 Apr;1203S−1209S. PMID: 9094923.ArticlePubMed
- 9. Kipnis V., Subar A.F., Midthune D.. Structure of dietary measurement error: results of the OPEN biomarker study. Am J Epidemiol 158(1). 2003 Jul;14−21. PMID: 12835281.ArticlePubMed
- 10. Subar A.F., Kipnis V., Troiano R.P.. Using intake biomarkers to evaluate the extent of dietary misreporting in a large sample of adults: the OPEN study. Am J Epidemiol 158(1). 2003 Jun;1−13. PMID: 12835280.ArticlePubMed
- 11. Trabulsi J., Schoeller D.A.. Evaluation of dietary assessment instruments against doubly labeled water, a biomarker of habitual energy intake. Am J Physiol Endocrinol Metab 281(5). 2001 Nov;891−899.Article
- 12. Johnson R.K., Driscoll P., Goran M.I.. Comparison of multiple-pass 24-hour recall estimates of energy intake with total energy expenditure determined by the doubly labeled water method in young children. J Am Diet Assoc 96(1). 1996 Nov;1140−1144. PMID: 8906138.ArticlePubMed
- 13. Jonnalagadda S.S., Mitchell D.C., Smiciklas-Wright H.. Underestimation of energy intake: comparison of self-reported and actual intake. Exp Biol 10(3). 1996;a724.
- 14. Schofield W.N.. Predicting basal metabolic rate, new standards and review of previous work. Hum Nutr Clin Nutr 39(Suppl. 1). 1985;5−41. PMID: 4044297.PubMed
- 15. Goldberg G.R., Black A.E., Jebb S.A.. Critical evaluation of energy intake data using fundamental principles of energy physiology: 1. Derivation of cut-off limits to identify under-recording. Eur J Clin Nutr 45(12). 1991 Dec;569−581. PMID: 1810719.PubMed
References
|
Men (n = 6029) |
Women (n = 9104) |
|||||
|---|---|---|---|---|---|---|
| Non-URs (n = 5158) | URs (n = 871) | pa | Non-URs (n = 7010) | URs (n = 2094) | pa | |
| EI:BMRest | 1.49 ± 0.48 | 0.72 ± 0.15 | <0.0001 | 1.41 ± 0.42 | 0.69 ± 0.16 | <0.0001 |
| Living alone | 4.8 | 6.2 | 0.077 | 8.6 | 12.7 | <0.0001 |
| Education | ||||||
| Elementary school or less | 22.5 | 22.1 | 0.008 | 34.1 | 40.8 | <0.0001 |
| Middle school | 13.1 | 13.9 | 10.3 | 10.7 | ||
| High school | 35.3 | 40.0 | 32.2 | 33.2 | ||
| College or higher | 29.2 | 24.0 | 23.5 | 15.4 | ||
| Income | ||||||
| Lowest | 24.0 | 32.0 | <0.0001 | 23.1 | 29.9 | <0.0001 |
| Medium–low | 25.3 | 22.2 | 25.0 | 24.9 | ||
| Medium–high | 25.1 | 22.7 | 26.1 | 23.0 | ||
| Highest | 25.6 | 23.1 | 25.9 | 22.2 | ||
|
Men (n = 6029) |
Women (n = 9104) |
|||||
|---|---|---|---|---|---|---|
| Non-URs (n = 5158) | URs (n = 871) | pa | Non-URs (n = 7010) | URs (n = 2094) | pa | |
| BMI ≥25.0 kg/m2 | 33.1 | 42.2 | <0.0001 | 27.0 | 37.9 | <0.0001 |
| Current smoker | 78.4 | 77.9 | 0.746 | 8.8 | 12.1 | <0.0001 |
| Alcohol consumer | 71.3 | 68.4 | 0.079 | 37.4 | 36.8 | 0.624 |
| Self-rated health | ||||||
| Very good/good | 45.4 | 39.5 | <0.0001 | 37.1 | 32.5 | <0.0001 |
| Fair | 35.4 | 34.9 | 35.9 | 32.8 | ||
| Very poor/poor | 19.2 | 25.6 | 27.0 | 34.7 | ||
| Change of body weight in the past year | ||||||
| No change | 68.7 | 61.5 | <0.0001 | 65.7 | 60.7 | 0.000 |
| Weight loss | 16.5 | 18.0 | 13.8 | 16.1 | ||
| Weight gain | 14.8 | 20.5 | 20.5 | 23.2 | ||
| Physical activityb | ||||||
| Walking | 50.1 | 47.2 | 0.123 | 44.3 | 43.4 | 0.509 |
| Moderate | 15.4 | 12.3 | 0.019 | 14.3 | 13.6 | 0.411 |
| Vigorous | 19.7 | 16.2 | 0.014 | 13.7 | 13.2 | 0.595 |
b Walking exercise was defined as walking for ≥30 minutes at a time at least five times per week, either indoors or outdoors. Physical activity was defined as moderate exercise for ≥30 minutes at a time at least five times per week, or in vigorous exercise for ≥20 minutes at a time at least three times per week.
Figure & Data
References
Citations
- Time Trends in Income-related Differences in Food Group Intakes: The National Health and Nutrition Survey, Japan in 2010, 2014, and 2018
Ryoko Tajima, Mai Matsumoto, Aya Fujiwara, Xiaoyi Yuan, Chisa Shinsugi, Emiko Okada, Kayo Kurotani, Tetsuji Yokoyama, Hidemi Takimoto
Journal of Epidemiology.2024; 34(2): 76. CrossRef - Eating patterns in Korean adults, 1998–2018: increased energy contribution of ultra-processed foods in main meals and snacks
Sukyoung Jung, Jee Young Kim, Sohyun Park
European Journal of Nutrition.2024; 63(1): 279. CrossRef - Variation in ultra‐processed food consumption from 6 to 15 years, body weight and body composition at 15 years of age at The Pelotas 2004 Birth Cohort
Iná S. Santos, Isabel O. Bierhals, Caroline S. Costa, Alicia Matijasevich, Luciana Tovo‐Rodrigues
Pediatric Obesity.2024;[Epub] CrossRef - The impact of long working hours on daily sodium intake
Kyungho Ju, Yangwoo Kim, Seung Hee Woo, Juhyeong Kim, Inah Kim, Jaechul Song, Soo-Jin Lee, Jeehee Min
Annals of Occupational and Environmental Medicine.2024;[Epub] CrossRef - Effectiveness of a Smartphone Application for Dietary Sodium Intake Measurement
Chan-Young Jung, Youngin Kim, Hyung Woo Kim, Seung Hyeok Han, Tae-Hyun Yoo, Shin-Wook Kang, Jung Tak Park
Nutrients.2023; 15(16): 3590. CrossRef - Trends in intake and sources of dietary protein in Korean adults, 1998–2018
Kyung Won Lee, Dayeon Shin
British Journal of Nutrition.2022; 128(8): 1595. CrossRef - Utilising a Real-Time Continuous Glucose Monitor as Part of a Low Glycaemic Index and Load Diet and Determining Its Effect on Improving Dietary Intake, Body Composition and Metabolic Parameters of Overweight and Obese Young Adults: A Randomised Controlled
Khadidja Chekima, Mohd Ismail Noor, Yasmin Beng Houi Ooi, See Wan Yan, Mohammad Jaweed, Brahim Chekima
Foods.2022; 11(12): 1754. CrossRef - Does Mexico have the agricultural land resources to feed its population with a healthy and sustainable diet?
María-José Ibarrola-Rivas, Mishel Unar-Munguia, Thomas Kastner, Sanderine Nonhebel
Sustainable Production and Consumption.2022; 34: 371. CrossRef - Underreporting of energy intake is not associated with the reported consumption of NOVA‐classified food groups in socially vulnerable women
Brida Maria C. Santos, Dafiny R. S. Praxedes, André Eduardo Silva‐Junior, Mateus de Lima Macena, Telma Maria de Menezes Toledo Florêncio, Nassib Bezerra Bueno
Nutrition Bulletin.2022; 47(4): 461. CrossRef - Comparison of commonly used dietary assessment methods in individuals without obesity
Busra Baspinar, Ayşe Özfer Özçelik
Nutrition & Food Science .2021; 51(3): 560. CrossRef - Identification of psychological correlates of dietary misreporting under laboratory and free-living environments
Mark Hopkins, Joanna Michalowska, Stephen Whybrow, Graham W. Horgan, R. James Stubbs
British Journal of Nutrition.2021; 126(2): 264. CrossRef - Micronutrient status and associated factors of adiposity in primary school children with normal and high body fat in Colombo municipal area, Sri Lanka
Kalaichelvi Thillan, Pulani Lanerolle, Tharanga Thoradeniya, Dulani Samaranayake, Rohana Chandrajith, Pujitha Wickramasinghe
BMC Pediatrics.2021;[Epub] CrossRef - Association between energy intake under‐reporting and previous professional nutritional counselling in low‐income women with obesity: A cross‐sectional study
Dafiny Rodrigues Silva Praxedes, Isabele Rejane Oliveira Maranhão Pureza, Laís Gomes Lessa Vasconcelos, André Eduardo da Silva Júnior, Mateus de Lima Macena, Telma Maria de Menezes Toledo Florêncio, Ingrid Sofia Vieira de Melo, Nassib Bezerra Bueno
Nutrition Bulletin.2021; 46(3): 310. CrossRef - A short education session increases the accuracy of estimated food records in young Korean women during a controlled-feeding study
Seunghee Kim, Bora Lee, Clara Yongjoo Park
Nutrition Research and Practice.2021; 15(5): 613. CrossRef - Using Dietary Macronutrient Patterns to Predict Sarcopenic Obesity in Older Adults: A Representative Korean Nationwide Population-Based Study
Jun-Hyuk Lee, Hye-Min Park, Yong-Jae Lee
Nutrients.2021; 13(11): 4031. CrossRef - Macronutrient Intake in Adults Diagnosed with Metabolic Syndrome: Using the Health Examinee (HEXA) Cohort
Hyerim Park, Anthony Kityo, Yeonjin Kim, Sang-Ah Lee
Nutrients.2021; 13(12): 4457. CrossRef - Characterizing energy intake misreporting and its effects on intake estimations, in the Portuguese adult population
Vânia Magalhães, Milton Severo, Duarte Torres, Elisabete Ramos, Carla Lopes
Public Health Nutrition.2020; 23(6): 1031. CrossRef - Diet quality in adolescents with premenstrual syndrome: A cross‐sectional study
Kubra Isgin‐Atici, Nuray Kanbur, Sinem Akgül, Zehra Buyuktuncer
Nutrition & Dietetics.2020; 77(3): 351. CrossRef - Development, validation and reliability of the Chrononutrition Profile - Questionnaire
Allison C. Veronda, Kelly C. Allison, Ross D. Crosby, Leah A. Irish
Chronobiology International.2020; 37(3): 375. CrossRef - Dietary patterns associated with obesity and overweight: When should misreporters be included in analysis?
Anna M. Malinowska, Monika A. Mlodzik-Czyzewska, Agata Chmurzynska
Nutrition.2020; 70: 110605. CrossRef - Low Compliance with Dietary Recommendations among Older Workers in Southern Thailand
Sarunya Maneeratta, Chamnong Thanapop, Sasithorn Thanapop
Pakistan Journal of Nutrition.2020; 19(7): 352. CrossRef - Underreporting of Dietary Intake: Key Issues for Weight Management Clinicians
Susan Connor
Current Cardiovascular Risk Reports.2020;[Epub] CrossRef - COMPARISON BETWEEN 2 DIFFERENT DIETARY INTAKE METHODS (7-DAY DIETARY WEIGHT RECORDS AND 24-HOUR DIETARY RECALL) AND DUPLICATE DIET METHOD RESULTS WITH REFERENCE NUTRIENT INTAKE (RNI)
Mohammed Raoof
JOURNAL OF SULAIMANI MEDICAL COLLEGE.2020; 10(3): 315. CrossRef - Prevalence and determinants of misreporting of energy intake among Latin American populations: results from ELANS study
Agatha Nogueira Previdelli, Georgina Gómez, Irina Kovalskys, Mauro Fisberg, Lilia Yadira Cortés, Rossina G. Pareja, Maria Reyna Liria, Martha Cecilia Yépez García, Marianella Herrera-Cuenca, Attilio Rigotti, Viviana Guajardo, Ioná Zalcman Zimberg, Ana Gab
Nutrition Research.2019; 68: 9. CrossRef - Prevalence and Factors Associated with Sugar-Sweetened Beverage Intake among Undergraduate Students in a Public University in Malaysia
Norliza- Ahmad, Muhammad Afiq-Md Zuki, Nur Azilah- Azahar, Boon Han- Khor, Halimatus Sakdiah- Minhat
Pakistan Journal of Nutrition.2019; 18(4): 354. CrossRef - Prevalence and characteristics of energy intake under‐reporting among Australian adults in 1995 and 2011 to 2012
King W. Tam, Jacob L. Veerman
Nutrition & Dietetics.2019; 76(5): 546. CrossRef - Best Practices for Conducting Observational Research to Assess the Relation between Nutrition and Bone: An International Working Group Summary
Regan L Bailey, Shivani Sahni, Patricia Chocano-Bedoya, Robin M Daly, Ailsa A Welch, Heike Bischoff-Ferrari, Connie M Weaver
Advances in Nutrition.2019; 10(3): 391. CrossRef - Improving the nutritional intake of hospital patients: how far have we come? A re‐audit
S. Beavan, R. Baker, H. Sadler, A. Collinson
Journal of Human Nutrition and Dietetics.2019; 32(3): 372. CrossRef - Strategies to Address Misestimation of Energy Intake Based on Self-Report Dietary Consumption in Examining Associations Between Dietary Patterns and Cancer Risk
Solbak, Al Rajabi, Akawung, Lo Siou, Kirkpatrick, Robson
Nutrients.2019; 11(11): 2614. CrossRef - The Relative Validity of the Menzies Remote Short-Item Dietary Assessment Tool (MRSDAT) in Aboriginal Australian Children Aged 6–36 Months
Emma Tonkin, Dani Kennedy, Rebecca Golley, Rebecca Byrne, Athira Rohit, Therese Kearns, Sarah Hanieh, Beverley-Ann Biggs, Julie Brimblecombe
Nutrients.2018; 10(5): 590. CrossRef - Improvement of Health Indicators after Participating in Health Promotion Program of General Hospital Staff: A Pilot Study
Inhyuk Park, Bumjo Oh, Ga-Hye Li, Jae Suk Park, Sang Hyung Lee
Korean Journal of Health Promotion.2018; 18(1): 15. CrossRef - Adherence to a Mediterranean diet is associated with lower incidence of frailty: A longitudinal cohort study
Nicola Veronese, Brendon Stubbs, Marianna Noale, Marco Solmi, Renè Rizzoli, Alberto Vaona, Jacopo Demurtas, Gaetano Crepaldi, Stefania Maggi
Clinical Nutrition.2018; 37(5): 1492. CrossRef - Discretionary food and beverage consumption and its association with demographic characteristics, weight status, and fruit and vegetable intakes in Australian adults
Zhixian Sui, Weng Kei Wong, Jimmy Chun Yu Louie, Anna Rangan
Public Health Nutrition.2017; 20(2): 274. CrossRef - Examining the Weight Trajectory of College Students
Lizzy Pope, Danielle Hansen, Jean Harvey
Journal of Nutrition Education and Behavior.2017; 49(2): 137. CrossRef - Transmission of energy-saving efficiency from obese parents to their offspring: the Korean National Health and Nutrition Examination Survey 2007–2011
Y Kim, H Kim, Y-C Hong
European Journal of Clinical Nutrition.2016; 70(4): 511. CrossRef - The effect of under-reporting of energy intake on dietary patterns and on the associations between dietary patterns and self-reported chronic disease in women aged 50–69 years
Marianne S. Markussen, Marit B. Veierød, Giske Ursin, Lene F. Andersen
British Journal of Nutrition.2016; 116(3): 547. CrossRef - Association between dietary fat intake and bone mineral density in Korean adults: data from Korea National Health and Nutrition Examination Survey IV (2008∼2009)
Y.-M. Kwon, G. W. Kim, H. W. Yim, Y. J. Paek, K.-S. Lee
Osteoporosis International.2015; 26(3): 969. CrossRef - Prevalence and characteristics of misreporting of energy intake in US adults: NHANES 2003–2012
Kentaro Murakami, M. Barbara E. Livingstone
British Journal of Nutrition.2015; 114(8): 1294. CrossRef - The Intake of Energy and Selected Nutrients by Thai Urban Sedentary Workers: An Evaluation of Adherence to Dietary Recommendations
Katiya Ivanovitch, Jeeranun Klaewkla, Rewadee Chongsuwat, Chukiat Viwatwongkasem, Wanicha Kitvorapat
Journal of Nutrition and Metabolism.2014; 2014: 1. CrossRef - Excessive Sodium Intake and Related Factors According to Energy Intakes Among Korean Elderly: A Nationwide Cross-Sectional Study
Young-Jin Tak, Jeong-Gyu Lee, Yun-Jin Kim, Sangyeoup Lee, Dong-Wook Jung, Yu-Hyeon Yi, Young-Hye Cho, Eun-Jung Choi, Seung-Hun Lee, Hye-Lim Hwang, A-Ra Cho
Journal of the Korean Geriatrics Society.2014; 18(4): 185. CrossRef
 PubReader
 Cite
Cite

