
Articles
- Page Path
- HOME > Osong Public Health Res Perspect > Volume 6(4); 2015 > Article
-
Original Article
Enteric Bacteria Isolated from Diarrheal Patients in Korea in 2014 - Nan-Ok Kim, Su-Mi Jung, Hae-Young Na, Gyung Tae Chung, Cheon-Kwon Yoo, Won Keun Seong, Sahyun Hong
-
Osong Public Health and Research Perspectives 2015;6(4):233-240.
DOI: https://doi.org/10.1016/j.phrp.2015.07.005
Published online: August 7, 2015
Division of Enteric Diseases, Center for Infectious Diseases, Korea National Institute of Health, Cheongju, Korea
- ∗Corresponding author. strepto13@hotmail.com
• Received: December 26, 2014 • Revised: July 10, 2015 • Accepted: July 25, 2015
Copyright © 2015 Korea Centers for Disease Control and Prevention. Published by Elsevier Korea LLC. All rights reserved.
Abstract
-
Objectives
- The aim of this study was to characterize the pathogens responsible for causing diarrhea according to season, region of isolation, patient age, and sex as well as to provide useful data for the prevention of diarrheal disease.
-
Methods
- Stool specimens from 14,886 patients with diarrhea were collected to identify pathogenic bacteria from January 2014 to December 2014 in Korea. A total of 3,526 pathogenic bacteria were isolated and analyzed according to season, region of isolation, and the age and sex of the patient.
-
Results
- The breakdown of the isolated pathogenic bacteria were as follows: Salmonella spp. 476 (13.5%), pathogenic Escherichia coli 777 (22.0%), Vibrio parahaemolyticus 26 (0.74%), Shigella spp. 13 (0.37%), Campylobacter spp. 215 (6.10%), Clostridium perfringens 508 (14.4%), Staphylococcus aureus 1,144 (32.4%), Bacillus cereus 356 (10.1%), Listeria monocytogenes 1 (0.03%), and Yersinia enterocolitica 10 (0.3%). The isolation rate trend showed the highest ratio in the summer season from June to September for most of the pathogenic bacteria except the Gram-positive bacteria. The isolation rate of most of the pathogenic bacteria by patient age showed highest ratio in the 0–19 year age range. For isolation rate by region, 56.2% were isolated from cities and 43.8% were isolated from provinces.
-
Conclusion
- Hygiene education should be addressed for diarrheal disease-susceptible groups, such as those younger than 10 years, aged 10–19 years, and older than 70 years, and monitoring for the pathogens is still required. In addition, an efficient laboratory surveillance system for infection control should be continued.
- An estimated 9.4 million foodborne illnesses caused by a known pathogen occur annually in the United States [1]. It has been reported that ∼2 million diarrhea disease patients die per year throughout the world 2, 3, 4. Considering the public health importance of acute diarrhea diseases, laboratory surveillance of acute diarrhea diseases is utilized in many countries. In the United States, the Foodborne Diseases Active Surveillance Network (FoodNet, www.cdc.gov/foodnet) tracks important foodborne illnesses and generates information that provides a foundation for food safety policies and prevention efforts [5]. Australia has a supervising system for foodborne diseases known as OzFoodNet (www.ozfoodnet.gov.au) [6]. In Canada, FoodNet-Canada (www.phac-aspc.gc.ca/foodnetcanada), which is an area-based monitoring system, is used.
- In Korea, the acute diarrheal disease laboratory surveillance system (Enter-Net) is used. The Enter-Net system is coordinated by the Korea National Institute of Health (KNIH), and comprises 17 local Public Health Institutes (PHIs) and 68 participating hospitals. Since 2003 when Enter-Net was established, the program has provided information that contributes to public health by monitoring laboratory-confirmed infections caused by pathogens, attributing illnesses to specific pathogens, and disseminating information 7, 8.
- Since its founding, Enter-Net has been an excellent example of partnership between KNIH and the local PHIs. Enter-Net has monitored laboratory-confirmed infections caused by ten bacterial pathogens (pathogenic Escherichia coli, Salmonella spp., Shigella spp., Vibrio parahaemolyticus, Campylobacter spp., Staphylococcus aureus, Clostridium perfringens, Listeria monocytogenes, Yersinia enterocolitica, and Bacillus cereus) and five viruses (rota, noro, adeno, sapo, and astro virus) 1, 9, 10.
- In this surveillance study, we analyzed isolated bacterial pathogens by season, patient age and sex, and region of isolation. This report will be useful for the prevention of diarrheal disease and to improve the public health care system and sanitation in Korea.
Introduction
- 2.1 Stool sample collection
- A total of 14,886 stool samples were collected by the acute diarrheal disease laboratory surveillance system (Enter-Net) in 2014. The Enter-Net system is coordinated by the Korea NIH and comprises 17 local PHIs and 68 participating hospitals. A stool sample was collected from patients who had diarrhea symptoms (diarrhea was defined as “the passage of three or more unformed stools per 24 hour period, with at least one passage accompanied by symptoms of nausea, vomiting, abdominal cramps or pain, fever or blood in the stool” 11, 12).
- 2.2 Bacterial isolation and primary identification
- Different selective agar plates were used to isolate the pathogenic bacteria. MacConkey agar was used for the detection of E. coli, Salmonella, and Shigella species. Thiosulfate-citrate-bile salts-sucrose (TCBS; Oxoid, Basingstoke, UK) agar was used for the detection of V. parahaemolyticus, Mannitol-Salt Agar (MSA; Oxoid) for S. aureus, Tryptose-Sulfite-Cycloserine (TSC; Oxoid) for C. perfringens, Modified Campylobacter Blood-Free Selective Agar Base (mCCDA; Oxoid) for Campylobacter species, Listeria Selective Agar (LSA; Oxoid) for L. monocytogenes, Cefsulodin-Irgasan-Novobiocin (CIN; Oxoid) for Y. enterocolitica, and Mannitol-Egg Yolk-Polymixin (MYP; Oxoid) for B. cereus. For the primary identification of E. coli, Salmonella, Shigella, Vibrio, and Yersinia, the standard physiological and biochemical tests with an API 20E and VITEK II (BioMérieux, Marcy l’Etoile, France) were employed. For the identification of Campylobacter, C. perfringens, Bacillus cereus, Listeria, and Staphylococcus, API Campy, API 20A, 50CHB/E, API Listeria, and API Staphy were used, respectively.
- 2.3 DNA manipulations and genetic techniques
- PCR was also used to screen the bacterial pathogens. A loopful of the human stool sample was directly inoculated into 3 mL of Tryptic Soy Broth (TSB; Oxoid) for enrichment and was incubated overnight at 37°C with shaking. After incubation, the enriched broth culture was used for isolation of chromosomal DNA. The template DNA for PCR was extracted by the conventional boiling method. All of the PCRs were performed with the Expanded High Fidelity Polymerase System (Roche) or Taq polymerase (Takara, Shiga, Japan) according to the manufacturer's instructions. The primers used for amplification are listed in Tables S1 and S2.
- 2.4 Serotyping
- The serotyping of Salmonella, E. coli, Vibrio, and Shigella spp. was carried out according to the manufacturer's instructions (Denka Seiken, Tokyo, Japan and Difco, New Jersey, USA).
- 2.5 Statistical analysis
- The collected data were analyzed using the SPSS 20.0 statistical package (IBM, Seoul, Korea). The patients' age and sex, and the month and regional distributions of the isolated pathogens were analyzed using the Chi-square or Chi-square trend test. For the statistical analysis, p < 0.05 was taken to be significant.
Materials and methods
- 3.1 Pathogenic bacteria isolation
- From January 2014 to December 2014, stool specimens were collected from 14,886 diarrheal patients to identify the pathogenic bacteria involved. Among the 14,886 stool specimens, 3,526 pathogenic bacteria (23.7%) known to cause diarrhea were isolated from the stool specimens. The breakdown of the 3,526 bacteria isolates was as follows: Salmonella spp. 476 (13.5%), pathogenic E. coli 777 (22.0%), V. parahaemolyticus 26 (0.74%), Shigella spp. 13 (0.37%), Campylobacter spp. 215 (6.10%), C. perfringens 508 (14.4%), S. aureus 1,144 (32.4%), B. cereus 356 (10.1%), L. monocytogenes 1 (0.03%), and Y. enterocolitica 10 (0.3%; Table 1). In additional analysis, 208 (1.40%) infected patients were found to represent duplicate cases. Among the isolated Salmonella strains, the representation of S. Enteritidis, S. Typhimurium and Salmonella spp. was 120 (25.2%), 74 (15.5%), and 282 (59.2%), respectively. In the pathogenic E. coli group, Enteropathogenic E. coli (EPEC), Enteroaggregative E. coli (EAEC), Enterotoxigenic E. coli (ETEC), Enterohaemorrhagic E. coli (EHEC), and Enteroinvasive E. coli (EIEC) were represented by 513 (66.0%), 139 (17.9%), 80 (10.3%), 39 (5.0%), and 6 (0.8%) isolates, respectively (Table 1).
- 3.2 Seasonal prevalence of the isolated bacterial pathogens
- We analyzed the pathogenic bacteria isolation rate by month (from January to December). An average isolation rate of 10 pathogenic bacteria gradually increased from May and was highest in August at 36.29% (summer) and decreased to the lowest rate of 16.53% by April (spring; Table 1 and Fig. 1). Among the 10 pathogenic bacteria, Gram-negative bacteria, Salmonella spp., pathogenic E. coli, and Campylobacter spp., showed an increasing pattern by temperature, which increased from May and was highest from June to July. Salmonella spp., pathogenic E. coli, Campylobacter spp., showed the highest prevalence in July. Interestingly, Shigella spp. was isolated mostly in the winter season in November and December (Table 1 and Fig. 1A). However, with Gram-positive bacteria, C. perfringens and S. aureus, the average isolation rate tended to be even throughout the year. Only B. cereus showed a similar trend to that of the Gram-negative bacteria, specifically the pathogenic E. coli (Table 1 and Fig. 1B).
- 3.3 Age and sex-specific prevalence of the isolated bacterial pathogens
- Next, we analyzed the pathogenic bacteria isolation rate based on eight patient age categories: < 10 years, 10–19 years, 20–29 years, 30–39 years, 40–49 years, 50–59 years, 60–69 years, and ≥ 70 years (Fig. 2). An average isolation rate of the 10 pathogenic bacteria by age was highest among patients aged < 10 years (44.5%) and ≥ 70 years (13.4%), and the difference among the age classes was significant based on the Chi-square test (p < 0.05). Among the 10 pathogenic bacteria, Gram-negative pathogenic bacteria (Salmonella spp., pathogenic E. coli, V. parahaemolyticus, Shigella spp., and Campylobacter spp.) showed a similar pattern with the average isolation rate. Gram-positive pathogenic bacteria (S. aureus and B. cereus) showed a similar pattern to the Gram-negative bacteria, and the isolation rate was highest in the < 10 years group and decreased gradually with age. However, only C. perfringens showed an increasing pattern with age (Table 2). Next we examined the isolation rate by sex. An average isolation rate of the 10 pathogenic bacteria by sex was 45.0% for men and 38.3% for women (Table 2); however, the Chi-square test result was not significant (p ≥ 0.05).
- 3.4 Regional prevalence of the isolated bacterial pathogens
- A total of 14,886 stool samples obtained from patients with acute diarrhea were analyzed by regional prevalence (cities or rural provinces). Of the isolated samples, 1,982 (56.2%) pathogenic bacteria were isolated from 6,823 urban patients, and 1,544 (43.8%) were isolated from 8,063 rural patients. As shown in Table 3, the number of isolated bacteria ranged from 138 (3.9%) to 565 (16.0%) in cities, while in the rural province region, it ranged from 63 (1.8%) to 418 (11.9%; Table 3).
Results
- Diarrheal disease continues to be an important problem in the world [13]. In our surveillance results of bacterial pathogens, pathogenic E. coli (22.0%) and Salmonella spp. (13.5%) were the major Gram-negative bacteria isolated and S. aureus (32.4%) and C. perfringens (14.4%) were the major Gram-positive bacteria isolated.
- In the pathogenic E. coli group, EPEC was the most frequently isolated pathogen (66.3% in pathogenic E. coli, 14.6% in isolated pathogens), which was followed by EAEC (17.9% in pathogenic E. coli, 3.9% in isolated pathogens). High frequencies of EPEC isolation were also found in another countries, such as Chile (38.3%) and Brazil (34.0%), but low frequencies were observed in Thailand (5.5%) 14, 15, 16. Based on a recent report, EAEC was the most frequent diarrheagenic E. coli category in Brazil [17]. EHEC and ETEC isolates represented < 10% of the pathogenic E. coli with 3.7% and 9.5% representation, respectively (0.9% and 2.5% of the total isolated pathogens, respectively). In the USA FoodNet Annual Report, EHEC O157 and EHEC non-O157 represented 2.7% and 2.8% of the isolated pathogens, respectively (www.cdc.gov/foodnet).
- Salmonella represented the second largest pathogen group (13.5%). Among Salmonella strains, there were twice as many S. Enteritidis isolates as S. Typhimurium isolates, which is similar to the pattern described in a previous report [18]. Additionally, there are reports that a similar rate (11%) of Salmonella species isolation was detected through the surveillance of childhood diarrheal diseases in Asia and Hong Kong, but another study indicated that the rate of enteric infection from Salmonella species is 1.8% in Bangladesh, which is lower than our report 19, 20.
- Campylobacter is one of the most common causes of human diarrheal disease in the US (34.7% in isolated pathogens; 2012 Annual Report), but cases of human Campylobacteriosis may have been underestimated in Korea at 6.1% 21, 22, 23. Pathogenic E. coli, Salmonella, and Campylobacter spp. showed an increasing prevalence pattern by temperature with an increase from May to a peak at June–July.
- There were only 16 Shigella spp. and 10 Y. enterocolitica isolates identified in Korea in 2014. Shigella spp. pathogens were isolated mainly in the winter season, which was unlike the other Gram-negative bacteria.
- S. aureus is widely distributed in the surrounding environment and can be the cause of severe infectious diseases. As it is tolerant of harsh environments, such as human skin and various foods, S. aureus is easily isolated and represented the highest frequency of any pathogen in our study at 32.4%. Additionally, S. aureus was the fourth most frequent pathogen associated with foodborne illness in Korea (www.kfda.go.kr/e-stat/).
- The isolation rate of Gram-positive pathogenic bacteria by season tended to be distributed evenly throughout the year. In addition, the isolation rate was highest under the age of 10 years and decreased gradually as age increased. However, C. perfringens isolation increased with age. Of note, the isolation rate of S. aureus, C. perfringens, and B. cereus strains in this study may have been overestimated because the Enter-Net surveillance system diagnoses these pathogens by presence of the enterotoxin genes by PCR.
- There are few comparable studies concerning adult patients with diarrhea, but there are considerably more studies regarding childhood diarrhea 24, 25, 26, 27, 28. In British and Swedish studies, the presence of at least one enteropathogen was detected in 45% and 56% of patients, respectively 29, 30. The difference between previous research and our surveillance results may be due to many different factors, including the sampling procedures, diagnostic methods, and treatment with antibiotics shortly after the onset of diarrhea. We plan to analyze more than a 1 year time frame using epidemiological and clinical data in the near future. Our analysis consists of surveillance of sporadic cases of illness caused by these pathogens, which largely excludes cases of foodborne outbreaks.
- In conclusion, hygiene education should be addressed for diarrheal disease-susceptible groups, such as those preschool children, young generation, and the old and weak class, and monitoring for the pathogens is still required. As most diarrheal illnesses are preventable, an efficient laboratory surveillance system for monitoring prevention progress and infection control should be continued.
Discussion
- All authors declare no conflicts of interest.
Conflicts of interest
Supplementary data
-
Acknowledgements
- This study was supported by the Korea National Institute of Health (Grant No. 4851-304-210-13).
Acknowledgments
-
This is an open-access article distributed under the terms of the Creative Commons Attribution-NonCommercial-No Derivative Works License (http://creativecommons.org/licenses/by-nc-nd/4.0) which permits non-commercial use, distribution, and reproduction in any medium, provided the original author and source are credited.
-
Supplementary data related to this article can be found at http://dx.doi.org/10.1016/j.phrp.2015.07.005.
Article information
- 1. Scallan E., Hoekstra R.M., Angulo F.J.. Foodborne illness acquired in the United States—major pathogens. Emerg Infect Dis 17(1). 2011 Jan;7−15. PMID: 21192848.ArticlePubMed
- 2. Flint J.A., Van Duynhoven Y.T., Angulo F.J.. Estimating the burden of acute gastroenteritis, foodborne disease, and pathogens commonly transmitted by food: an international review. Clin Infect Dis 41(5). 2005 Sep;698−704. PMID: 16080093.ArticlePubMed
- 3. Havelaar A.H., Cawthorne A., Angulo F.. WHO initiative to estimate the global burden of foodborne diseases. Lancet 381:2013 Jun;S59. Article
- 4. Mitsuda T.. [Infection prevention and control for foodborne infections]. Nihon rinsho 70(8). 2012 Aug;1406−1413. Japanese. PMID: 22894082.PubMed
- 5. Kendall M.E., Crim S., Fullerton K.. Travel-associated enteric infections diagnosed after return to the United States, Foodborne Diseases Active Surveillance Network (FoodNet), 2004–2009. Clin Infect Dis 54(Suppl. 5). 2012 Jun;S480−S487. PMID: 22572673.ArticlePubMed
- 6. Kirk M.D., McKay I., Hall G.V., Dalton C.B., Stafford R., Unicomb L., Gregory J.. Food Safety: foodborne disease in Australia: the OzFoodNet experience. Clin Infect Dis 47(3). 2008 Aug;392−400. PMID: 18558879.ArticlePubMed
- 7. Cho S.H., Kim J.H., Kim J.C., Shin H.H., Kang Y.H., Lee B.K.. Surveillance of bacterial pathogens associated with acute diarrheal disease in the Republic of Korea during one year, 2003. J Microbiol 44(3). 2006 Jun;327−335. PMID: 16820763.PubMed
- 8. Cho S.H., Shin H.H., Choi Y.H., Park M.S., Lee B.K.. Enteric bacteria isolated from acute diarrheal patients in the Republic of Korea between the year 2004 and 2006. J Microbiol 46(3). 2008 Jun;325−330. PMID: 18604503.ArticlePubMed
- 9. Newell D.G., Koopmans M., Verhoef L.. Food-borne diseases—the challenges of 20 years ago still persist while new ones continue to emerge. Int J Food Microbiol 139(Suppl. 1). 2010 May;S3−15. PMID: 20153070.ArticlePubMed
- 10. Potasman I., Paz A., Odeh M.. Infectious outbreaks associated with bivalve shellfish consumption: a worldwide perspective. Clin Infect Dis 35(8). 2002 Oct;921−928. PMID: 12355378.ArticlePubMed
- 11. DuPont H.L., Ericsson C.D.. Prevention and treatment of traveler's diarrhea. N Engl J Med 328(25). 1993 Jun;1821−1827. PMID: 8502272.ArticlePubMed
- 12. von Sonnenburg F., Tornieporth N., Waiyaki . Risk and aetiology of diarrhoea at various tourist destinations. Lancet 356(9224). 2000 Jul;133−134. PMID: 10963251.ArticlePubMed
- 13. Nyachuba D.G.. Foodborne illness: is it on the rise? Nutr Rev 68(5). 2010 May;257−269. PMID: 20500787.ArticlePubMed
- 14. Hoge C.W., Gambel J.M., Srijan A., Pitarangsi C., Echeverria P.. Trends in antibiotic resistance among diarrheal pathogens isolated in Thailand over 15 years. Clin Infect Dis 26(2). 1998 Feb;341−345. PMID: 9502453.ArticlePubMed
- 15. Levine M.M., Prado V., Robins-Browne R.. Use of DNA probes and HEp-2 cell adherence assay to detect diarrheagenic Escherichia coli. J Infect Dis 158(1). 1988 Jul;224−228. PMID: 3292660.ArticlePubMed
- 16. Gomes T.A., Rassi V., MacDonald K.L.. Enteropathogens associated with acute diarrheal disease in urban infants in São Paulo, Brazil. J Infect Dis 164(2). 1991 Aug;331−337. PMID: 1856482.ArticlePubMed
- 17. Regua-Mangia A.H., Gomes T.A., Vieira M.A., Andrade J.R., Irino K., Teixeira L.M.. Frequency and characteristics of diarrhoeagenic Escherichia coli strains isolated from children with and without diarrhoea in Rio de Janeiro, Brazil. J Infect 48(2). 2004 Feb;161−167. PMID: 14720492.ArticlePubMed
- 18. Rodrigue D.C., Tauxe R.V., Rowe B.. International increase in Salmonella enteritidis: a new pandemic? Epidemiol Infect 105(1). 1990 Aug;21−27. PMID: 2200698.ArticlePubMed
- 19. Albert M.J., Faruque A.S., Faruque S.M., Sack R.B., Mahalanabis D.. Case-control study of enteropathogens associated with childhood diarrhea in Dhaka, Bangladesh. J Clin Microbiol 37(11). 1999 Nov;3458−3464. PMID: 10523534.ArticlePubMed
- 20. Nelson E.A., Tam J.S., Yu L.M., Glass R.I., Parashar U.D., Fok T.F.. Surveillance of childhood diarrhoeal disease in Hong Kong, using standardized hospital discharge data. Epidemiol Infect 132(4). 2004 Aug;619−626. PMID: 15310163.ArticlePubMed
- 21. Centers for Disease Control and Prevention . Surveillance for foodborne disease outbreaks—United States, 2009–2010. MMWR Morb Mortal Wkly Rep 62(3). 2013 Jan;41−47. PMID: 23344696.PubMed
- 22. Kubota K., Iwasaki E., Inagaki S.. The human health burden of foodborne infections caused by Campylobacter, Salmonella, and Vibrio parahaemolyticus in Miyagi Prefecture, Japan. Foodborne Pathog Dis 5(4). 2008 Oct;641−648. PMID: 18851675.ArticlePubMed
- 23. Centers for Disease Control . Acute infectious agents laboratory surveillance reports weekly [Internet]. 2010. WHO; Geneva (Switzerland): Available from:. www.cdc.go.kr. [accessed 06.15.10].
- 24. Baqui A.H., Sack R.B., Black R.E.. Enteropathogens associated with acute and persistent diarrhea in Bangladeshi children less than 5 years of age. J Infect Dis 166(4). 1992 Oct;792−796. PMID: 1527413.ArticlePubMed
- 25. Caprioli A., Pezzella C., Morelli R.. Enteropathogens associated with childhood diarrhea in Italy. The Italian Study Group on Gastrointestinal Infections. Pediatr Infect Dis J 15(10). 1996 Oct;876−883. PMID: 8895919.ArticlePubMed
- 26. Petersen A.M., Nielsen S.V., Meyer D., Ganer P., Ladefoged K.. Bacterial gastroenteritis among hospitalized patients in a Danish County, 1991–93. Scand J Gastroenterol 31(9). 1996 Sep;906−911. PMID: 8888439.ArticlePubMed
- 27. Barnes G.L., Uren E., Stevens K.B., Bishop R.F.. Etiology of acute gastroenteritis in hospitalized children in Melbourne, Australia, from April 1980 to March 1993. J Clin Microbiol 36(1). 1998 Jan;133−138. PMID: 9431936.ArticlePubMed
- 28. Presterl E., Nadrchal R., Wolf D., Rotter M., Hirschl A.M.. Enteroaggregative and enterotoxigenic Escherichia coli among isolates from patients with diarrhea in Austria. Eur J Clin Microbiol Infect Dis 18(3). 1999 Mar;209−212. PMID: 10357057.ArticlePubMed
- 29. Wheeler J.G., Sethi D., Cowden J.M.. Study of infectious intestinal disease in England: rates in the community, presenting to general practice, and reported to national surveillance. The Infection Intestinal Disease Study Executive. BMJ 318(7190). 1999 Apr;1046−1050. PMID: 10205103.ArticlePubMed
- 30. Svenungsson B., Lagergren A., Ekwall E.. Enteropathogens in adult patients with diarrhea and healthy control subjects: a 1-year prospective study in a Swedish clinic for infectious diseases. Clin Infect Dis 30(5). 2000 May;770−778. PMID: 10816147.ArticlePubMed
References
Figure 1Seasonal isolation rate patterns. (A) Gram-negative bacterial pathogens and (B) Gram-positive bacterial pathogens are shown.
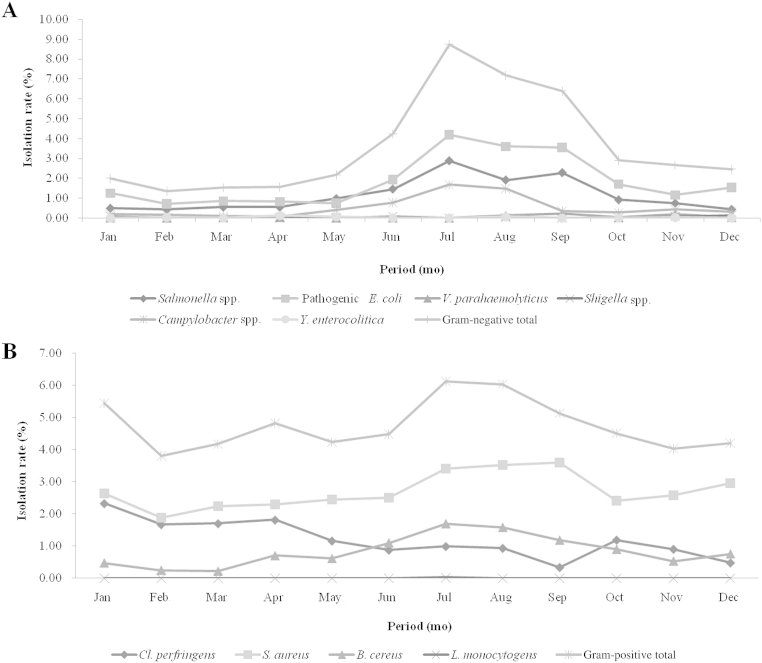
Figure 2Isolation rates. (A) Gram-negative and (B) Gram-positive bacterial pathogens on the basis of age are shown.
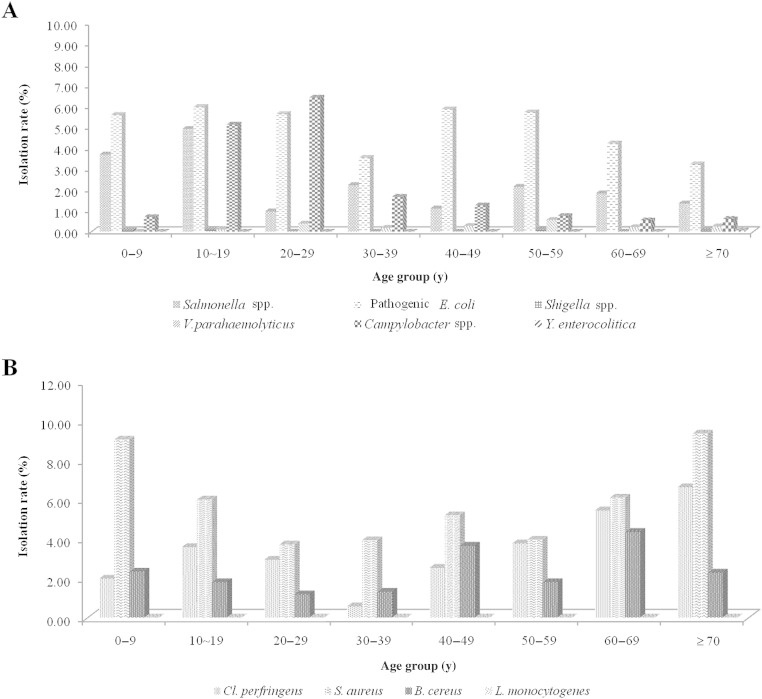
Table 1The monthly isolation rate of the bacterial pathogens.
Table 2The isolation rate of the bacterial pathogens by age and sex.
Table 3Regional distribution of the isolated bacterial pathogens.
Figure & Data
References
Citations
Citations to this article as recorded by 
- Antimicrobial Susceptibility Patterns and Genetic Diversity of Campylobacter spp. Isolates from Patients with Diarrhea in South Korea
So Yeon Kim, Dongheui An, Hyemi Jeong, Jonghyun Kim
Microorganisms.2024; 12(1): 94. CrossRef - Comparative evaluation of two molecular multiplex syndromic panels with acute gastroenteritis
Kuenyoul Park, Bo-Moon Shin
Diagnostic Microbiology and Infectious Disease.2024; 109(1): 116211. CrossRef - Antimicrobial Resistance Profiles and Molecular Characteristics of Salmonella enterica Serovar Agona Isolated from Food-Producing Animals During 2010–2020 in South Korea
Hyun-Ju Song, Sekendar Ali, Bo-Youn Moon, Hee Young Kang, Eun Jeong Noh, Tae-Sun Kim, Su-Jeong Kim, Ji-In Kim, Yun Jin Lee, Soon-Seek Yoon, Suk-Kyung Lim
Foodborne Pathogens and Disease.2024;[Epub] CrossRef - An Outbreak of Campylobacter Jejuni Involving Healthcare Workers Detected by COVID-19 Healthcare Worker Symptom Surveillance
Hye Jin Shi, Jae Baek Lee, Shinhee Hong, Joong Sik Eom, Yoonseon Park
Korean Journal of Healthcare-Associated Infection .2023; 28(1): 172. CrossRef - Plant-derived nanoparticles as alternative therapy against Diarrheal pathogens in the era of antimicrobial resistance: A review
Tesleem Olatunde Abolarinwa, Daniel Jesuwenu Ajose, Bukola Opeyemi Oluwarinde, Justine Fri, Kotsoana Peter Montso, Omolola Esther Fayemi, Adeyemi Oladapo Aremu, Collins Njie Ateba
Frontiers in Microbiology.2022;[Epub] CrossRef - Prevalence, co-infection and seasonality of fecal enteropathogens from diarrheic cats in the Republic of Korea (2016–2019): a retrospective study
Ye-In Oh, Kyoung-Won Seo, Do-Hyung Kim, Doo-Sung Cheon
BMC Veterinary Research.2021;[Epub] CrossRef - Genotyping and antimicrobial susceptibility of Clostridium perfringens isolated from dromedary camels, pastures and herders
Mahmoud Fayez, Ibrahim Elsohaby, Theeb Al-Marri, Kamal Zidan, Ali Aldoweriej, Elham El-Sergany, Ahmed Elmoslemany
Comparative Immunology, Microbiology and Infectiou.2020; 70: 101460. CrossRef - Comparative Analysis of Aerotolerance, Antibiotic Resistance, and Virulence Gene Prevalence in Campylobacter jejuni Isolates from Retail Raw Chicken and Duck Meat in South Korea
Jinshil Kim, Hyeeun Park, Junhyung Kim, Jong Hyun Kim, Jae In Jung, Seongbeom Cho, Sangryeol Ryu, Byeonghwa Jeon
Microorganisms.2019; 7(10): 433. CrossRef - Guideline for the Antibiotic Use in Acute Gastroenteritis
Youn Jeong Kim, Ki-Ho Park, Dong-Ah Park, Joonhong Park, Byoung Wook Bang, Seung Soon Lee, Eun Jung Lee, Hyo-Jin Lee, Sung Kwan Hong, Yang Ree Kim
Infection & Chemotherapy.2019; 51(2): 217. CrossRef - Winning the War against Multi-Drug Resistant Diarrhoeagenic Bacteria
Chizoba Mercy Enemchukwu, Angus Nnamdi Oli, Ebere Innocent Okoye, Nonye Treasure Ujam, Emmanuel O. Osazuwa, George Ogonna Emechebe, Kenneth Nchekwube Okeke, Christian Chukwuemeka Ifezulike, Obiora Shedrack Ejiofor, Jude Nnaemeka Okoyeh
Microorganisms.2019; 7(7): 197. CrossRef - Molecular Characterization of Enterotoxigenic Escherichia coli in Foodborne Outbreak
Sang-Hun Park, Hyun-Jung Seung, Hyo-Won Jeong, So-Yun Park, Ji-Hun Jung, Young-Hee Jin, Sung-Hee Han, Hee-Soon Kim, Jin-Seok Kim, Joo-Hyun Park, Ye-Ji Gong, Chae Kyu Hong, Jib-Ho Lee, Il-Young Kim, Kweon Jung
Journal of Bacteriology and Virology.2018; 48(4): 113. CrossRef - Epidemiology of Listeria monocytogenes prevalence in foods, animals and human origin from Iran: a systematic review and meta-analysis
Reza Ranjbar, Mehrdad Halaji
BMC Public Health.2018;[Epub] CrossRef - The Epidemiological Influence of Climatic Factors on Shigellosis Incidence Rates in Korea
Yeong-Jun Song, Hae-Kwan Cheong, Myung Ki, Ji-Yeon Shin, Seung-sik Hwang, Mira Park, Moran Ki, Jiseun Lim
International Journal of Environmental Research an.2018; 15(10): 2209. CrossRef - Molecular characterization and antimicrobial resistance profile of Clostridium perfringens type A isolates from humans, animals, fish and their environment
Jay Prakash Yadav, Suresh Chandra Das, Pankaj Dhaka, Deepthi Vijay, Manesh Kumar, Asish Kumar Mukhopadhyay, Goutam Chowdhury, Pranav Chauhan, Rahul Singh, Kuldeep Dhama, Satya Veer Singh Malik, Ashok Kumar
Anaerobe.2017; 47: 120. CrossRef - Molecular characterization of antimicrobial resistant non-typhoidal Salmonella from poultry industries in Korea
Jin Eui Kim, Young ju Lee
Irish Veterinary Journal.2017;[Epub] CrossRef
 PubReader
 Cite
Cite

