
Articles
- Page Path
- HOME > Osong Public Health Res Perspect > Volume 7(1); 2016 > Article
-
Original Article
Factors associated with health services utilization between the years 2010 and 2012 in Korea: using Andersen's Behavioral model - Han-Kyoul Kima, Munjae Leeb
-
Osong Public Health and Research Perspectives 2015;7(1):18-25.
DOI: https://doi.org/10.1016/j.phrp.2015.11.007
Published online: November 27, 2015
aBK21PLUS Program in Embodiment: Health–Society Interaction, Department of Public Health Sciences, Korea University Graduate School, Seoul, Korea
bSchool of Health Policy and Management, College of Health Science, Korea University, Seoul, Korea
- ∗Corresponding author. emunjae@korea.ac.kr
• Received: November 6, 2015 • Accepted: November 23, 2015
Copyright © 2015 Korea Centers for Disease Control and Prevention. Published by Elsevier Korea LLC.
This is an open access article under the CC BY-NC-ND license (http://creativecommons.org/licenses/by-nc-nd/4.0/).
Abstract
-
Objectives
- This study aimed to examine the factors associated with health services utilization using Andersen's behavioral model.
-
Methods
- We collected Korea Health Panel data between the years 2010 and 2012 from the consortium of the National Health Insurance Service and the Korea Institute for Health and Social Affairs, and analyzed the data to determine the outpatients and inpatients of health services utilization.
-
Results
- Health services utilization was more significantly explained by predisposing and need factors than enabling factors. The outpatients were examined more specifically; sex, age, and marital status as predisposing factors, and chronic illness as a need factor were the variables that had significant effects on health-services-utilization experience. The inpatients were examined more specifically: sex, age, and marital status in predisposing factors; education level, economic activities, and insurance type in enabling factors; and chronic illness and disability status in need factors were the significant variables having greater effects on health-services-utilization experience.
-
Conclusion
- This study suggests the practical implications for providing health services for outpatients and inpatients. Moreover, verifying the general characteristics of outpatients and inpatients by focusing on their health services utilization provides the baseline data for establishing health service policies and programs with regard to the recently increasing interest in health services.
- The medical security system in Korea has achieved remarkable quantitative growth over a relatively short period. However, income inequality intensified in the overall society during the International Monetary Fund crisis, which accordingly engendered health-equity issues. Differentiation occurs at the basic health level, since health needs and achievements vary by income, education level, and employment security; there are also gaps in health services accessibility [1].
- Health services utilization is not created by a simple health condition, but is a final outcome after creating health needs based on socioeconomic factors 2, 3. This becomes the foundation of theories on health needs and is important when determining the aspects of health services utilization. Moreover, in the behavioral model, an individual's demographic, sociostructural, and economic factors affect health services utilization along with disease factors 4, 5, 6. Using this theoretical background, multiple studies have examined individuals' socioeconomic factors and the characteristics of the communities to which the individuals belong, in addition to the disease factors, to analyze health services utilization. The results suggest that health services utilization is basically motivated by individual illness, but the quality and quantity of health services utilization vary significantly based on socioeconomic factors, such as income or health-insurance status 7, 8.
- Meanwhile, the health and medical field conventionally uses the health belief and Andersen theoretical models to explain services utilization 9, 10, 11. Of the two, the Andersen model, which explains that the services utilization is determined by predisposing, enabling, and need factors, is used broadly as a theoretical model that analyzes predictors of health services utilization. This may also be a suitable model when exploratory research is needed due to lack of previous studies on outpatient and inpatient health services utilization, as in this study [12].
- To research how the relevance of categorized factors with health services utilization varies, Andersen and Newman [13] compared the size of factors affecting health services utilization, such as inpatient and outpatient services, by combining the results of Andersen's individual research [14]. As a result, both inpatient and outpatient services were strongly affected by the disease factors that represent health conditions, whereas predisposing factors and enabling factors had medium effects [10]. For the predisposing factors, social factors, such as education and employment status, had significant effects on inpatient services, implying that outpatient than inpatient services may respond more sensitively to an individual's socioeconomic position 5, 15, 16.
- This study will verify the general experiences of outpatient and inpatient services in Korea, and explore and examine the predictors that affect the health services utilization by applying the Andersen model. This study has significance in that it can empirically verify whether the Andersen model can be applied to outpatients and inpatients as in overseas studies, and can clarify the predictors for health-services-utilization experiences in Korea that are measured objectively. The specific research questions are as follows: (1) What are the general characteristics related to health-services-utilization experiences of outpatients and inpatients? and (2) How do predisposing, enabling, and need factors affect the health-services-utilization experiences of outpatients and inpatients?
Introduction
- 2.1 Research model
- This study examined the predisposing, enabling, and need factors that determine the overall health-services-utilization experiences of outpatients and inpatients with the aforementioned Andersen model as the theoretical framework. The research model for analysis is shown in Figure 1.
- 2.2 Data source
- This study used the source data of the Korea Health Panel jointly collected by the consortium of the National Health Insurance Service and the Korea Institute for Health and Social Affairs. The Korea Health Panel included information, such as health-services-utilization behaviors and health-care expenditures. Moreover, national representativeness was secured by extracting samples from 90% complete enumeration data of the 2006 Population and Housing Census. Sampling was done by stratified cluster sampling; the first step consisted of extracting sampling enumeration districts (clusters) based on the stratification variables (such as 16 cities, provinces, dongs, eups, myeons, and gus). The second step consisted of extracting sample households within the enumeration districts. The data were provided after completing the “Data Use Agreement” on the Korea Health Panel website. The 3 years' worth of data used for this study were panel data from 2010 to 2012. This study verified the accessibility to health services in the entire population group. Therefore, it included 13,734 participants from all household members surveyed in the Korea Health Panel.
- 2.3 Measurement 2.3.1
- The dependent variable in this study was health services utilization. In the analysis, it was divided into outpatient and inpatient services. Whether one utilized health services was calculated by the experiences of using outpatient and inpatient services at least once in the past year. Table 1 explains the dependent variable used in this study. 2.3.2
- This study adopted Andersen's behavioral model widely known for verifying the accessibility to health services. The Andersen model consisted of predisposing, enabling, and need factors [17]. Predisposing factors refer to basic characteristics of the population; in this study, they included sex, age, and marital status. Enabling factors refer to conditions that may be changed by an individual and social efforts; in this study, they included education and income level, economic activities, form of medical security, and private-insurance status 18, 19. Need factors were the most directly associated with the accessibility to health services and reflect disease characteristics [20]. In this study, they included chronic disease and disability status. Table 2 shows the independent variables used in the analysis.
- 2.4 Method of analysis
- A frequency analysis was conducted to determine the demographic characteristics of outpatients and inpatients, as well as the overall contents of key variables. Then, to determine the effects of predisposing, enabling, and need factors on health-services-utilization experiences based on the Andersen model, a hierarchical logistic-regression analysis was conducted. The analysis was completed using the statistical package STATA/SE version 13.0 (Stata Corp, College Station, TX).
in which
Materials and methods
2.3.1 Dependent variable
2.3.2 Independent variables
- 3.1 General characteristics
- Table 3 shows the demographic analysis results of the research participants. First, in terms of predisposing factors, there were more women than men in the distribution of participants by year. Moreover, the average age was around 50, indicating that many of them are middle-aged. Most participants were married (around 70%), while 18% of them were single with the rate slightly increasing by year. In terms of enabling factors, middle-school graduates and high-school graduates showed the largest distribution at about 50%. Elementary-school graduates and university graduates or higher also accounted for 25% each, respectively. As for income level, this study used data that equally distributed the values into five categories using the household equivalence scale of the Korea Health Panel data. The distribution slightly varied in the process of eliminating missing values or abnormal values; however, the distribution was relatively even from the first to fifth quantiles. There was a small gap between the economically active (∼55%) and inactive populations (∼45%). Most of the participants had health insurance (95%). Participants who have at least one chronic illness accounted for approximately 65%, taking up a large portion. Approximately 92% of the participants responded that they had no disability.
- The dependent variable used in this study was the experience of using outpatient and inpatient services. Table 4 shows the distribution of services utilization by the participants in each year. Most of the participants were using outpatient services. By contrast, only ∼14% of the participants were using inpatient services.
- 3.2 Logistic-regression analysis 3.2.1
- The results of the hierarchical logistic-regression analysis on outpatient services utilization are shown in Table 5. First, Model 1, including only predisposing factors, showed significant results for sex, age, and marital status. Women tended to use more outpatient services than men did; the older they were, the less they used outpatient services. Married people used 11 times more outpatient services than singles did. Model 2, including both predisposing and enabling factors, showed significance in sex, age, and marital status like Model 1; however, no enabling-factor variable showed significance. Finally, the results of Model 3, including need factors, were as follows. First, the sex, age, and marital status of predisposing factors were significant. However, there was no significant variable among the enabling factors; only the chronic-illness variable showed a significant value among the need factors. Like previous models, women tended to use more outpatient services than men did, and the older they were, the less they used outpatient services. Furthermore, even though the effect size became relatively smaller, married people used eight times more outpatient services than singles did. In addition, those with chronic illness used twice as many outpatient services as those without chronic illness did. 3.2.2
- Table 6 shows the results of the hierarchical logistic-regression analysis on inpatient services utilization. Like the results of outpatient services utilization, Model 1 shows the results including only predisposing factors. Age and marital status showed significance for inpatient services utilization; the older they were, the more they used inpatient services. Married people as well as those who experienced separation by either death or divorce used more inpatient services than singles did. Next, in Model 2, adding enabling factors, sex, age, and marital status of predisposing factors were significant. Education level, economic activities, and insurance type, among enabling factors, were significant. Men used more inpatient services than women did, and the older they were, the more they used inpatient services. Furthermore, singles tended to use fewer inpatient services than other groups did. Middle-school, high-school, and university graduates or higher tended to use less inpatient services than elementary-school graduates did. The economically active group used fewer inpatient services than the economically inactive group did; those who paid into health insurance tended to use fewer services than those who received medical reimbursement. Finally, in Model 3, including need factors, the variables significant in Model 2 all showed significant results in the same direction, and chronic illness and disability status also showed significant results. In other words, the group with chronic illness and disability tended to use more inpatient health services.
Results
3.2.1 Health services utilization of outpatient
3.2.2 Health services utilization of inpatient
- This study analyzed the factors affecting health services utilization using logistic-regression analysis by organizing the Korea Health Panel data into panel data (2010–2012). First, experience in health services utilization was more significantly explained by predisposing and need factors than enabling factors. This result was consistent with previous studies reporting that the influence of need factors is stronger than enabling factors in services utilization. There are some limitations in health services utilization by the members of our society due to education level and economic activities, but this indicates that health services are utilized based on health needs 17, 21, 22. Second, when predictors for health-services-utilization experiences of outpatients were examined more specifically, sex, age, and marital status as predisposing factors and chronic illness as a need factor were the variables that had significant effects on health-services-utilization experience. However, enabling factors, such as education level, economic activities, and insurance type, did not have significant effects on health-services-utilization experience. While inequality in services utilization by education did not appear among outpatients, it did appear to be unequal by sex 3, 23. Third, when predictors for health-services-utilization experience of inpatients were examined more specifically, sex, age, and marital status in predisposing factors; education level, economic activities, and insurance type in enabling factors; and chronic illness and disability status in need factors were the significant variables having greater effects on health-services-utilization experience. This result showed that education level and economic activities had relevance in the negative direction, indicating that the higher the income and education level and the more economic activities, hospitalization duration significantly shortened. This may be due to the occurrence of opportunity costs from hospitalization [24].
- This study has the following limitations. First, data on health services utilization used in the analysis were not data on expenses. Data on expenses can be analyzed by combining outpatient and inpatient data, and can reflect the intensity of individual treatment and service quality. Second, sociostructural variables, such as income or economic activities, were investigated in detail, but variables related to need factors could not be classified in detail, thereby failing to specifically analyze the need factors that were the most relevant to health services utilization 24, 25. Despite the limitations, this study has significance in that it empirically analyzed the predictors for Korean health services utilization by applying the Andersen model 26, 27. In other words, considering the fact that previous studies applying the Andersen model in Korea were biased to the use of dental and social-welfare services, this study explored and analyzed the predictors by focusing on health services utilization. Furthermore, the fact that this study derived the relative importance of need factors in health services utilization of outpatients and inpatients in Korea also has significance as the possible foundation for providing health services based on needs. Moreover, verifying the general characteristics of outpatients and inpatients by focusing on their health services utilization provides the baseline data for establishing health service policies and programs with regard to the recently increasing interest in health services 28, 29, 30.
- Based on the research findings, this study suggests the practical implications for providing health services for outpatients and inpatients. First, it is important to assess the needs in the process of providing services for outpatients and inpatients who visit the medical institution. This study proved that the need factors of inpatients were powerful factors explaining health services utilization [29]. It is necessary to consider this fact and pay close attention to how the level of need changes in the actual field. Second, it is necessary to consider the general characteristics when developing health service policies and programs for outpatients and inpatients, and providing services in the field. The level of health services utilization may vary based on education level; thus, it is necessary to ensure that information on services utilization or procedures can be obtained easily and sufficiently. Furthermore, social discrimination or stigma may be greater, depending on chronic illness or disability 31, 32; thus, there must be careful interventions so that the patients do not receive limited services due to frustration or intimidation.
Discussion
- The authors have no conflicts of interest to declare.
Conflicts of interest
- 1. Phillips K.A., Morrison K.R., Andersen R., Aday L.A.. Understanding the context of healthcare utilization: assessing environmental and provider-related variables in the behavioral model of utilization. Health Serv Res 33(3). 1998 Aug;571−596. PMID: 9685123.PubMed
- 2. Glanz K., Lewis F.M., Rimer B.K.. Health behavior and health education: theory, research, and practice. 1990. Jossey-Bass; San Francisco: pp 23−25.
- 3. Padgett D., Struening E.L., Andrews H.. Factors affecting the use of medical, mental health, alcohol, and drug treatment services by homeless adults. Med Care 28(9). 1990 Sep;805−821. PMID: 2402175.ArticlePubMed
- 4. Aday L.A., Andersen R.. A framework for the study of access to medical care. Health Serv Res 9(3). 1974;208−220. PMID: 4436074.PubMedPMC
- 5. Andersen R., Smedby B., Anderson O.W.. Medical care use in Sweden and the United States: a comparative analysis of systems and behavior. 1970. Center for Health Administration Studies; pp 34−61.
- 6. Hurd M.D., McGarry K.. Medical insurance and the use of health care services by the elderly. J Health Econ 16(2). 1997 Apr;129−154. PMID: 10169091.ArticlePubMed
- 7. Andersen R., Lewis S.Z., Giachello A.L., Aday L.A., Chiu G.. Access to medical care among the Hispanic population of the southwestern United States. J Health Soc Behav 22(1). 1981 Mar;78−89. PMID: 7240708.ArticlePubMed
- 8. Gelberg L., Andersen R.M., Leake B.D.. The behavioral model for vulnerable populations: application to medical care use and outcomes for homeless people. Health Serv Res. 34(6). 2000 Feb;1273−1302. PMID: 10654830.PubMed
- 9. Mendenhall A.N.. Predictors of service utilization among youth diagnosed with mood disorders. J Child Family Stud 21(4). 2012 Aug;603−611.Article
- 10. Lindamer L.A., Liu L., Sommerfeld D.H.. Predisposing, enabling, and need factors associated with high service use in a public mental health system. Adm Policy Ment Health 39(3). 2012 May;200−209. PMID: 21533848.ArticlePubMed
- 11. Diehr P., Yanez D., Ash A., Hornbrook M., Lin D.. Methods for analyzing health care utilization and costs. Annu Rev Public Health 20(1). 1999;125−144. PMID: 10352853.ArticlePubMed
- 12. Barrett B., Young M.S.. Past-year acute behavioral health care utilization among individuals with mental health disorders: results from the 2008 National Survey on Drug Use and Health. J Dual Diagn 8(1). 2012;19−27.Article
- 13. Andersen R., Newman J.F.. Societal and individual determinants of medical care utilization in the United States. Milbank Q 83(4). 2005 Dec;1−28.Article
- 14. Stein J.A., Andersen R., Gelberg L.. Applying the Gelberg–Andersen behavioral model for vulnerable populations to health services utilization in homeless women. J Health Psychol 12(5). 2007 Sep;791−804. PMID: 17855463.ArticlePubMed
- 15. Stein J.A., Andersen R.M., Robertson M., Gelberg L.. Impact of hepatitis B and C infection on health services utilization in homeless adults: a test of the Gelberg–Andersen behavioral model for vulnerable populations. Health Psychol 31(1). 2012 Jan;20−30. PMID: 21574705.ArticlePubMed
- 16. Schomerus G., Appel K., Meffert P.J.. Personality-related factors as predictors of help-seeking for depression: a population-based study applying the behavioral model of health services use. Soc Psychiatry Psychiatr Epidemiol 48(11). 2013 Nov;1809−1817. PMID: 23266663.ArticlePubMed
- 17. Andersen R.M., Davidson P., Ganz P.. Symbiotic relationships of quality of life, health services research and other health research. Qual Life Res 3(5). 1994 Oct;365−371. PMID: 7841969.ArticlePubMed
- 18. Newman J.F. Jr.. The utilization of dental services. 1971. Emory University; pp 14−23.
- 19. Walter F., Webster A., Scott S., Emery J.. The Andersen model of total patient delay: a systematic review of its application in cancer diagnosis. J Health Serv Res Policy 17(2). 2012 Apr;110−118. PMID: 22008712.ArticlePubMed
- 20. Van Doorslaer E., Wagstaff A., Van der Burg H.. Equity in the delivery of health care in Europe and the US. J Health Econ 19(5). 2000 Sep;553−583. PMID: 11184794.ArticlePubMed
- 21. Lee H., Lee T., Jeon B., Jung Y.. Factors related to health care utilization in the poor and the general populations. Korean J Health Econ Policy 15(1). 2009;79−106.
- 22. Andersen R., Kravits J., Anderson O.W.. The public's view of the crisis in medical care: an impetus for changing delivery systems? Econ Business Bull 24(1). 1971;44−52.
- 23. Andersen R.M.. Revisiting the behavioral model and access to medical care: does it matter? J Health Soc Behav 36(1). 1995 Mar;1−10. PMID: 7738325.ArticlePubMed
- 24. Kasl S.V., Cobb S.. Health behavior, illness behavior and sick role behavior: I. Health and illness behavior. Arch Environ Health 12(2). 1966 Feb;246−266. PMID: 5322534.ArticlePubMed
- 25. Gold M.. A crisis of identity: the case of medical sociology. J Health Soc Behav 18(2). 1977 Jun;160−168. PMID: 881546.ArticlePubMed
- 26. Lemming M.R., Calsyn R.J.. Ability of the behavioral model to predict utilization of five services by individuals suffering from severe mental illness and homelessness. J Soc Serv Res 32(3). 2006;153−172.Article
- 27. Afifi A.A., Kotlerman J.B., Ettner S.L., Cowan M.. Methods for improving regression analysis for skewed continuous or counted responses. Annu Rev Public Health 28:2007 Apr;95−111. PMID: 17112339.ArticlePubMed
- 28. Becker M.H., Maiman L.A.. Sociobehavioral determinants of compliance with health and medical care recommendations. Med Care 13(1). 1975 Jan;10−24. PMID: 1089182.ArticlePubMed
- 29. Rosenstock I.M., Strecher V.J., Becker M.H.. Social learning theory and the health belief model. Health Educ Q 15(2). 1988 Jun;175−183. PMID: 3378902.ArticlePubMed
- 30. Smith G.H. III, Scheid T.L.. An Application of the Andersen Model of Health Utilization to the Understanding of the Role of Race-Concordant Doctor–Patient Relationships in Reducing Health Disparities. Social Determinants, Health Disparities and Linkages to Health and Health Care (Research in the Sociology of Health Care, Volume 31). 31:2014. Emerald Group Publishing Limited.; England: pp 187−214.
- 31. Lachenbruch P.A.. Analysis of data with excess zeros. Stat Methods Med Res 11(4). 2002 Aug;297−302. PMID: 12197297.ArticlePubMed
- 32. Babitsch B., Gohl D., von Lengerke T.. Re-revisiting Andersen's behavioral model of health services use: a systematic review of studies from 1998–2011. Psychosoc Med 9:2012 Oct;1−15.
References
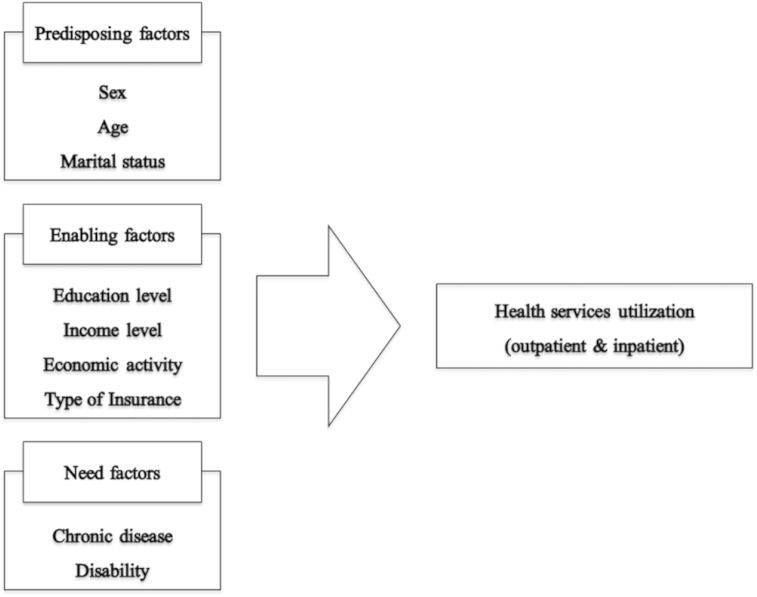
Table 1Definition of dependent variables.
| Variable | Definition |
|---|---|
| Outpatient | 0 = No |
| 1 = Yes | |
| Inpatient | 0 = No |
| 1 = Yes |
Table 2Classification and definition of independent variables.
Table 3Demographic analysis.
Table 4Frequency of the dependent variable.
| 2010 | 2011 | 2012 | ||
|---|---|---|---|---|
| Outpatient | No | 23 (0.2) | 19 (0.2) | 11 (0.1) |
| Yes | 11,339 (99.8) | 11,142 (99.8) | 10,603 (99.9) | |
| Inpatient | No | 9,748 (85.8) | 9,588 (85.9) | 9,036 (85.1) |
| Yes | 1,614 (14.2) | 1,573 (14.1) | 1,578 (14.87) |
Table 5Factors related to health services utilization of outpatients: logistic regression.
Table 6Factors related to health services utilization of inpatients: logistic regression.
Figure & Data
References
Citations
Citations to this article as recorded by 
- Prevalence and predictors of help-seeking behavior among post-partum women with urinary incontinence in China and Indonesia: A cross-sectional survey based on Andersen Help-Seeking Model
Surui Liang, Zhaoying Chen, Wenjun Tang, Esti Andarini, Lin Kou, Yan Li, Wenzhi Cai
Midwifery.2024; 128: 103885. CrossRef - Ethnic heterogeneity and healthcare utilization: The mediating role of poverty in Ghana
Opoku Adabor, Enock Kojo Ayesu
Review of Economics of the Household.2024;[Epub] CrossRef - Health insurance and hospitalisation duration: empirical evidence from Ghana’s national health insurance scheme
Samuel Sekyi, James Dickson Fiagborlo, Gloria Essilfie
Cogent Public Health.2024;[Epub] CrossRef - Mental Health Services Utilization by the Population That Suffered Water Supply Interruption Following Mariana Dam Failure (Brazil)
Marcelo F. Dell’Aringa, Gabriel E. Correa-Oliveira, Francesco Della Corte, Luca Ragazzoni, Elaine S. Miranda, Ives Hubloue, Virginia Murray, Francesco Barone-Adesi
Disaster Medicine and Public Health Preparedness.2023;[Epub] CrossRef - Use of Assistive Technologies and Alternative Means by Older People: The “Actional Model of Older People´s Coping with Health-Related Declines”
Diana Abri, Thomas Boll
Integrative Psychological and Behavioral Science.2023; 57(3): 960. CrossRef - Outpatient Service Use in Korean Older Adult Women with Degenerative Arthritis Based on Andersen’s Model
Soyoung Jang, Eunyoung E. Suh
Geriatrics.2023; 8(1): 9. CrossRef - Understanding Unmet Care Needs of Rural Older Adults with Chronic Health Conditions: A Qualitative Study
Dennis Asante, Craig S. McLachlan, David Pickles, Vivian Isaac
International Journal of Environmental Research an.2023; 20(4): 3298. CrossRef - Elderly people’s preferences for healthcare facilities in Shanghai: gender features and influencing factor analysis
Shangguang Yang, Luxue Liu, Chunlan Wang, Kevin Lo, Danyang Wang
BMC Public Health.2023;[Epub] CrossRef - The efficient moral hazard effect of health insurance: Evidence from the consolidation of urban and rural resident health insurance in China
Yao Li, Lei Li, Junxia Liu
Social Science & Medicine.2023; 324: 115884. CrossRef - Use and impact of a novel nurse-led consultation model in a palliative care consultation service for terminally ill cancer patients in Taiwan: an 11-year observational study
Lian-Shin Lin, Ling-Hui Huang, Szu-Pei Chien, Chun-Li Wang, Lung-Chun Lee, Chung-Chieh Hu, Pi-Shan Hsu, Wei-Min Chu
Supportive Care in Cancer.2023;[Epub] CrossRef - System, institutional, and client-level factors associated with formal healthcare utilisation among older adults with low income under a social protection scheme in Ghana
Williams Agyemang-Duah, Dennis Asante, Joseph Oduro Appiah, Anthony Kwame Morgan, Isaac Verberk Mensah, Prince Peprah, Anthony Acquah Mensah
Archives of Public Health.2023;[Epub] CrossRef - A qualitative investigation into pregnancy experiences and maternal healthcare utilisation among adolescent mothers in Nigeria
Christiana A. Alex-Ojei, Clifford O. Odimegwu, Lorretta F. C. Ntoimo
Reproductive Health.2023;[Epub] CrossRef - Determinants of province-based health service utilization according to Andersen’ s Behavioral Model: a population-based spatial panel modeling study
Yu Xin, Xiaohui Ren
BMC Public Health.2023;[Epub] CrossRef - Differences in healthcare service utilization between older adults with and without dementia: a cross-sectional study in Shandong, China
Yu Gao, Jingjie Sun, Wengui Zheng, Weiqin Cai, Qianqian Gao, Juncheng Lyu, Xiaomeng Zheng, Runguo Gao, Lihong Ji, Qi Jing
Journal of Public Health.2023;[Epub] CrossRef - Contribution of private health services to universal health coverage in low and middle‐income countries: Factors affecting the use of private over public health services in Vietnam
Mai P. Nguyen, Amina Tariq, Reece Hinchcliff, Hoat N. Luu, Michael P. Dunne
The International Journal of Health Planning and M.2023; 38(6): 1613. CrossRef - Income and health insurance effects on modern health-seeking behaviours in rural Ghana: nature and extent of bias involved
Samuel Sekyi, Philip Kofi Adom, Emmanuel Agyapong Wiafe
International Journal of Social Economics.2023;[Epub] CrossRef - Health Care Utilization in Russia: Public Health Survey Findings
Arsen P. Davitadze, Ekaterina A. Aleksandrova, Alexandra V. Kupera, Tatiana I. Rodionova, Alina R. Khabibullina, Andrey A. Svistunov, Victor V. Fomin
ЗДОРОВЬЕ НАСЕЛЕНИЯ И СРЕДА ОБИТАНИЯ - ЗНиСО / PUBL.2023; : 7. CrossRef - Özel Sağlık Sigortasına Sahip Bireylerin Sağlık Hizmeti Kullanımının Değerlendirilmesi
Özden GÜDÜK, Emre İŞCİ, Mehveş TARIM
Adnan Menderes Üniversitesi Sağlık Bilimleri Fakül.2023; 7(3): 541. CrossRef - Understanding the Impact of Community Family Physician Contracting (CFPC) on Community Medical Resources Consumption: A Case Study from Beijing in China
Lele Li, Xiaotong He, Yifeng Xian, Tushar Singh
Health & Social Care in the Community.2023; 2023: 1. CrossRef - Examining healthcare needs and decisions to seek health services among Venezuelan migrants living in Trinidad and Tobago using Andersen’s Behavioral Model
Nyla Lyons, Brendon Bhagwandeen
Frontiers in Public Health.2023;[Epub] CrossRef - Gender differences in caregiver attitudes and unmet needs for activities of daily living (ADL) assistance among older adults with disabilities
Selin Woo, Ying Cui, Suyeon Kim, Mankyu Choi
BMC Geriatrics.2023;[Epub] CrossRef - Social Gradient in Maternal Healthcare Utilization in Malawi: Analysis of Trends
Joe Maganga Zonda, Suchuan Yu
Journal of Asian and African Studies.2023;[Epub] CrossRef - Heterogeneous effects of national health insurance scheme on healthcare utilisation: evidence from Ghana
Samuel Sekyi, Senia Nhamo, Edinah Mudimu
International Journal of Social Economics.2023;[Epub] CrossRef - Health Services Utilization among Older Adults in Pokhara Metropolitan City
Isha Karmacharya, Saruna Ghimire, Kshitiz Bhujel, Asmita Shrestha Dhauvadel, Shraddha Adhikari, Subash Baral, Naveen Shrestha
Journal of Aging & Social Policy.2022; 34(4): 568. CrossRef - Factors associated with the quality of mental health services and consumers' functionality using tertiary‐based services
Eric Badu, Anthony P. O'Brien, Rebecca Mitchell, Akwasi Osei
Perspectives in Psychiatric Care.2022; 58(2): 592. CrossRef - Health care utilization in very advanced ages: A study on predisposing, enabling and need factors
Daniela Brandão, Constança Paúl, Oscar Ribeiro
Archives of Gerontology and Geriatrics.2022; 98: 104561. CrossRef - Choosing a health behaviour theory or model for related research projects: a narrative review
Getahun K Beyera, Jane O’Brien, Steven Campbell
Journal of Research in Nursing.2022; 27(5): 436. CrossRef - The Urban-Rural Disparities and Associated Factors of Health Care Utilization Among Cancer Patients in China
Haipeng Wang, Xingxing Hua, Nengliang Yao, Nan Zhang, Jialin Wang, Roger Anderson, Xiaojie Sun
Frontiers in Public Health.2022;[Epub] CrossRef - Effect of religious beliefs on bone graft selection for oral and maxillofacial surgery in Saudi Arabia
Ahmad Assari, Maram Hani, Hajar Qaid, Bushra Omar, Lamia Aleid
Journal of Stomatology, Oral and Maxillofacial Sur.2022; 123(5): e563. CrossRef - Effect of financial services access on health services utilisation among rural older adults in Ghana
Dennis Asante, Bismark Asante, Bismark Addai, Williams Agyemang‐Duah, Martinson Ankrah Twumasi
International Journal of Social Welfare.2022; 31(4): 492. CrossRef - The relationship between internal and external factors about the outpatients’ choice of hospital: A cross‐sectional study from Jiaxing City, China
Mingming Yu, Guoyang Zhao, Dan Tang
Health Science Reports.2022;[Epub] CrossRef - Factors influencing health service utilization among mothers for under-five children: A cross-sectional study in Khulna district of Bangladesh
Shahinur Akter, A. K. M. Anisur Rahman
PLOS ONE.2022; 17(9): e0274449. CrossRef - Unmet health care needs: factors predicting satisfaction with health care services among community-dwelling Canadians living with neurological conditions
Tamara Chambers-Richards, Batholomew Chireh, Carl D’Arcy
BMC Health Services Research.2022;[Epub] CrossRef - Joint modelling of health insurance, healthcare utilisation, healthcare expenditure and health status: Evidence from Ghana
Samuel Sekyi
Cogent Public Health.2022;[Epub] CrossRef - District division administrative disaggregation data framework for monitoring leaving no one behind in the National Health Insurance Fund of Sudan: achieving sustainable development goals in 2030
Ashraf Mansour, Nithat Sirichotiratana, Chukiat Viwatwongkasem, Mahmud Khan, Samrit Srithamrongsawat
International Journal for Equity in Health.2021;[Epub] CrossRef - Gender Differences in Health Care Utilization Among the Elderly
Gordana Gajovic, Katarina Janicijevic, Dragana Andric, Olivera Djurovic, Svetlana Radevic
Serbian Journal of Experimental and Clinical Resea.2021; 22(3): 195. CrossRef - Financial Innovation in Digital Payment with WeChat towards Electronic Business Success
Yuk Ming Tang, Ka Yin Chau, Luchen Hong, Yun Kit Ip, Wan Yan
Journal of Theoretical and Applied Electronic Comm.2021; 16(5): 1844. CrossRef - The determinants of caregiver use and its costs for elderly inpatients in Korea: a study applying Andersen’s behavioral model of health care utilization and replacement cost method
Jennifer Ivy Kim, Sukil Kim
BMC Health Services Research.2021;[Epub] CrossRef - SAĞLIK HİZMETLERİ KULLANIMINI ETKİLEYEN FAKTÖRLERİN PANEL VERİ ANALİZİ İLE BELİRLENMESİ
Faruk YILMAZ, Canser BOZ, Özgür İNCE
Mehmet Akif Ersoy Üniversitesi İktisadi ve İdari B.2021; 8(2): 577. CrossRef - Determinants of Healthcare Use Based on the Andersen Model: A Systematic Review of Longitudinal Studies
André Hajek, Benedikt Kretzler, Hans-Helmut König
Healthcare.2021; 9(10): 1354. CrossRef - Factors Associated with Adherence to Follow-up Among Patients with Depressive Disorders in a Collaborative Care Program in Iran
Atefeh Mohammadjafari, Maryam Tabatabaee, Vandad Sharifi, Fattaneh Abdi Masouleh, Farid Abolhassani
Iranian Journal of Psychiatry and Behavioral Scien.2021;[Epub] CrossRef - Health service utilisation among African migrants in China: a nationwide cross-sectional study
Ming Zhou Xiong, Peizhen Zhao, Xia Zou, Brian Hall, Honghua Cao, Cheng Wang
BMJ Open.2021; 11(9): e046746. CrossRef - Effect of Religious Beliefs on Bone Graft Selection for Oral and Maxillofacial Surgery in Saudi Arabia
Ahmad Assari, Maram Hani, Hajar Qaid, Bushra Omar, Lamia Aleid
SSRN Electronic Journal.2021;[Epub] CrossRef - Inequity in palliative care service full utilisation among patients with advanced cancer: a retrospective Cohort study
Daniela D’Angelo, Marco Di Nitto, Diana Giannarelli, Ileana Croci, Roberto Latina, Anna Marchetti, Caterina Magnani, Chiara Mastroianni, Michela Piredda, Marco Artico, Maria Grazia De Marinis
Acta Oncologica.2020; 59(6): 620. CrossRef - Unmet Medical Needs of Patients with Benign Prostate Enlargement
Munjae Lee, Sewon Park, Mankyu Choi, Kyu-Sung Lee
Journal of Clinical Medicine.2020; 9(4): 895. CrossRef - Predictors of healthcare utilisation among poor older people under the livelihood empowerment against poverty programme in the Atwima Nwabiagya District of Ghana
Williams Agyemang-Duah, Charles Peprah, Francis Arthur-Holmes
BMC Geriatrics.2020;[Epub] CrossRef - Patient-perceived service needs and health care utilization in people with type 2 diabetes
Yunxia Ni, Suzhen Liu, Jiping Li, Simin Li, Ting Dong
Medicine.2020; 99(21): e20322. CrossRef - Outpatient Visits among Older Adults Living Alone in China: Does Health Insurance and City of Residence Matter?
Jianyun Wang, Yaolin Pei, Renyao Zhong, Bei Wu
International Journal of Environmental Research an.2020; 17(12): 4256. CrossRef - The healthcare seeking behaviour of adult patients with asthma at Chitungwiza Central Hospital, Zimbabwe
Pisirai Ndarukwa, Moses J. Chimbari, Elopy N. Sibanda, Tafadzwa Madanhire
Asthma Research and Practice.2020;[Epub] CrossRef - Inequality in Health Services for Internal Migrants in China: A National Cross-Sectional Study on the Role of Fund Location of Social Health Insurance
Qiang Yao, Chaojie Liu, Ju Sun
International Journal of Environmental Research an.2020; 17(17): 6327. CrossRef - Perceptions of Health Care Use in Germany during the COVID-19 Pandemic
André Hajek, Freia De Bock, Lothar H. Wieler, Philipp Sprengholz, Benedikt Kretzler, Hans-Helmut König
International Journal of Environmental Research an.2020; 17(24): 9351. CrossRef - Household wealth and maternal health: evidence from Ghana
Christian Kwaku Osei, Edward Nketiah-Amponsah, Monica Puoma Lambon-Quayefio
International Journal of Social Economics.2020; 48(1): 63. CrossRef - eHealth literacy and beliefs about medicines among Taiwanese college students: cross-sectional study (Preprint)
Chiao Ling Huang, Chia-Hsun Chiang, Shu Ching Yang
JMIR Medical Informatics.2020;[Epub] CrossRef - Predictors of hospital readmissions in internal medicine patients: Application of Andersen's Model
Sıdıka Kaya, Gulay Sain Guven, Seda Aydan, Onur Toka
The International Journal of Health Planning and M.2019; 34(1): 370. CrossRef - Pathways to mental health treatment in Ghana: Challenging biomedical methods from herbal- and faith-healing perspectives
Eric Badu, Rebecca Mitchell, Anthony Paul O’Brien
International Journal of Social Psychiatry.2019; 65(6): 527. CrossRef - Factors influencing healthcare use among poor older females under the Livelihood Empowerment Against Poverty programme in Atwima Nwabiagya District, Ghana
Williams Agyemang-Duah, Justice Kufour Owusu-Ansah, Charles Peprah
BMC Research Notes.2019;[Epub] CrossRef - Emergency Department Utilization among Underserved African American Older Adults in South Los Angeles
Mohsen Bazargan, James Smith, Sharon Cobb, Lisa Barkley, Cheryl Wisseh, Emma Ngula, Ricky Thomas, Shervin Assari
International Journal of Environmental Research an.2019; 16(7): 1175. CrossRef - Factors associated with the intention to use adult preventive health services in Taiwan
Yi‐Lin Hsieh, Fang‐Hsin Lee, Shu‐Chuan Chen, Jing‐Shia Tang
Public Health Nursing.2019; 36(5): 631. CrossRef - Gender differences in health expenditure determinants: A follow-up study
Cecilia Quercioli, Francesca Nisticò, Gabriele Messina, Mauro Maccari, Massimo Barducci, Giovanni Carriero, Nicola Nante
Health Care for Women International.2019; 40(1): 33. CrossRef - Prevalence and Patterns of Health Care Use Among Poor Older People Under the Livelihood Empowerment Against Poverty Program in the Atwima Nwabiagya District of Ghana
Williams Agyemang-Duah, Charles Peprah, Francis Arthur-Holmes
Gerontology and Geriatric Medicine.2019; 5: 233372141985545. CrossRef - Who Uses The Health Services More? A Descriptive Study of Excessive Users’ Profile and Causes
Golnoosh Aghili, Masoud Ferdosi, Mohammadreza Rezayatmand, Abbas Feizbakhsh, Hamid Reza Dehghani
Health Scope.2019;[Epub] CrossRef - Treatment Retention Among Patients Participating in Coordinated Specialty Care for First-Episode Psychosis: a Mixed-Methods Analysis
Jane E. Hamilton, Devika Srivastava, Danica Womack, Ashlie Brown, Brian Schulz, April Macakanja, April Walker, Mon-Ju Wu, Mark Williamson, Raymond Y. Cho
The Journal of Behavioral Health Services & Resear.2019; 46(3): 415. CrossRef - The predictors of treatment pathways to mental health services among consumers in Ghana
Anna Korley Nartey, Eric Badu, Peter Agyei‐Baffour, Naomi Gyamfi, Maxwell Preprah Opoku, Anthony Paul O'Brien, Rebecca Mitchell
Perspectives in Psychiatric Care.2019; 55(2): 300. CrossRef - Catastrophic Health Expenditures and Its Inequality in Households with Cancer Patients: A Panel Study
Munjae Lee, Kichan Yoon
Processes.2019; 7(1): 39. CrossRef - Patients’ perspectives regarding hospital visits in the universal health coverage system of Thailand: a qualitative study
Apichai Wattanapisit, Udomsak Saengow
Asia Pacific Family Medicine.2018;[Epub] CrossRef - The Health and Retirement Study: Analysis of Associations Between Use of the Internet for Health Information and Use of Health Services at Multiple Time Points
Hyunju Shim, Jennifer Ailshire, Elizabeth Zelinski, Eileen Crimmins
Journal of Medical Internet Research.2018; 20(5): e200. CrossRef - Associations of eHealth Literacy With Health Services Utilization Among College Students: Cross-Sectional Study
Yi Fang Luo, Shu Ching Yang, An-Sing Chen, Chia-Hsun Chiang
Journal of Medical Internet Research.2018; 20(10): e283. CrossRef - Type 2 diabetes, healthcare expenditures and its correlation with anthropometric factors and physical activity: 18-month follow-up in a Brazilian city
Monique Yndawe Castanho Araujo, Bruna Camilo Turi, Dayane Cristina Queiroz, Izabela dos Santos Ferro, Carolina Rodrigues Bortolatto, Jamile Sanches Codogno
Motriz: Revista de Educação Física.2018;[Epub] CrossRef - Dental hygienist attendance and its covariates in an ageing Swedish cohort
Anne N. Åstrøm, Gunnar Ekbäck, Sven Ordell, Stein A. Lie, Ferda Gulcan
European Journal of Oral Sciences.2017; 125(6): 487. CrossRef - Experiences with out-patient hospital service utilisation among older persons in the Asante Akyem North District- Ghana
Jonathan Bayuo
BMC Health Services Research.2017;[Epub] CrossRef
 PubReader
 Cite
Cite
