
Articles
- Page Path
- HOME > Osong Public Health Res Perspect > Volume 7(3); 2016 > Article
-
Original Article
Competitive Strategy for Successful National University Hospital Management in the Republic of Korea - Munjae Lee
-
Osong Public Health and Research Perspectives 2016;7(3):149-156.
DOI: https://doi.org/10.1016/j.phrp.2016.02.002
Published online: February 17, 2016
School of Health Policy and Management, College of Health Science, Korea University, Seoul, Korea
- ∗Corresponding author. emunjae@korea.ac.kr
• Received: December 22, 2015 • Accepted: February 10, 2016
Copyright © 2016 Korea Centers for Disease Control and Prevention. Published by Elsevier Korea LLC.
This is an open access article under the CC BY-NC-ND license (http://creativecommons.org/licenses/by-nc-nd/4.0/).
Abstract
-
Objectives
- This study provides information to aid decision making for managers and the staff of national university hospitals through analyzing their financial statements.
-
Methods
- In order to analyze the finances of national university hospitals, this study used the report of final accounts announced by each hospital from 2009 to 2012 as baseline data. The research participants were 10 national university hospitals.
-
Results
- According to the results of the analysis, most hospitals (except for a few) had medical expenses exceeding their medical revenues, resulting in a net deficit; however, there were significant differences amongst the hospitals. The result of adjustments based on a standard size of 100 beds showed that most hospitals had medical revenue deficits, and there were significant differences between hospitals in terms of medical revenues and medical costs.
-
Conclusion
- It is not clear whether an expansion of national university hospitals is always beneficial for increasing net revenues, and it is necessary to establish a differentiation strategy to increase profitability by securing financial soundness instead of externally-oriented growth.
- Recently, private medical institutions are focusing on growth and specialization to enhance competitiveness and improve business performance. However, public medical institutions that are striving to improve financial earnings, expenses, and performance are suffering the double torment of losing competitiveness while facing financial deterioration due to poor performance compared with private medical institutions. National university hospitals, which are typical public medical institutions, were established according to the Establishment of National University Hospitals Act for the purpose of nurturing medical personnel and advancing medical development through education, research, and treatment, and to act as a safety net for health and medical care. Thus, unlike private hospitals, national university hospitals must make an effort to gain public interest in medical care.
- Nonetheless, it is not easy to distinguish national university hospitals from private ones as the public role played by the former is not clearly defined. At the same time, they are struggling to compete with other general hospitals in the same region [1]. Since 2003, accessibility to medical institutions in the metropolitan area increased due to the opening of the Korean Train Express as well as the further development of local transportation. This has led to an increase in efforts made by big hospitals in Seoul, Korea to attract patients from other regions. As national university hospitals in these regions strive to prevent the loss of local patients, the competition among regions to secure patients is becoming more intense [1]. Due to this intensified competition, the hospital insolvency rate for the past 3 years has shown a constant increase: 6.7% in 2008, 7.0% in 2009, and 7.8% in 2010. Therefore, national university hospitals must pursue financial independence by achieving profitability at an optimum level through efficient management.
- Hospital profitability refers to successful business performance achieved by treating patients as well as carrying out other business activities during a fiscal year. Hospitals are different from general companies in that their unique characteristic of treating patients emphasizes their public social responsibility as much as their financial output. Thus, they must measure their business performance based not only on financials but also on qualitative features of services such as social benefits 2, 3, 4. However, as it is difficult to define or measure the output of medical services, a profitability index is most commonly used as the tool to measure hospital business performance [5].
- Hospital revenues are achieved through capital and finance management and are largely measured by the relationship between invested capital and profits, or medical revenues and profits [3]. Many studies have analyzed the profitability of hospitals. A study by Whitcomb and Cleverly [4] used return on assets as the hospital profitability index, while Lee and Choi [5] used net income to stockholder equity, net profit to total assets, and operating margin. A study by Coyne [6] used net profit to total assets, normal profit to total assets, and operating margin as the index, whereas Hibbard et al [7] used operating margin and net profit to gross revenues. Griffith et al [8] argued that operating margin and net profit to gross revenues are appropriate as profitability indices for Korean hospitals since such measurements compare medical revenues and expenses related to genuine medical practice and are most similar to the concept of hospital cost, take surplus and deficit into account by reflecting final business performance of a hospital, and include all details of the hospital.
- It is not easy to establish a theory that can deductively explain what factors influence hospital profitability. Therefore, inductive analysis is considered the best method to depict the determinants of profitability [2]. Overseas studies that demonstrated the determinants of profitability using these hospitals features were conducted by Cleverley [9], Trinh and O'Connor [10], Bolon [11], and Younis et al [12]. Since the 1990s, relevant studies in Korea have been actively conducted as the competition in the healthcare market has intensified. These include studies by Choi and Lee [13], Gapenski et al [14], Grosskopf and Valdmanis [15], Lilford and Pronovost [16], and Rosenthal et al [17].
- Objective analysis of management conditions must precede the development of survival strategies for university hospitals. Among previous studies that analyzed the profitability of university hospitals, Ozcan et al [18] studied the economic value add of university hospitals and determinants, and Chang and Tuckman [19] measured management efficiency using the Charnes, Cooper, and Rhodes model and the Banker, Charnes, and Cooper model in order to enhance the “publicness” of national university hospitals. Lindenauer et al [20] analyzed the structural characteristics of the financial ratios at private university hospitals, while Werner and Bradlow [21] comprehensively evaluated and analyzed the efficiency of 26 university hospitals using the Data Envelopment Analysis model, and then verified the difference between efficient and inefficient hospital groups.
- These studies analyzed financial data from specific years for these hospitals and thus did not accurately present a time-series management state. There is also almost no research that analyzes the finances of national university hospitals. Based on an awareness of this, this study aims to reflect the reality of the medical community and find strategic alternatives by analyzing the business performance of national university hospitals using data from 4 years from 2009 to 2012.
Introduction
- 2.1 Data
- To analyze the finances of national university hospitals, this study used the report of final accounts announced by each hospital from 2009 to 2012 as baseline data. The research participants were 10 university hospitals from 13 national university hospitals in Korea, excluding three dental hospitals, with a total of 9,483 beds. In the collected data, the report of final accounts from these hospitals consisted of a balance sheet, income statement, statement of appropriation of retained earnings, and endowment statement, from which this study used medical revenues and expenses given in the income statement as the key data for analysis. The income statements from university hospitals are categorized according to standard profit and loss classification schemes: medical revenues are revenues from hospitalization, outpatients, and incidental medical treatment, and medical expenses are labor costs, material costs, and administrative costs.
- 2.2 Measures
- This study limited the analysis of finances to medical revenues and expenses in order to determine whether the target hospitals could be managed profitably with only medical revenues. Therefore, revenues generated from sources other than medical treatment such as interest, rents, disposal of tangible assets, transferred-in money, contributions, and miscellaneous revenues were excluded from the analysis as were expenses from sources other than medical treatment such as interest, contributions, disposal of tangible assets, transferred-out money, miscellaneous losses, and supplementary payment of corporate taxes.
- To determine the business performance of national university hospitals more specifically, medical revenues, expenses, profits, and losses at each university hospital were analyzed. To cross correlate the hospitals according to the same standard, the figures were converted into a monthly average of medical revenues, expenses, and profit and loss for every 100 beds. Moreover, by conducting a per hospital ratio analysis of medical revenues and expenses for every 100 beds, the size of medical expenses compared with medical revenues was calculated. To determine the portion of prime medical costs per medical revenue element, this study analyzed the ratio of labor, material, and administrative costs to medical revenues. The analysis of the medical finances of national university hospitals was conducted through the following process: investigation of financial statements and general status of target hospitals, calculation of management analysis indicators, analysis of indicators, and interpretation.
Materials and methods
- 3.1 Annual average medical revenues and expenses per hospital
- The summary of medical revenues and expenses of each national university hospital is shown in Table 1. Adding up the national university hospitals for the investigation, the number of beds ranged from a minimum of 427 to a maximum of 1,790. The annual average medical revenues for the past 4 years ranged from a minimum of 50.09 billion Korean Won (KRW) to a maximum of 664.14 billion KRW, while the annual average medical expenses ranged from a minimum of 54.17 billion KRW to a maximum of 677.79 billion KRW. A brief examination of the relationship between the number of beds and medical profit and loss at national university hospitals showed that there seemed to be no special correlation between these. Two hospitals with 1,000 beds showed a surplus in medical profit and loss, while the other eight hospitals showed a deficit with medical expenses exceeding medical revenues (Figure 1).
- 3.2 Monthly average medical revenue and expense for 100 beds per hospital
- Table 2 shows the monthly average medical revenues converted on the basis of every 100 beds in order to measure profitability at the national university hospitals. From 2009 to 2012, the monthly average medical revenue for every 100 beds was estimated at 1.96 billion KRW. The figures varied among hospitals from a minimum of 900 million KRW to a maximum of 3.3 billion KRW (up to 3.7 times higher). Hospitals with medical revenues lower than the total 100-bed average for the past 4 years were Anuh, Cnuh, Gnuh, Hnuh, Inuh, and Jnuh (a total of 6), with the lowest figure at 900 million KRW, 54% lower than the average. However, hospitals with medical revenues higher than the total 100-bed average were Bnuh, Dnuh, Enuh, and Fnuh (a total of 4), among which Fnuh had the highest figure at 3.3 billion KRW, 68% higher than the average of 1.96 billion KRW. The analysis showed that there was a large gap of up to 367% in medical revenues among national university hospitals, depending on management conditions.
- An examination of the medical revenues for every 100 beds according to the size (total number of beds) of the national university hospitals showed that for the bigger hospitals in general, the medical revenues increased for every 100 beds as indicated in Figure 2. This indicates that the profitability of national university hospitals increases along with the size of the hospital. This underscores the fact that the current size of most national university hospitals is not enough to maximize profitability. In other words, big national university hospitals have a greater advantage in enhancing profitability than smaller ones.
- 3.3 Monthly average medical expense for 100 beds per hospital
- Table 3 shows the results of measuring the monthly average medical expenses for every 100 beds in the ten national university hospitals. The average for 2009–2012 was 1.99 billion KRW, ranging from a minimum of 960 million KRW to a maximum of 3.338 billion KRW and showing a gap of up to 348% among hospitals. Hospitals with medical expenses higher than the monthly average of 1.99 billion KRW for every 100 beds for the past 4 years were Bnuh, Dnuh, Enuh, and Fnuh (a total of 4). The monthly 100-bed medical expense average at Anuh, Cnuh, Gnuh, Hnuh, Inuh, and Jnuh was lower than the total average of 1.99 billion KRW.
- An examination of the medical expenses for every 100 beds according to the size (total number of beds) of the national university hospitals shows that the bigger the hospital, the more medical expenses for every 100 beds increased as indicated in Figure 3. The fact that both medical revenues and expenses simultaneously increase along with the size of national university hospitals, indicates that net profits do not increase with size.
- 3.4 Monthly average medical profit and loss and rate of return for 100 beds per hospital
- The monthly average medical profit and loss and rate of return for every 100 beds can be calculated by combining medical revenues and expenses, which are shown in Table 4 and Figure 4. All 10 national university hospitals showed overall loss for every 100 beds in the amount of 85 million KRW (−2.4%) in 2009 and 17 million KRW (−1.5%) in 2010, which changed to a profit of 5 million KRW (0.4%) in 2010 and back to a loss in 2012 of 99 million KRW (−4.7%), resulting in an average loss over the 4 years of 8.6 million KRW (−2.8%). Only two hospitals (Gnuh, Inuh) showed a surplus of average medical profit for the 4 years, while the rest showed a loss (Table 4). Figure 4 shows an analysis of the ratio of medical expense to medical revenue in order to examine the operating margin at each hospital. The average operating margin for 4 years at each hospital ranged from 12.1% to 4.6%, showing a huge gap (16.7%) among hospitals. A year-by-year examination shows that the hospitals showed a deficit of 2.4% and 1.5% in 2009 and 2009 respectively, and then a surplus of 0.4% in 2011, reverting to a deficit of 4.7% in 2012. This meant there was an average deficit of 2.3% compared with sales from 2009 to 2012. The increase in net profit for every 100 beds at the hospitals was insignificant (Figure 5).
- 3.5 Ratio of cost to sales per hospital
- The number of beds, medical profit and loss, and ratio of cost to sales are shown in Table 5. The analysis of the ratio of cost to sales showed that the average labor cost was 39.6%, material cost 34.6%, and administrative cost 27.7%; thus, the total average cost to sales was 101.9%, resulting in a loss. The ratio of cost to sales in each hospital was a minimum of 98.0% to a maximum of 105.5%. Three hospitals showed a profit, while the remaining seven hospitals showed a loss (Table 5). The ratio of labor cost among medical services ranged from 32.0% to 44.7%, material cost ranged from 31.9% to 38.7%, and administrative cost ranged from 20.8% to 33.9%. Most importantly, there was a huge gap among hospitals in fixed costs such as labor and administrative costs, rather than in variable costs such as materials. From this viewpoint, the findings of this study have significant implications. The size of each hospital and the ratio of cost to sales are shown in Figure 6. As the number of beds increased, labor cost also increased and the administrative cost decreased. The ratio of cost to sales according to medical profit and loss showed that hospitals with a surplus tended to have less administrative costs (Figure 7).
Results
- National university hospitals are important medical institutions that provide public medical services avoided by private medical institutions such as disease prevention and medical services for low-income and medically underprivileged citizens [22]. However, these hospitals face a difficult business environment both internally and externally due to the expansion of the healthcare market, the concentration of medical treatment in metropolitan areas with high-speed railways, and the enlargement of big hospitals. Financial difficulties at an organization indicate low profitability and it is impossible to maintain growth through reinvestment unless there is an optimum level of profit [23]. Therefore, it is necessary to determine the inefficiency of national university hospitals and establish efficiency plans so that they can accomplish their goals in providing public medical services, and control and manage high-level resources. Based on the awareness of this problem, this study investigated and analyzed medical profit and loss data and the ratio of cost to sales at 10 national university hospitals that disclosed their financial statements for 4 years from 2009 to 2012.
- The results of the analysis were as follows. First, the hospitals managed 472–1,790 beds, their average medical revenue over the 4 years ranged from a minimum of 50.09 billion KRW to a maximum of 664.14 billion KRW, and their average medical expenses ranged from a minimum of 54.17 billion KRW to a maximum of 677.79 billion KRW. With a few exceptions, most of the hospitals showed a deficit, with medical expenses exceeding revenues. Additionally, these results varied greatly among hospitals. Secondly, to compare the hospitals using the same standard, this study adjusted the figures on the basis of 100 beds and calculated the 4-year average of monthly medical revenues, which ranged from 900 million KRW to 3.3 billion KRW (average of 1.96 billion KRW). Medical expenses ranged from 950 million KRW to 3.33 billion KRW (average of 1.99 billion KRW). Hospitals, with the exception of Gnuh and Inuh, showed a deficit and the rate of return ranged from 12.1% to 4.6%. Thirdly, the analysis of the ratio of cost to sales showed that the average ratio of labor cost was 39.6%, material cost 34.6%, and administrative cost 27.7%. Thus, the total average ratio of cost to sales was 101.9%, resulting in a loss. Additionally, figures varied in each hospital, ranging from 98.0% to 105.5%. Only three hospitals, Fnuh, Gnuh, and Inuh, showed a profit. Fourthly, the monthly average medical profit and loss for every 100 beds showed that there was insufficient evidentiary material to determine the appropriateness of the size of national university hospitals.
- In summary, the medical profit and loss showed a deficit in most of the 10 national university hospitals, from 2009 to 2012 according to their business analysis, with differences in medical profit and loss and ratio of cost to sales among the hospitals. Moreover, the results of the analysis of the medical profit and loss for every 100 beds showed that it is inconclusive whether the enlargement of national university hospitals is beneficial to the enhancement of net profit. In other words, hospitals need to seek out differentiation strategies to secure financial solvency and enhance profitability rather than external growth. Based on the findings of this study, future research requires an analysis of the relevance of concretizing and categorizing the prime medical costs of national university hospitals to profitability. Moreover, in-depth research on the appropriateness of the size (number of beds) of national university hospitals must be conducted to present a rational plan for governance reform. Business analysis using financial ratios has the benefit of requiring less effort and cost in data collection. However, it is influenced by the appropriateness of financial statements since it is based on disclosed financial information. Moreover, it may be irrational to compare and evaluate the different methods of accounting since there are various alternatives. Therefore, if future research is conducted in consideration of the causal relationship among items by interpreting financial ratios after calculating these through financial statements, more significant research findings could be produced.
Discussion
- The authors have no conflicts of interest to declare.
Conflicts of interest
- 1. Hibbard J.H., Stockard J., Tusler M.. Does publicizing hospital performance stimulate quality improvement efforts? Health Affairs 22(2). 2003 Mar–Apr;84−94. PMID: 12674410.Article
- 2. Goldstein S.M., Ward P.T., Leong G.K.. The effect of location, strategy, and operations technology on hospital performance. J Oper Manag 20(1). 2002 Feb;63−75.Article
- 3. Lee M.. Financial Analysis of national university hospitals in Korea. Osong Public Health Res Perspect 6(5). 2015 Oct;310−317. PMID: 26730356.ArticlePubMed
- 4. Whitcomb M.E., Cleverly W.O.. Financial performance of academic medical center hospitals. Acad Med 68(10). 1993 Oct;729−731. PMID: 8397596.ArticlePubMed
- 5. Lee M., Choi M.. Analysis of structural relationships among financial ratios of regional public hospitals. Korean J Business Admin 26(6). 2013;1517−1530.
- 6. Coyne J.S.. Hospital performance in multihospital systems: a comparative study of system and independent hospitals. Health Serv Res 17(4). 1982 Winter;303−329. PMID: 7152957.PubMed
- 7. Hibbard J.H., Stockard J., Tusler M.. Hospital performance reports: impact on quality, market share, and reputation. Health Aff 24(4). 2005 Jul–Aug;1150−1160.Article
- 8. Griffith J.R., Alexander J.A., Jelinek R.C.. Measuring comparative hospital performance. J Healthc Manag 47(1). 2001 Jan–Feb;41−57. PMID: 11836965.Article
- 9. Cleverley W.O.. Improving financial performance: a study of 50 hospitals. Hosp Health Serv Adm 35(2). 1989 Summer;173−187. PMID: 10106557.
- 10. Trinh H.Q., O'Connor S.J.. The strategic behavior of US rural hospitals: A longitudinal and path model examination. Health Care Manage Rev 25(4). 2000 Fall;48−64. PMID: 11072631.
- 11. Bolon D.S.. Comparing mission statement content in for-profit and not-for-profit hospitals: does mission really matter? Hosp Top 83(4). 2005 Fall;2−9. PMID: 16425696.Article
- 12. Younis M., Younies H., Okojie F.. Hospital financial performance in the United States of America: a follow-up study. East Mediterr Health J 12(5). 2006 Sep;670−678. PMID: 17333808.PubMed
- 13. Choi M.K., Lee K.H.. A strategy for enhancing financial performance: A study of general acute care hospitals in South Korea. Health Care Manag 27(4). 2008 Oct–Dec;288−297.Article
- 14. Gapenski L.C., Vogel W.B., Langland-Orban B.. The determinants of hospital profitability. Hosp Health Serv Adm 38(1). 1992 Spring;63−80. PMID: 10127295.
- 15. Grosskopf S., Valdmanis V.. Measuring hospital performance: A non-parametric approach. J Health Econ 6(2). 1987;89−107. PMID: 10312167.ArticlePubMed
- 16. Lilford R., Pronovost P.. Using hospital mortality rates to judge hospital performance: a bad idea that just won't go away. BMJ 340(7753). 2010 Apr;955−957.Article
- 17. Rosenthal G.E., Hammar P., Way L.. Using hospital performance data in quality improvement: the Cleveland Health Quality Choice experience. Jt Comm J Qual Improv 24(7). 1998 Jul;347−360. PMID: 9689568.ArticlePubMed
- 18. Ozcan Y.A., Luke R.D., Haksever C.. Ownership and organizational performance: A comparison of technical efficiency across hospital types. Med Care 30(9). 1992 Sep;781−794. PMID: 1518311.ArticlePubMed
- 19. Chang C.F., Tuckman H.P.. The profits of not-for-profit hospitals. J Health Polit Policy Law 13(3). 1988;547−564. PMID: 3171114.ArticlePubMed
- 20. Lindenauer P.K., Remus D., Roman S.. Public reporting and pay for performance in hospital quality improvement. N Engl J Med 356(5). 2007 Feb;486−496. PMID: 17259444.ArticlePubMed
- 21. Werner R.M., Bradlow E.T.. Relationship between Medicare's hospital compare performance measures and mortality rates. JAMA 296(22). 2006 Dec;2694−2702. PMID: 17164455.ArticlePubMed
- 22. Ferrier G.D., Valdmanis V.. Rural hospital performance and its correlates. J Prod Anal 7(1). 1996 Mar;63−80.Article
- 23. Kaplan R.S.. Strategic performance measurement and management in nonprofit organizations. Nonprofit Manag Leadersh 11(3). 2001 Spring;353−370.Article
References
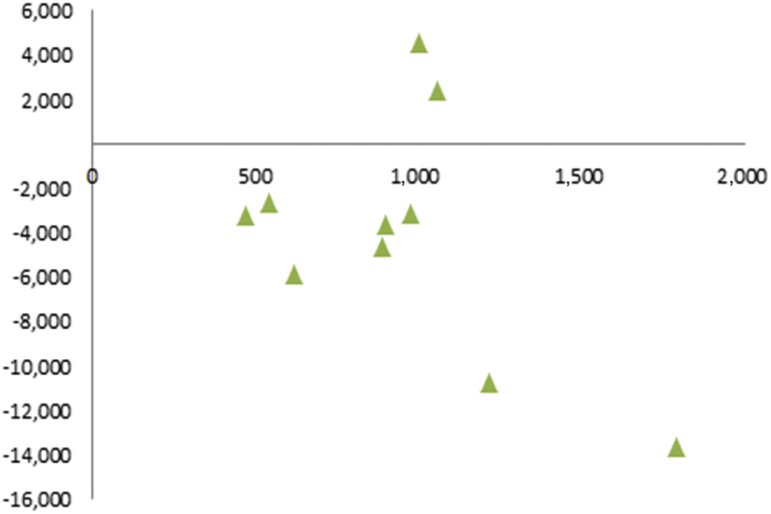
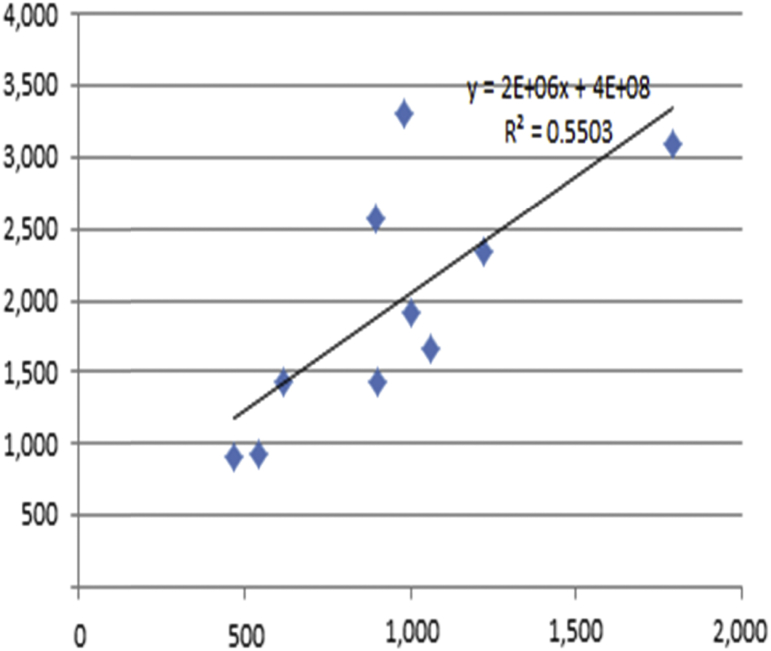

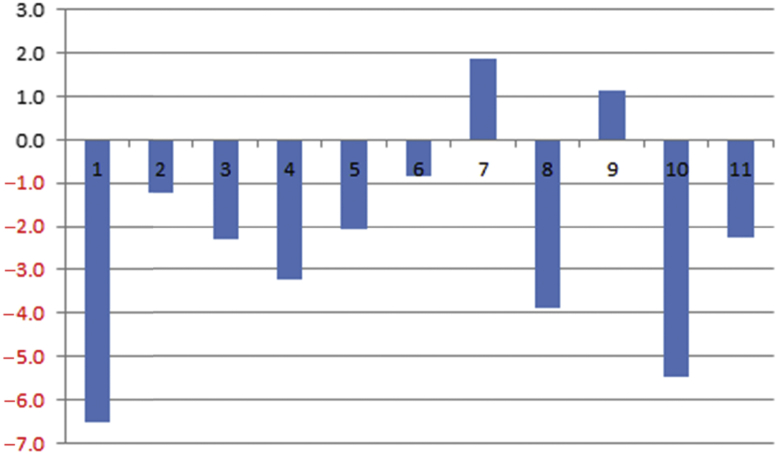
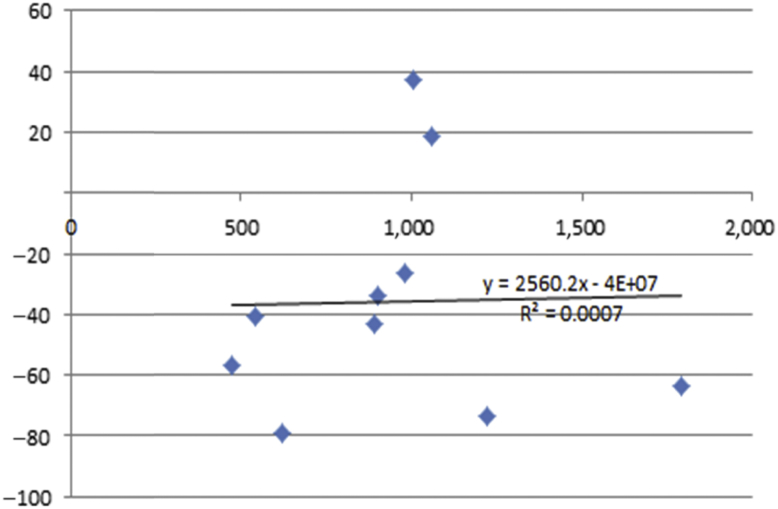
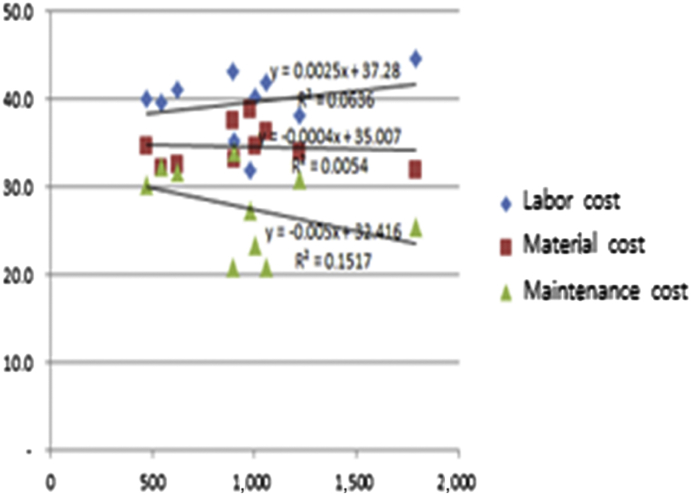
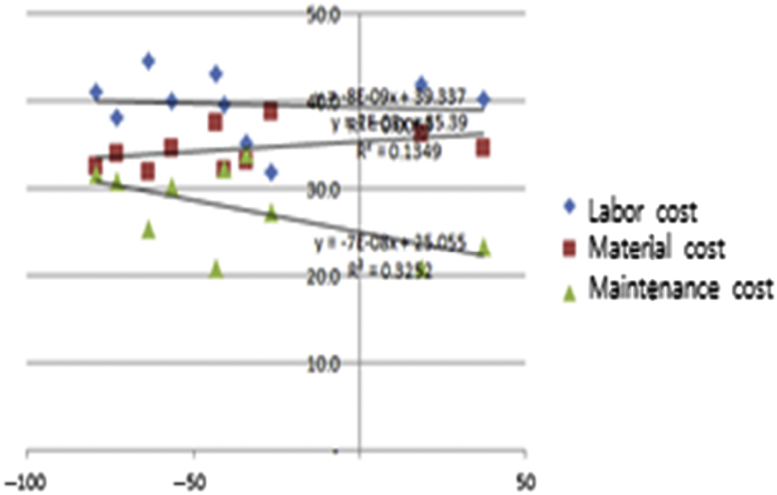
Table 1Annual average medical revenues and expenses per hospital.
Table 2Monthly average medical revenue (100 beds).
Table 3Monthly average medical expense (100 beds).
Table 4Monthly average medical profit and loss and rate of return for 100 beds per hospital.
Table 5Ratio of cost to sales per hospital.
Figure & Data
References
Citations
Citations to this article as recorded by 
- Internal Quality Process Management Evaluation in Higher Education by Students
Lucie Vnoučková, Hana Urbancová, Helena Smolová
Danube.2018; 9(2): 63. CrossRef - What Would Be a Better Strategy for National University Hospital Management?
Hae-Wol Cho, Chaeshin Chu
Osong Public Health and Research Perspectives.2016; 7(3): 139. CrossRef
 PubReader
 Cite
Cite


