Articles
- Page Path
- HOME > Osong Public Health Res Perspect > Volume 10(1); 2019 > Article
-
Original Article
Enteroparasitism and Risk Factors Associated with Clinical Manifestations in Children and Adults of Jalisco State in Western Mexico - María de la Luz Galván-Ramíreza, Ana Luisa Madriz-Elisondob, Cynthia Guadalupe Temores Ramírezc, Jorge de Jesús Romero Rameñob, Dania Araceli de la O Carrascob, Marco Antonio Cardona Lópezb
-
Osong Public Health and Research Perspectives 2019;10(1):39-48.
DOI: https://doi.org/10.24171/j.phrp.2019.10.1.08
Published online: February 28, 2019
aDepartment of Physiology, Health Sciences University Center, University of Guadalajara, Jalisco, Mexico
bDepartment of Medical Sciences and Life, University Center of the Cienega, University of Guadalajara, Jalisco, Mexico
cDepartment of Cellular and Molecular Biology, University Center of Biological and Agricultural Sciences. University of Guadalajara, Jalisco, Mexico
- *Corresponding author: María de la Luz Galván-Ramírez, Laboratory of Neurophysiology, Department of Physiology, Health Sciences University Center, University of Guadalajara, Jalisco, Mexico, E-mail: mlgalvanr@gmail.com
• Received: April 26, 2018 • Revised: December 8, 2018 • Accepted: February 6, 2019
Copyright ©2019, Korea Centers for Disease Control and Prevention
This is an open access article under the CC BY-NC-ND license (http://creativecommons.org/licenses/by-nc-nd/4.0/).
- 8,291 Views
- 123 Download
- 13 Crossref
Abstract
-
Objectives
- To determine the prevalence and risk factors associated with intestinal parasites in the population of San Juan Cosala, Jalisco, Mexico.
-
Methods
- A total of 277 samples from 104 participants were analysed using direct smear, flotation, formaldehyde/ethyl acetate, and modified Kinyoun’s acid-fast stain methods. The Graham method was applied only for samples from children under 12 years of age for the diagnosis of Enterobius vermicularis.
-
Results
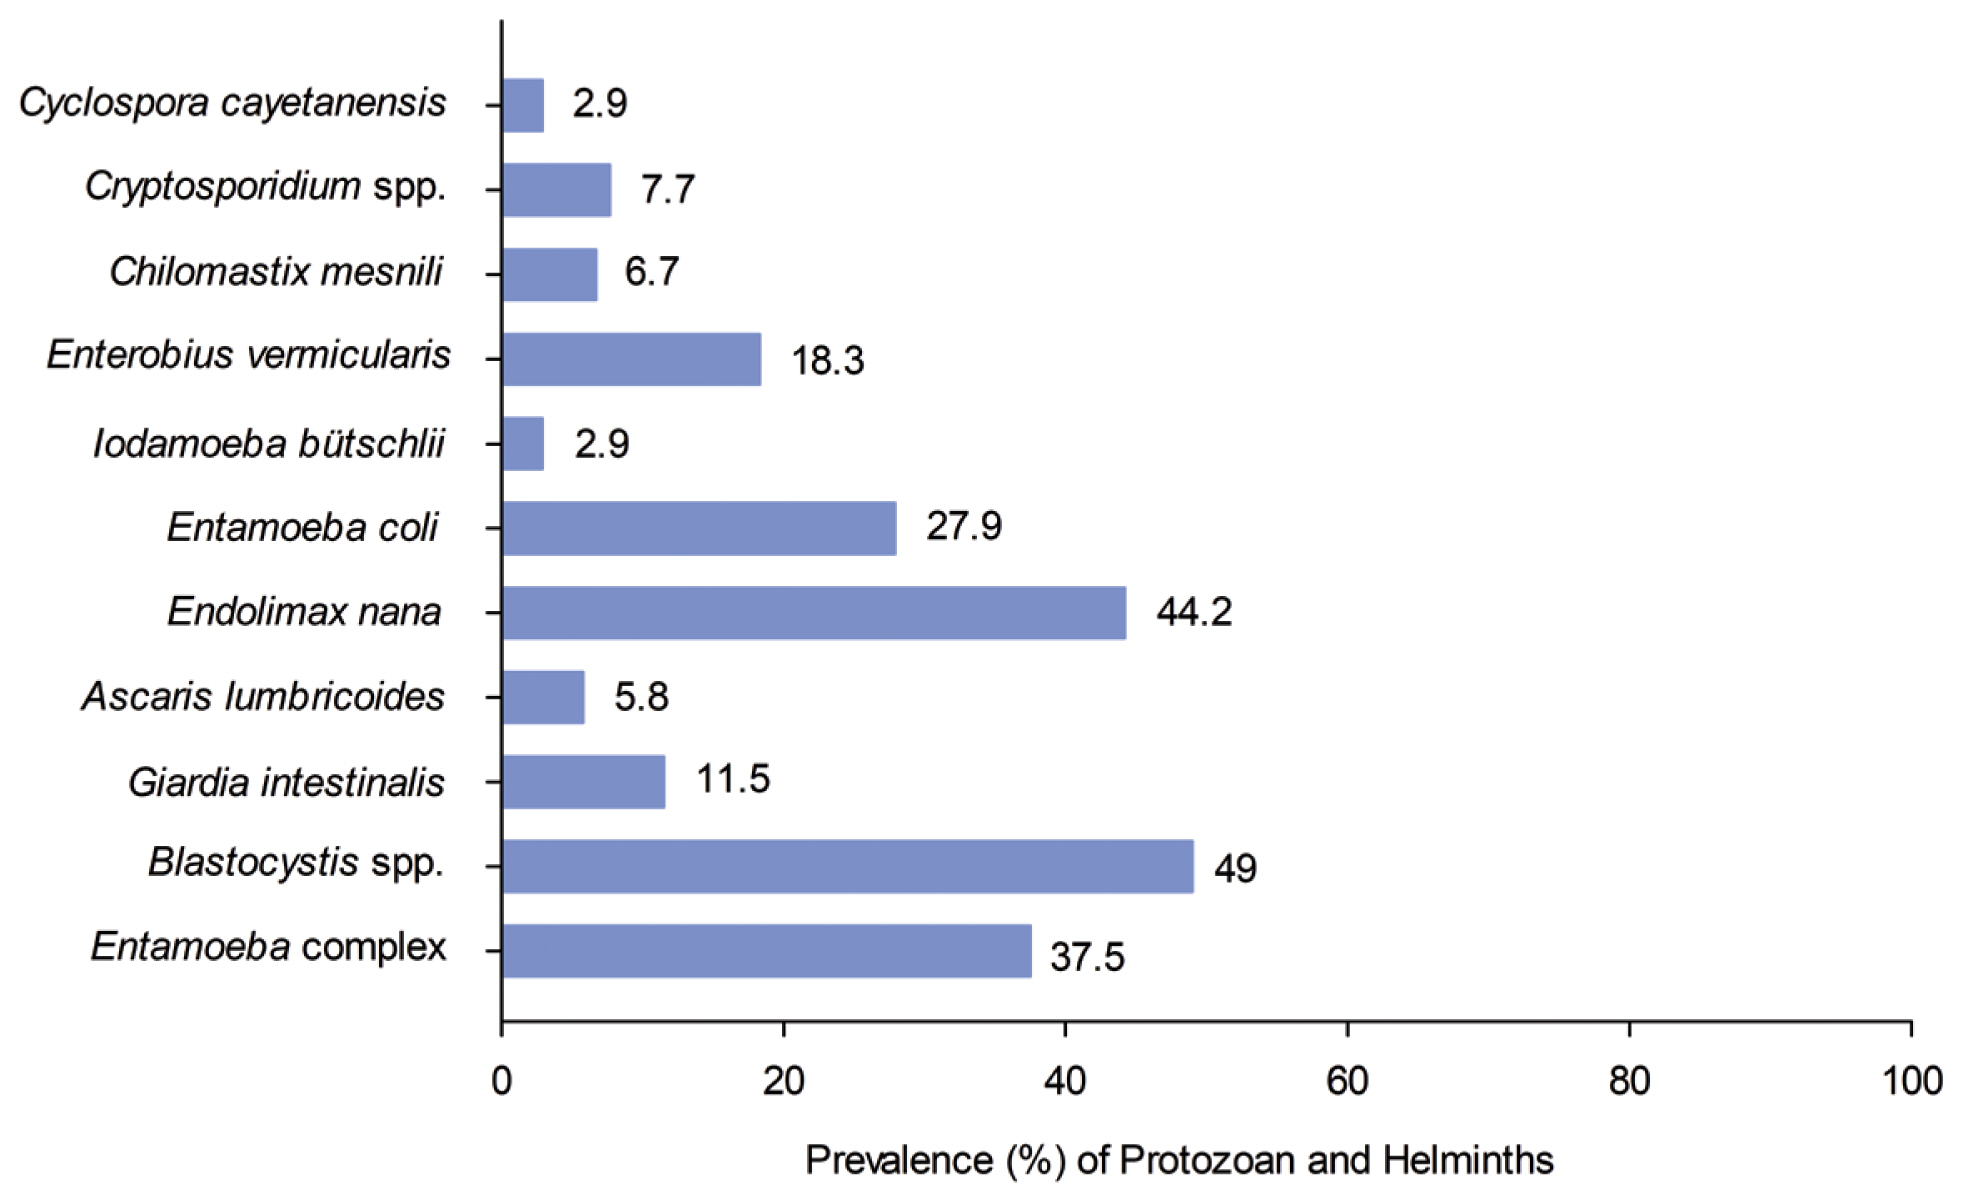
- The prevalence of parasite infections in the study population was 77.9% including: Entamoeba histolytica/E. dispar/E. moshkovskii/E. bangladeshi (37.5%), Giardia intestinalis (11.5%); commensals: Endolimax nana (44.2%), Entamoeba coli (27.9%), Chilomastix mesnili (6.7%) and Iodamoeba bütschlii, (2.9%); emerging intestinal protozoans: Blastocystis spp. (49%), Cryptosporidium spp. (7.7%) and Cyclospora cayetanensis (2.9%); and helminths: Enterobius vermicularis (18.3%) and Ascaris lumbricoides (5.8%). The results also showed that 58.64% of the studied population presented polyparasitism. A significant association was found between protozoan infections and housewives, and houses that were not built with concrete ceilings, brick walls and cement floors (p < 0.05).
-
Conclusion
- Polyparasitism was observed in over half the study population. The most prevalent parasite was Blastocystis spp, whilst the prevalence of helminths was less than that of protozoans. The risk factors for infection to intestinal parasites were being a housewife and not having solid brick, cement and concrete materials for house construction.
- Intestinal parasite infections are a public health problem worldwide, especially in developing countries, and in children under 5 years old [1]. Parasitic infections are amongst the top 20 causes of illness in Mexico with approximately 53% of the general population diagnosed with enteroparasites [2]. A study conducted in 2 states of Mexico (Sonora and Oaxaca) showed a prevalence of 47.2% in children [3]. The lack of knowledge to avoid transmission, poor hygiene, homes with lack of sanitation facilities, low family income, lower levels of education, overcrowding, living with animals and lower consumption of haem iron are factors that generate greater risk of acquisition of intestinal parasites [2,4,5].
- In the state of Jalisco, Mexico, there have been few studies on the prevalence of intestinal parasites. A study was conducted in the highlands area in the town of Arandas, showing similar prevalence as reported in Sonora and Oaxaca [3,4]. In the Cienega area in the town of San Pedro Itzicán, the prevalence of intestinal parasites was 60%. Egg counts were determined to establish treatment regimens and consequently its effectiveness (at a follow up appointment). San Juan Cosala, as well as San Pedro Itzicán, has a population located on the shores of Lake Chapala where there is a lack of sanitation facilities, thus increasing the risk of infection with intestinal parasites [6]. Information regarding prevalence, clinical manifestations and risk factors are of great importance in determining the necessary healthcare response. This is the first study to perform research on intestinal parasites in this location.
Introduction
- 1. Study area and population
- This study was performed in San Juan Cosala, a small town located on the lakeshore of Chapala, Jalisco state, Mexico, Global Positioning System (GPS) coordinates: longitude 103°19′56.90 W, latitude 20°17′04.50″ N. For this region, the average height above sea level is 1,530 metres, the town has a moderate and cool climate, and the rainfall and temperature ranges are 192 to 760 mm, and 19.5 to 30°C, respectively (Figure 1).
- The town has 6,973 inhabitants, 48.76% of which are male and 51.24% are female. In this study, a total of 104 people with ages ranging from 1 to 83 years old were eligible to participate in this study. The population lives in an overcrowded environment with poor hygiene and lack of sanitation. There are 1,325 houses; 1.3% of these have no sanitary facilities, 0.8% do not have electric lights, 5.5% have no potable water, 5.9% have dirty floors, 29% have one bedroom and 13% do not have a refrigerator. All of the study participants were beneficiaries of the Feed Operation Project, which is a civil association that helps poor people with food pantries, health information, some schooling and cultural programmes for the community of San Juan Cosala, Jalisco.
- 2. Questionnaire
- A structured questionnaire with open ended questions was used to collect information from the adults and parents of children regarding housing, personal hygiene and clinical manifestations. These data included information on age, gender, education, residence and number of household occupants, occupation, community residence site, and housing conditions (number of rooms and bathrooms). Characteristics of housing construction were analysed as a risk factor for infection with intestinal parasites. The aspects of the house included: ceilings, floors, walls and public services (sewer system, electric lighting, and plumbing). Health conditions that were analysed covered a history of symptoms including nausea, vomiting, diminution of appetite, abdominal and epigastric pain, watery, mucusy or bloody diarrhea, flatulence, constipation, tenesmus, anal pruritus, and distended abdomen. These conditions were studied in the population and reported along with frequency (daily, occasionally or never) for analysis with parasite tests (+/−). The questionnaire was performed, applied and reviewed by researchers and medical doctors from the Health Centre of that population.
- 3. Samples and laboratory methods
- From 104 participants, samples were obtained on 3 consecutive days; 11 only delivered 1 sample, 22 delivered 2 samples and 74 delivered 3 samples, for a total of 277 samples.
- Each stool sample met the acceptance criteria of the pre-analytical phase i.e. free of urine, soil, water and any contamination. The samples were transported and stored at 4°C. Then, samples were examined by direct fecal smear and iodine solution emulsification, concentration by flotation (zinc sulphate), and concentration by sedimentation (formaldehyde/ethyl acetate) [7].
- One drop of 5% iodine was placed on a slide. Approximately 2 mg of stool sample was smeared and then thoroughly immersed in the iodine solution. A coverslip was placed on top of the suspension.
- Four grams of fresh stool was transferred into 10 mL of 10% formalin and was mixed and fixed for 30 minutes. The mixture was filtered through a gauze. Then, 15 mL 0.85% NaCl was added to each tube and centrifuged for 10 minutes at 500 × g. The supernatant was decanted, and the sediment was suspended in 15 mL of zinc sulphate. This was centrifuged for 1 minute at 500 × g, 1 drop of the surface film and 1 drop of sediment were placed onto a slide, and a drop of iodine solution was added and a coverslip was placed on top of each preparation.
- Four grams of fresh stool was transferred into 10 mL 10% formalin, and the suspension mixed and fixed for 30 minutes. The mixture was filtered through a gauze and transferred to a 15 mL conical centrifuge tube. A 0.85% NaCl solution was added to make the volume up to 15 mL and centrifuged for 10 minutes at 500 × g. The supernatant fluid was decanted, and the sediment was suspended in 10% formalin. Then, 4 to 5 mL of ethyl acetate was added, and the mixture was shaken vigorously and centrifuged for 10 minutes at 500 × g. The plug of debris was decanted with an applicator stick; the top layers of supernatant were decanted and the sediment was observed.
- In the methods described above, the iodine solution was used to detect and identify the parasites with optical microscopy at 10× and 40× magnification.
- One drop of specimen was smeared onto the slide and allowed to air dry. The samples were then fixed with absolute methanol for 1 minute and stained with Kinyoun’s carbol fuchsin for 5 minutes. The samples were rinsed with 50% ethanol and water. Then, the slides were decolourized using 1% sulphuric acid for 2 minutes and rinsed with water and then drained. The samples were stained with methylene blue for 2 minutes and rinsed with water and air dried, and a coverslip was added. The preparation was covered with oil immersion and examined with a 100× objective. Additionally, mothers were instructed to collect 3 perianal scrapings from children under 12 years old to perform the diagnosis of E. vermicularis by Graham’s method (n = 52). These samples were taken in the morning before defecation (as long as no ointments, talc, creams or oils had been applied in the perianal area) [7]. These samples were transported at room temperature in a plastic bag to the Municipal Health Centre of San Juan Cosala.
- The sample was obtained from the perianal area, holding the tape and the slide against the tongue depressor and pressing against the right and left perianal folds. The tape on the slide was placed (with the adhesive side now on the glass) and pressed firmly into position, and the sample was observed. These samples were observed with light microscopy at 10× and 40× magnification.
- The quantitative variables were expressed as mean, standard deviation, and standard error. The qualitative variables were expressed through frequency and percentage and were entered into 2 × 2 contingency tables indicating the positive and negative parasite test results for individuals for each risk factor. Chi-square (X2) and Fisher’s exact tests were used to establish statistical significance. Multiple logistic regression analysis was used when the risk factor was calculated by means of the odds ratio (OR) with a confidence interval of 95% (95 CI). The statistical analysis was performed using SPSS software version 20.0 (IBM Corp., Armonk, NY, USA) and Epi-Info. A p < 0.05 was considered to be significant.
- The project was approved by the Institutional Research, Ethics, and Biosecurity Committee recorded under registration number CI 053-2014, University Centre of Health Sciences, University of Guadalajara, Sierra Mojada # 950 Colonia Independencia, Guadalajara, Jalisco, Mexico. The study was performed in accordance with Official Mexican Norm NOM-087-ECOL-SSA1-2002. All patients who tested positive for enteroparasites were referred to the Municipal Health Centre for their respective treatment.
Materials and Methods
3.1. Laboratory methods
3.1.1. Direct smear
3.1.2. Flotation (zinc sulphate)
4. Formaldehyde/ethyl acetate
5. Modified Kinyoun’s acid-fast stain
6. Graham method
7. Statistical analysis
8. Ethics approval
- The prevalence of individuals infected with intestinal parasites in the study population was 77.9% (81/104). The most prevalent intestinal parasites were the protozoans, Blastocystis spp. 49% (51/104) and Endolimax nana 44.2% (46/104). Cyclospora cayetanensis and Iodamoeba bütschlii were the least prevalent intestinal parasite, with an incidence of 2.9% (3/104), (Figure 2).
- The rate of monoparasitism was 19.23% (20/104), with 58.64% (61/104) of the population having polyparasitism. In relation to the number of parasites, a higher prevalence of protozoans than helminths was observed in children (Figure 3). When the study population was divided into 2 age groups, children (< 18 years old) and adults (≥ 18 years old), there was no statistically significant difference in the prevalence of parasites (X2 = 1.277). The distribution of parasitism by age group is shown in (Table 1).
- There was also no statistically significant difference in the presence of parasites according to gender (X2 = 0.385, p = 0.535; Table 1).
- There was a significantly higher incidence of housewives with intestinal parasites (83.3%), compared with the incidence in the group consisting of other occupations (53.3%, X2 = 4.602, p = 0.039). The relative risk of infection was 4.375 times higher for housewives than for other occupations to acquire intestinal parasites (Table 1).
- Personal hygiene (washing hands before eating and after going to the bathroom; habit vs no habit) and overcrowding were analysed between participants. The people who lived in an overcrowded environment had a higher prevalence of infection (79%) than those who did not live in an overcrowded environment (19/25), 76 %, nevertheless, this difference was not significant (Table 2).
- The presence of rodents and insects (such as rats, flies, and cockroaches) inside the house was analysed with a positive intestinal parasite test. No difference was observed between those who had rats, flies and/or cockroaches compared with those households that did not (Table 2).
- The highest prevalence of intestinal parasites was in individuals whose house did not have a concrete ceiling or cement floor, which was statistically significant (p < 0.01). In addition, the relative risk of intestinal parasites was 6.1 times higher for people who did not have brick walls and decks compared to those that did (Table 3). Furthermore, a high prevalence of infection was observed in people who did not have access to public services such as a sewer system, electric lighting, and plumbing, nevertheless, there were no statistically significant differences observed (Table 3).
- The highest prevalence of intestinal parasites was observed among those people who were asymptomatic. When the presence of 13 symptoms were compared between people who tested positive or negative for parasites, there were no statistically significant differences observed (Table 4).
Results
- The prevalence of parasitism in San Juan Cosala, Jalisco, Mexico in this study population was 77.9% which was similar to the prevalence reported in Argentina and Venezuela [8,9] and other states of Mexico, including Colima (38%) [10] and San Luis Potosí (30%) [11].
- However, one study reported that in the state of Jalisco, adults of San Pedro Itzicán, municipality of Poncitlán (both native and mestizo), showed a 60% prevalence of infection [6] which was lower than the present study. Nevertheless, the incidence of infections for both study populations in Jalisco was high. This may be due to their location on the lakeshore of Chapala where a shared water source that supplies the towns may be contaminated, as well as similar conditions of public services and hygienic habits. The highest prevalence of infection was in San Pedro Itzicán and San Juan Cosalá, compared with Arandas (47.2%). This suggests that environmental factors such as weather and latitude may influence the prevalence of parasites, as Arandas is located at a higher elevation above sea level, and is less warm, therefore, providing geographical reasons for a lower prevalence rate of intestinal parasite infection [4].
- Age did not influence the predominance of parasite infection in this study, although young children (4 to 5 years old) were shown to have a high prevalence rate (86.7%) [12], despite the deficient hygienic conditions to which all age groups were exposed. The results obtained in this age group showed a higher prevalence than in those reported in the municipality of Pantepec, Chiapas (62.8%) [13].
- The percentage of Blastocystis spp. infections in San Juan Cosala (49%) may be influenced by the presence of this microorganism in the Chapala lake region. This population is located on the lakeshore of Chapala, and it is assumed that the local population consumes contaminated water from Chapala lake. This hypothesis would need to be tested with the water from the lake.
- The prevalence of Blastocystis spp. infection has been reported globally with 26.9% in Iran [14], 51.3% in Venezuela [15], 57% in Sydney, Australia [16]. In Mexico, for Guerrero and Veracruz states, the prevalence of Blastocystis spp. infection was reported as 23.02% and 80%, respectively [17,18], whilst in San Pedro Itzicán, a higher prevalence (60%) was found for Blastocystis spp. [6]. The prevalence of Blastocystis spp. infection has been shown to be influenced by host susceptibility as well as the type of population, socio-demographic characteristics, risk factors in housing, deficiencies in alimentary hygiene, water contamination, and contact with harmful fauna [19], providing similar results to those in this current study.
- Blastocystis spp., is associated with the causes of irritable colon syndrome [20], problems with dialysis patients [21], recipients of renal transplantation [22] and patients with primary and acquired immunodeficiency [23]. However, the pathogenesis is associated with subtypes. In Sonora and Morelia, Mexico, the ST3 and ST1 subtypes were found in children [24].
- The differentiation between Entamoeba histolytica/E. dispar/E. moshkovskii/E. bangladeshi was not performed because a molecular diagnosis was not used in this study protocol to differentiate between these 4 protozoans. For the patients who reported diarrhea, (77 with mucusy diarrhea and 7 with bloody diarrhea), the most advisable course of action was to determine the species of Entamoeba and provide specific treatment as detailed in other studies [25,26]. With respect to the commensal protozoans, E. nana (44.2%), E. coli (27.9%), C. mesnili (6.7%) and I. bütschlii (2.9%) were detected. The identification of these types of protozoans is important because they are transmitted through the ingestion of mature cysts via the fecal-oral route, similar to intestinal pathogen protozoans [27]. Another reason is that these protozoans can be indicative of fecal contamination [28].
- In this study, the prevalence rate of Cryptosporidium spp. infection was 7.7%, which was higher than the percentage reported in Argentina (0.2%) and Vietnam (5%); however, it was less than that reported in Sudan (13.3%) [29–31]. Similarly, in a study performed in San Pedro Itzicán, located on the border of Chapala lake, the prevalence of Cryptosporidium spp. was 7% [6]. It is important to consider the high transmissibility of Cryptosporidium spp. since the oocysts that are eliminated in feces are immediately infectious for humans and animals. Its zoonotic component should also be considered, because oocysts are highly resistant to chlorine and could be transmitted by inhalation. Autoinfection occurs through the thin layer of the oocyst, which loses its layer in the intestinal epithelial layer to initiate the cycle again, which could explain a persistent chronic infection [8].
- In the present study, the prevalence of C. cayetanensis infection was 2.9%; however, there are studies where the prevalence is lower [32]. In contrast, other studies showed higher rates of infection [33–34]. This coccidian parasite can be found in immunocompetent and immunocompromised patients [35,36] and is responsible for traveller’s diarrhea [37].
- Contaminated food and water consumption are risk factors for Cryptosporidium spp. and C. cayetanensis infection [38]. In Mexico, the consumption of mixed vegetable salads from Taylor Farms in Guanajuato has been attributed to infection with Cryptosporidium spp., and some cases were specifically related to fresh coriander originating from Puebla. Interestingly, most cases and outbreaks of cyclosporiasis detected in the United States of America have occurred in the Spring and Summer [39].
- With respect to the helminths, the prevalence of A. lumbricoides infection in this study was 5.8% (6/104), which is less than observations reported in the study of the general population of San Pedro Itzicán, which was 3 times higher (17.5%) than in San Juan Cosala [6]. The low prevalence of helminths found in San Juan Cosala could be, at least in part, the result of the massive deworming campaigns that have been implemented in Mexico [40]. Other studies have reported a decrease in the prevalence of this type of enteric parasite [41]. The soil environment favours the development of geohelminth eggs such as A. lumbricoides, T. trichiura and hookworms [42]. In this study, the patients who inhabited homes with a cement floor had less parasite infections than those who did not have this type of floor, although this result could be attributed to low numbers (only 4 patients lived in these conditions as opposed to those who had a solid floor). However, when the type of floor in the house was analysed to determine if it influenced the prevalence of parasite infections, a significant difference was found. There were 91.9% of parasitized people who inhabited houses without a tile or cement floor while 35.7% of parasitized people did have a tile or cement floor. This result is possible because the eggs and larvae of geohelminths eliminated in the feces need moist, warm, shaded soil to become infective. Other studies have reported the influence of the type of floor at home and the prevalence of parasitism [41]. In the present study in addition to the house floor, the presence of walls and the material of which they were built were also evaluated. A statistically significant higher prevalence of parasite infection was observed in the people who lived in a house without brick walls or with a roof, and the risk was 6.1 times higher compared with people who lived in a house with brick walls or with a roof. These factors may be influential because there are no physical barriers that prevent polluted air entering the house, and dust is a mode of transmission for parasites such as Cryptosporidium spp., and E. vermicularis, among others. Additionally, studies that analysed these variables found significant differences [43].
- In all the participants that lacked a sewer system in their house, 100% tested positive for parasite infections, although 74.5% participants who lived in houses with a sewer system were also infected, showing no statistically significant difference, suggesting other associated risk factors were involved in those individuals. However, it has been reported that the lack of a sewer system is an important factor in the development of intestinal parasites [44].
- In this study, the Graham method of parasite investigation was applied to children under 12 years old, and E. vermicularis was observed in (19/52) 36.5%. In this same group, (4/52) only 7.69% were identified as being infected by using the direct method and concentration method. When these last 2 methods were performed to diagnose adults, only 1 case (1.92%) was detected. These findings reflect the importance of applying the Graham method for the specific diagnosis of E. vermicularis. This method has a greater sensitivity than the direct and concentration methods because gravid females migrate nocturnally outside the anus and oviposit while crawling on the skin of the perianal region. The eggs are contained on the adhesive tape [45]. However, the Graham method is not used for adults because of the way the sample is collected [7]. A perianal swab and anal brusing method, has been proposed for the diagnosis of this parasite in children over 12 years and adults [46,47]. Other causes of prevalence of infection can be associated with the spread of eggs in beds, and clothing in the bedroom, in addition to overcrowding suggesting that transmission is intra-domiciliary, affecting children and adults [45].
- Of the 104 patients analysed, 58.64% presented polyparasitism. There are reports of multiparasitism in Colima, Jalisco, and Chiapas states of Mexico [6,10], and in other countries such as Malaysia [48]. These results demonstrate the diverse socio-demographic and hygienic factors that provide the optimal conditions required for infection with more than 1 parasite. The majority of the participants who were positive for parasites were asymptomatic, possibly due to coinfection with commensal protozoans that do not induce symptoms. Other possible reasons for the absence of clinical symptoms include low parasitic load, and the immune response of the host. This finding is important, because parasites are being disseminated unknowingly as the infecting parasitic forms are eliminated [44,46].
- The strengths of this study were the varied analysis of samples. These included several coproparasitoscopic methods, such as direct smear and iodine solution, concentration by flotation (zinc sulphate), and concentration by sedimentation (formaldehyde/ethyl acetate), the Graham method and the Kinyoun’s modified stain method. The use of the flotation method (zinc sulphate) permitted the diagnosis of protozoan cysts and helminth eggs on the surface film, and infertile eggs of A. lumbricoides in the sediment were observed.
- This study included the general population; other studies consider immunosuppressed populations or children [36]. It has been reported that 3 fecal samples have 94% sensitivity in intestinal parasitic diagnostics [49]. In this study not all patients provided the 3 samples, which may bias towards an underestimated prevalence of infection for certain parasites such as G. lamblia that have an irregular excretion of cysts.
- This is the first study reporting the findings of enteroparasitism in San Juan Cosala, Jalisco, Mexico which can support public health, and decision-making strategies to reduce intestinal parasitic infections.
- This study observed a high prevalence of Blastocystis spp., as well as commensal protozoans. This is important because pathogenic and commensal enteroparasites share the same transmission route, and indicate the deficient hygienic conditions that people are exposed to. A significant association and higher risk of pathogenic and commensal enteroparasite infections were found between the detection of enteroparasites, and housewives, cement floors and brick walls or decks. The clinical symptoms referred to by the participants were not statistically significantly associated with these pathogens.
- Sanitary education in the population needs to be implemented. Anti-parasitic albendazole treatment programmes are not specific to protozoans, and since these parasites were found in people who have been treated annually, this treatment programme alone does not address the whole problem.
Discussion
-
Acknowledgements
- This project was partly financed by Programme Support for improvement in the conditions of production of the members of the National System of Researchers 2015–2016, # 11497 University of Guadalajara. All authors thank the staff of the clinic of the Municipality of Jocotepec for use of the facilities, the Secretary of Health and the medical doctors Jorge Luis Garavito Espinoza and Miguel Ibarra Garavito, the coordinators of the Secretary of Health, Jocotepec, Martha Medina Rameño, Rosendo Venegas Cuevas and Alina Marcela Pérez Hoyos, the nurses and medical doctors of Health Centre of San Juan, Cosala, and Agustín Vázquez Calvario who was the coordinator of the project Operation Feed San Juan Cosala.
Acknowledgements
-
Conflicts of Interest
The authors declare that they have no competing interests.
Article information
- 1. Gebretsadik D, Metaferia Y, Seid A, et al. Prevalence of intestinal parasitic infection among children under 5 years of age at Dessie Referral Hospital: cross sectional study. BMC Res Notes 2018;11:771PMID: 10.1186/s13104-018-3888-2.ArticlePubMedPMCPDF
- 2. Aquino MJM, Vargas SGB, López MB, et al. Comparación de dos nuevas técnicas de sedimentación y métodos convencionales para la recuperación de parásitos intestinales. Rev Latinoame Patol Clin 2012;59(4). 233−42. [in Spanish].
- 3. Quihui L, Valencia ME, Crompton DW, et al. Role of the employment status and education of mothers in the prevalence of intestinal parasitic infections in Mexican rural schoolchildren. BMC Public Health 2006;6:225PMID: 10.1186/1471-2458-6-225. PMID: 16956417. PMID: 1584408.ArticlePubMedPMCPDF
- 4. Vásquez-Garibay EM, Romero-Velarde E, Napoles-Rodríguez F, et al. Prevalence of iron and iodine deficiency, and parasitosis among children from Arandas, Jalisco, Mexico. Salud Publ Mex 2002;44(3). 195−200. [in Spanish].
- 5. Vásquez-Garibay EM, Campos Barrera LR, Romero Velarde E, et al. Risk factors associated with iron depletion and parasites in preschool and school children of Arandas, Jalisco, Mexico. Nutr Hosp 2014;31(1). 244−50.PubMed
- 6. Galván-Ramírez ML, Madriz-Elisondo AL, Bernal-Redondo R. Biodiversidad parasitaria entre indígenas y mestizos adultos de San Pedro Itzicán, Jalisco, Mexico. Salud Publica Mex 2007;49(5). 321−2. [in Spanish]. PMID: 10.1590/S0036-36342007000500001.ArticlePubMed
- 7. Clinical and Laboratories Standards Institute. 2005. Procedures for the recovery and identification of parasites from the intestinal tract; approved guideline. 2nd ed. CLSIM28-A2.
- 8. Gamboa MI, Giambelluca LA, Navone GT. Distribución espacial de las parasitosis intestinales en la ciudad de La Plata, Argentina. Medicina Buenos Aires 2014;74(5). 363−70. [in Spanish].
- 9. Cazorla D, Acosta ME, Acosta ME, et al. Clinical and epidemiological study of intestinal coccidioses in a rural population of a semiarid region from Falcon state, Venezuela. Invest Clin 2012;53(3). 273−88. [in Spanish]. PMID: 23248971.PubMed
- 10. Galvan-Ramirez ML, Rivera N, Loeza M, et al. Nitazoxanide in the treatment of Ascaris lumbricoides in a rural zone of Colima, Mexico. J Helminthol 2007;81(3). 255−9. PMID: 10.1017/S0022149X07747466. PMID: 17594741.ArticlePubMed
- 11. Sánchez de la Barquera-Ramos MA, Miramontes-Zapata M. Parasitosis intestinales en 14 comunidades rurales del altiplano de Mexico. Rev Mex Patol Clin 2011;58(1). 16−25. [in Spanish].
- 12. Guerrero Hernández MT, Hernández Molinar Y, Rada Espinosa ME, et al. Parasitosis intestinal y alternativas de disposición de excreta en municipios de alta marginalidad. Rev Cub Salud Publica 2008;34(2). 1−4. [in Spanish]. PMID: 10.1590/S0864-34662008000400001.Article
- 13. Gutierrez-Jimenez J, Torres-Sanchez MG, Fajardo-Martinez LP, et al. Malnutrition and the presence of intestinal parasites in children from the poorest municipalities of Mexico. J Infec Dev Ctries 2013;7(10). 741−7. PMID: 10.3855/jidc.2990.Article
- 14. Kiani H, Haghighi A, Rostami A, et al. Prevalence, risk factors and symptoms associated to intestinal parasite infections among patients with gastrointestinal disorders in Nahav and, Western Iran. Rev Inst Med Trop Sao Paulo 2016;58:42PMID: 10.1590/S1678-9946201658042.ArticlePubMedPMC
- 15. Devera R, Blanco Y, Amaya I, et al. Parásitos intestinales en habitantes de la comunidad rural “La Canoa”, estado Anzoátegui, Venezuela. Rev Venz Salud Publica 2014;2(1). 15−22. [in Spanish].
- 16. Fletcher S, Caprarelli G, Merif J, et al. Epidemiology and geographical distribution of enteric protozoan infections in Sydney, Australia. J Public Health Res 2014;3(2). 298PMID: 10.4081/jphr.2014.298. PMID: 25343139. PMID: 4207027.ArticlePubMedPMC
- 17. Rodríguez E, Mateos B, González JC, et al. Transición parasitaria a Blastocystis hominisen niños de la zona centro del estado de Guerrero, Mexico. Parasitol Latinoam 2008;63(1). 20−8. [in Spanish]. PMID: 10.4067/S0717-77122008000100004.
- 18. Martínez-Barbabosa I, Gutiérrez-Quiroz M, Ruiz-González L, et al. Blastocystis hominis y su relación con el estado nutricional de escolares en una comunidad de la sierra de Huayacocotla, Veracruz, Mexico. Rev Biomed 2010;21(2). 77−84. [in Spanish].
- 19. Tan KS. New insights on classification, identification, and clinical relevance of Blastocystis spp. Clin Microbiol Rev 2008;21(4). 639−65. PMID: 10.1128/CMR.00022-08. PMID: 18854485. PMID: 2570156.ArticlePubMedPMC
- 20. Dogruman-Al F, Simsek Z, Boorom K, et al. Comparison of methods for detection of Blastocystis infection in routinely submitted stool samples, and also in IBS/IBD Patients in Ankara, Turkey. PloS one 2010;5:e15484PMID: 10.1371/journal.pone.0015484. PMID: 21124983. PMID: 2987810.ArticlePubMedPMC
- 21. Karadag G, Tamer GS, Dervisoglu E. Investigation of intestinal parasites in dialysis patients. Saudi Med J 2013;34(7). 714−8. PMID: 23860891.PubMed
- 22. Azami M, Sharifi M, Hejazi SH, et al. Intestinal parasitic infections in renal transplant recipients. Braz J Infect Dis 2010;14(1). 15−8. PMID: 10.1016/S1413-8670(10)70004-0. PMID: 20428648.ArticlePubMed
- 23. Bednarska M, Jankowska I, Pawelas A, et al. Prevalence of Cryptosporidium, Blastocystis, and other opportunistic infections in patients with primary and acquired immunodeficiency. Parasitol Res 2018;117(9). 2869−79. PMID: 10.1007/s00436-018-5976-6. PMID: 29946765. PMID: 6105259.ArticlePubMedPMCPDF
- 24. Villegas-Gómez I, Martínez-Hernández F, Urrea-Quezada A, et al. Comparison of the genetic variability of Blastocystis subtypes between human carriers from two contrasting climatic regions of Mexico. Infect Genet Evol 2016;44:334−40. PMID: 10.1016/j.meegid.2016.07.036.ArticlePubMed
- 25. Hung CC, Chang SY, Ji DD. Entamoeba histolytica infection in men who have sex with men. Lancet Infect Dis 2012;12(9). 729−36. PMID: 10.1016/S1473-3099(12)70147-0. PMID: 22917103.ArticlePubMed
- 26. Santos RV, da Nunes JS, Camargo JA. High occurrence of Entamoeba histolytica in the municipalities of Ariquemes and Monte Negro, State of Rondônia, Western Amazonia, Brazil. Rev Inst Med Tropical Sao Paulo 2013;55(3). 193−6. PMID: 10.1590/S0036-46652013000300010.ArticlePDF
- 27. Sard BG, Navarro RT, Sanchis JGE. Amebas intestinales no patógenas: una visión clinicoanalítica. Enferm Infecc Microbiol Clin 2011;29:20−8. [in Spanish]. PMID: 10.1016/S0213-005X(11)70023-4.Article
- 28. Calchi La Corte M, Rivero de Rodríguez Z, Bracho Mora A, et al. Prevalencia de Blastocystis sp. y otros protozoarios comensales en individuos de Santa Rosa de Agua, Maracaibo, estado Zulia. Rev Soc Venezolana Microbiol 2013;33(1). 66−71. [in Spanish].
- 29. Pezzani BC, Minvielle MC, Ciarmela ML, et al. Community participation in the control of intestinal parasitoses at a rural site in Argentina. Rev Panam Salud Publica 2009;26(6). 471−7. [in Spanish]. PMID: 10.1590/S1020-49892009001200001.PubMed
- 30. Pham-Duc P, Nguyen-Viet H, Hattendorf J, et al. Ascaris lumbricoides and Trichuris trichiura infections associated with wastewater and human excreta use in agriculture in Vietnam. Parasitol Int 2013;62(2). 172−80. PMID: 10.1016/j.parint.2012.12.007. PMID: 23305757.ArticlePubMed
- 31. Sim S, Yu JR, Lee YH, et al. Prevalence of Cryptosporidium Infection among Inhabitants of 2 Rural Areas in White Nile State, Sudan. Korean J Parasitol 2015;53(6). 745−7. PMID: 10.3347/kjp.2015.53.6.745.ArticlePubMedPMCPDF
- 32. Orozco-Mosqueda GE, Martínez-Loya OA, Ortega YR. Cyclospora cayetanensis in a pediatric hospital in Morelia, Mexico. Am J Trop Med Hyg 2014;91(3). 537−40. PMID: 10.4269/ajtmh.13-0535. PMID: 24957545. PMID: 4155555.ArticlePubMedPMC
- 33. Devera R, Blanco Y, Cabello E. Elevada prevalencia de Cyclospora cayetanensis en indígenas del estado Bolívar, Venezuela Cad. Saude Publica 2005;21(6). 1778−84. [in Spanish]. PMID: 10.1590/S0102-311X2005000600025.ArticlePDF
- 34. Dhanabal J, Selvadoss PP, Muthuswamy K. Comparative study of the prevalence of intestinal parasites in low socioeconomic areas from South Chennai, India. J Parasitology Res 2014;2014:630968. PMID: 10.1155/2014/630968.ArticlePDF
- 35. Ghoshal U, Dev A, Ranjan P, et al. Identification of opportunistic enteric parasites among immunocompetent patients with diarrhea from Northern India and genetic characterisation of Cryptosporidium and Microsporidia. Indian J Med Microbiol 2016;34(1). 60−6. PMID: 10.4103/0255-0857.174114. PMID: 26776120.ArticlePubMed
- 36. Nsagha DS, Njunda AL, Assob NJC, et al. Intestinal parasitic infections in relation to CD4 (+) T cell counts and diarrhea in HIV/AIDS patients with or without antiretroviral therapy in Cameroon. BMC Infect Dis 2016;16:9PMID: 10.1186/s12879-016-1337-1.ArticlePubMedPMCPDF
- 37. Yu JR, Sohn WM. A case of human cyclosporiasis causing traveler’s diarrhea after visiting Indonesia. J Korean Med Sci 2003;18(5). 738−41. PMID: 10.3346/jkms.2003.18.5.738. PMID: 14555830. PMID: 3055112.ArticlePubMedPMC
- 38. Dowd SE, John D, Eliopolus J, et al. Confirmed detection of Cyclospora cayetanesis, Encephalitozoon intestinalis and Cryptosporidium parvum in water used for drinking. J Water Health 2003;1(3). 117−23. PMID: 10.2166/wh.2003.0014.ArticlePubMedPDF
- 39. Abanyie F, Harvey RR, Harris JR, et al. 2013 multistate outbreaks of Cyclospora cayetanensis infections associated with fresh produce: focus on the Texas investigations. Epidemiol Infect 2015;143(16). 3451−8. PMID: 10.1017/S0950268815000370. PMID: 25865140. PMID: 4657030.ArticlePubMedPMC
- 40. Tapia-Romero R, Martínez-Méndez LG, Dávila-Solís BL, et al. Transición parasitaria: experiencia en un hospital pediátrico de tercer nivel (1990–2010). Bol Med Hosp Infant Mex 2015;72(3). 174−80. [in Spanish]. PMID: 29421499.ArticlePubMed
- 41. Chammartin F, Utzinger J, Guimarães LH, et al. Spatio-temporal distribution of soil-transmitted helminth infections in Brazil. Parasit Vectors 2014;7:440PMID: 10.1186/1756-3305-7-440. PMID: 25230810. PMID: 4262198.ArticlePubMedPMC
- 42. Tchakounté BN, Nkouayep VR, Poné JW. Soil Contamination Rate, Prevalence, Intensity of Infection of Geohelminths and Associated Risk Factors among Residents in Bazou (West Cameroon). Ethiop J Health Sci 2018;28(1). 63−72. PMID: 10.4314/ejhs.v28i1.8. PMID: 29622908. PMID: 5866290.ArticlePubMedPMC
- 43. Nyantekyi L, Legesse M, Medhin G, et al. Community awareness of intestinal parasites and the prevalence of infection among community members of rural Abaye Deneba area, Ethiopia. Asian Pac J Trop Biomed 2014;4(suppl 1). S152−7. PMID: 10.12980/APJTB.4.2014C764. PMID: 25183071. PMID: 4025342.ArticlePubMedPMC
- 44. Farghly AM, Mohamed SM, Abdel-Rahman SA, Mohammed FE, El-Bahaie ES, El-Shafey MA. The relation between the prevalence of soil transmitted parasites in the soil and among school children in Zagazig district, Sharkyia Governorate, Egypt. J Parasit Dis 2016;40(3). 1021−9. PMID: 10.1007/s12639-014-0627-z. PMID: 27605831. PMID: 4996240.ArticlePubMedPDF
- 45. Afrakhteh N, Marhaba Z, Mahdavi SA, et al. Prevalence of Enterobius vermicularis amongst kindergartens and preschool children in Mazandaran Province, North of Iran. J Parasit Dis 2016;40(4). 1332−6. PMID: 10.1007/s12639-015-0683-z. PMID: 27876942. PMID: 5118309.ArticlePubMedPDF
- 46. Pezzani BC, Minvielle MC, de Luca MM, Cordoba MA, Apezteguia MC, Basualdo JA. Enterobius vermicularis infection among population of General Mansilla, Argentina. World J Gastroenterol 2004;10(17). 2535−9. PMID: 10.3748/wjg.v10.i17.2535. PMID: 15300899. PMID: 4572156.ArticlePubMedPMC
- 47. Jeric-Lara MI, Oyarce-Fierro A. [Internet]. Recomendaciones para la búsqueda de huevos de Enterobius vermicularis. Instituto de Salud Pública de Chile Available from: http://www.ispch.cl/sites/default/files/Recomendacion_Busqueda_Enterobius_vermicularis.pdf.
- 48. Al-Delaimy AK, Al-Mekhlafi HM, Nasr NA, et al. Epidemiology of Intestinal Polyparasitism among Orang Asli School Children in Rural Malaysia. PLoS Negl Trop Dis 2014;8(8). e3074PMID: 10.1371/journal.pntd.0003074. PMID: 25144662. PMID: 4140674.ArticlePubMedPMC
- 49. Hanson KL, Cartwright CP. Use of an enzyme immunoassay does not eliminate the need to analyze multiple stool specimens for sensitive detection of Giardia lamblia. J Clin Microbiol 2001;39(2). 474−7. PMID: 10.1128/JCM.39.2.474-477.2001. PMID: 11158092. PMID: 87761.ArticlePubMedPMC
References
Figure 1Map of location of small-town San Juan Cosala, situated on the banks of Lake Chapala, Jalisco state, Mexico, Global Positioning System (GPS) coordinates longitude: 103°19′56.90 W, latitude 20°17′04.50″ N.
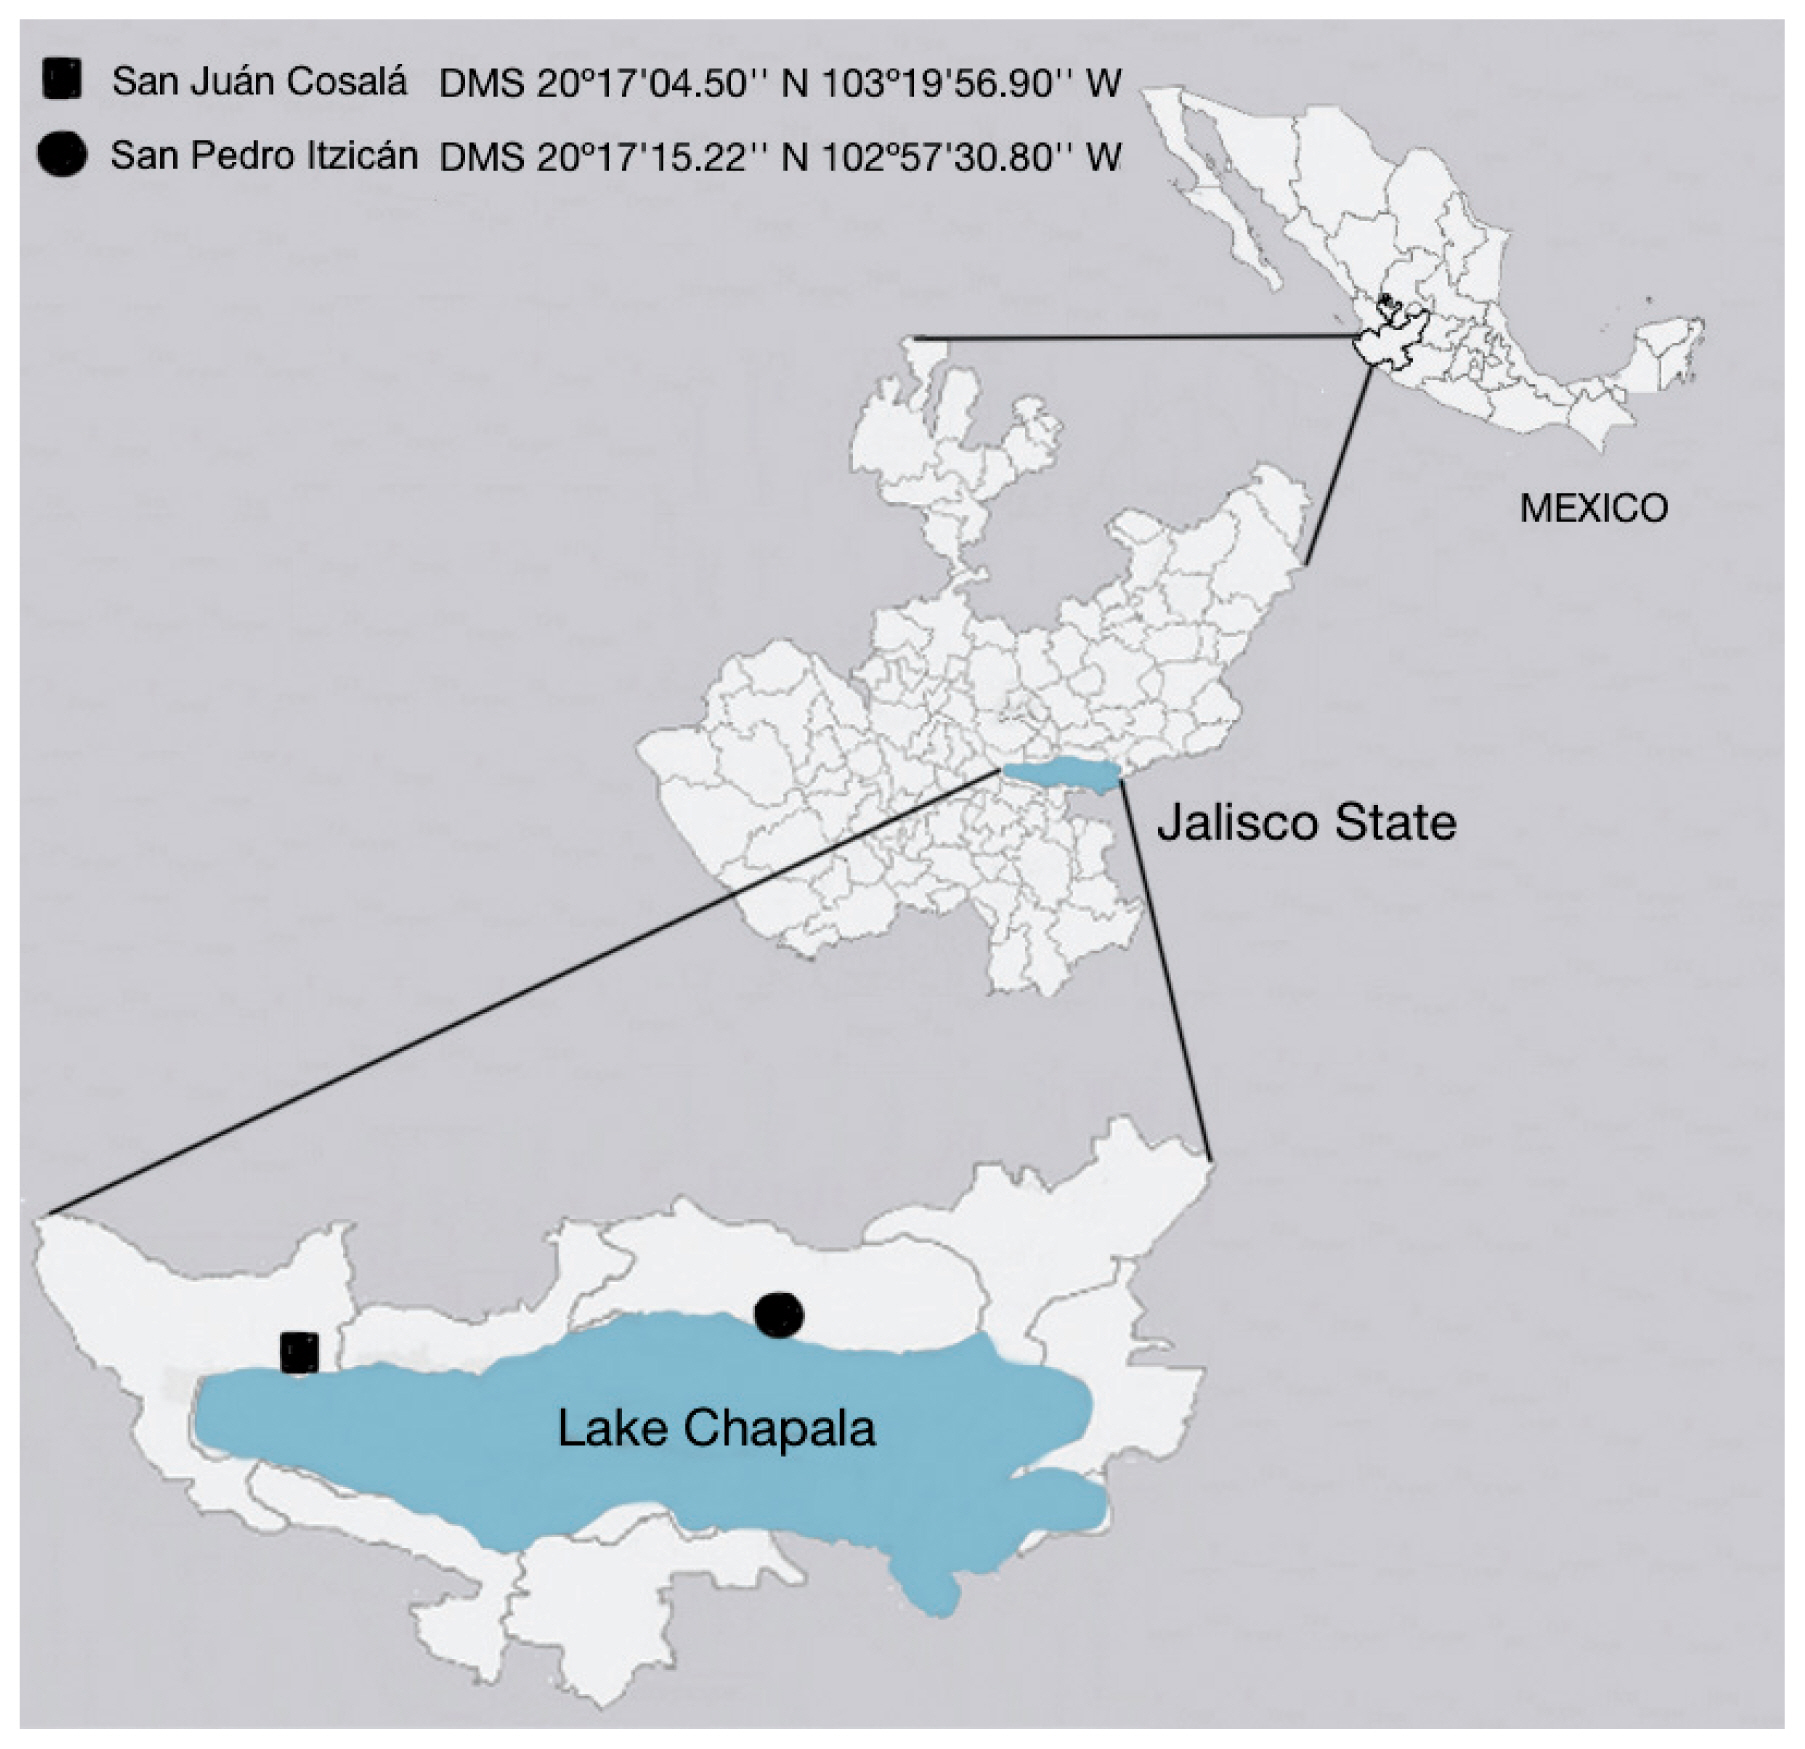
Figure 2It shows the prevalence by parasitic species, the most prevalent protozoan was Blastocysts spp.

Figure 3The polyparasitism rate was 58.64% in the population of San Juan Cosala, analysed by the number of parasites; up to 6 parasites were found simltaneously.

Table 1Socio-demographic characteristics and association with intestinal parasites in the population of San Juan Cosala.
Table 2Personal hygiene, presence of rodents, insects inside the house and association with enteroparasites.
Table 3Construction characteristics and public housing services and association with enteroparasites.
Table 4Clinical manifestations and association with enteroparasites in the San Juan Cosala population.
Figure & Data
References
Citations
Citations to this article as recorded by 
- Intestinal parasite infections associated with sociodemographic and seasonal factors in the Western Amazon
Gustavo Henrique Sinhorin, Ana Carolina Gomes Carneiro, Beatrice Emeli Silva Farias, Patrícia de Almeida, Antônio Ralph Medeiros-Sousa, Leonardo Augusto Kohara Melchior, Andreia Fernandes Brilhante
Parasitology Research.2023; 122(2): 419. CrossRef - Prevalence of Enterobius vermicularis among children in Iran: A comprehensive systematic review and meta-analysis
Elnaz Moussavi, Mohammad Houssaini, Nader Salari, Mahvan Hemmati, Ahmad Abdullahi, Ali Asghar Khaleghi, Shamarina Shohaimi, Masoud Mohammadi
Parasite Epidemiology and Control.2023; 22: e00315. CrossRef - Improved household flooring is associated with lower odds of enteric and parasitic infections in low- and middle-income countries: A systematic review and meta-analysis
Hugo Legge, Rachel L. Pullan, Benn Sartorius, Srinivasa Rao Mutheneni
PLOS Global Public Health.2023; 3(12): e0002631. CrossRef - Enterobiasis among Yemeni children: a cross-sectional study
Abdulelah H. Al-Adhroey, Yahya A. Al-Ansi, Mohammed A. Al-Kholani, Abdulrahman H. Amer, Marwan M. Al-Khyat, Fadia H. Al Hubaishi, Radhwan H. Aziz, Ebrahim S. Al-Khateeb, Souad A. Al-Gabri, Tawfik M. Al-Gabri
Journal of Parasitic Diseases.2022; 46(3): 722. CrossRef - Prevalence of human cryptosporidiosis in the Americas: systematic review and meta-analysis
Higor Wilson Jann, Mauro Jorge Cabral-Castro, João Victor Barreto Costa, Alba Cristina Miranda de Barros Alencar, José Mauro Peralta, Regina Helena Saramago Peralta
Revista do Instituto de Medicina Tropical de São P.2022;[Epub] CrossRef - Frecuencia de parasitosis intestinal en escuelas primarias en Veracruz, México
Vanessa Oceguera-Segovia, Gabriel Obed Martínez-Rodríguez, Janet Michelle Villafuerte-Ordaz, Xóchitl Magnolia Alanís-Reyes, Angel Alberto Puig-Lagunes
Revista Mexicana de Pediatría.2022; 89(4): 146. CrossRef - Intestinal protozoa and helminths in ulcerative colitis and the influence of anti-parasitic therapy on the course of the disease
Abdurakhim Toychiev, Behzod Navruzov, Dinora Pazylova, Nikolay Davis, Najiya Badalova, Svetlana Osipova
Acta Tropica.2021; 213: 105755. CrossRef - Contamination of fresh produce sold on the Italian market with Cyclospora cayetanensis and Echinococcus multilocularis
Alessandra Barlaam, Tamirat T. Temesgen, Kristoffer R. Tysnes, Laura Rinaldi, Nicola Ferrari, Anna R. Sannella, Giovanni Normanno, Simone M. Cacciò, Lucy J. Robertson, Annunziata Giangaspero
Food Microbiology.2021; 98: 103792. CrossRef - The role of environmental factors in the realization of the epidemic process on ascariasis
Anton A. Martsev
Hygiene and sanitation.2021; 100(3): 218. CrossRef - Epidemiology of Intestinal Parasites in Pediatric Patients: Example of Ordu Province
Emine YURDAKUL ERTÜRK, Ülkü KARAMAN, Yeliz KAŞKO ARICI, Cemil ÇOLAK, Gamze YOLALAN, Şermin TOP
Online Türk Sağlık Bilimleri Dergisi.2021; 6(3): 391. CrossRef - Molecular genotyping of Blastocystis spp. in wild mammals from Mexico
Fernando Martinez-Hernandez, Jose Alejandro Martinez-Ibarra, Eduardo Lopez-Escamilla, Claudia Villanueva-Garcia, Claudia Irais Muñoz-Garcia, Emilio Rendon-Franco, Pablo Maravilla, Guiehdani Villalobos
Parasitology Research.2020; 119(1): 97. CrossRef - The association between the lack of safe drinking water and sanitation facilities with intestinal Entamoeba spp infection risk: A systematic review and meta-analysis
Hamid Atabati, Hamid Kassiri, Ehsan Shamloo, Mitra Akbari, Ali Atamaleki, Fatemeh Sahlabadi, Nguyen Thi Thuy Linh, Ali Rostami, Yadolah Fakhri, Amin Mousavi Khaneghah, Chia Kwung Fan
PLOS ONE.2020; 15(11): e0237102. CrossRef - Cyclospora cayetanensis and Cyclosporiasis: An Update
Sonia Almeria, Hediye N. Cinar, Jitender P. Dubey
Microorganisms.2019; 7(9): 317. CrossRef
 PubReader
 Cite
Cite