Articles
- Page Path
- HOME > Osong Public Health Res Perspect > Volume 10(5); 2019 > Article
-
Original Article
Body Weight Misperception and Psychological Distress Among Children and Adolescents: The CASPIAN-V Study - Roya Riahia, Mohammad Esmaeil Motlaghb, Ramin Heshmatc, Mostafa Qorbanid, Seyede Shahrbanoo Danialia, Roya Kelishadia
-
Osong Public Health and Research Perspectives 2019;10(5):315-324.
DOI: https://doi.org/10.24171/j.phrp.2019.10.5.08
Published online: October 31, 2019
aDepartment of Pediatrics, Child Growth and Development Research Center, Research Institute for Primordial Prevention of Non-Communicable Disease, Isfahan University of Medical Sciences, Isfahan, Iran
bDepartment of Pediatrics, Ahvaz Jundishapur University of Medical Sciences, Ahvaz, Iran
cChronic Diseases Research Center, Endocrinology and Metabolism Population Sciences Institute, Tehran University of Medical Sciences, Tehran, Iran
dNon-Communicable Diseases Research Center, Alborz University of Medical Sciences, Karaj, Iran
- *Corresponding author: Seyede Shahrbanoo Daniali, Department of Pediatrics, Child Growth and Development Research Center, Research Institute for Primordial Prevention of Non-communicable Disease, Isfahan University of Medical Sciences, Isfahan, Iran, E-mail:Sh_daniali@yahoo.com
Copyright ©2019, Korea Centers for Disease Control and Prevention
This is an open access article under the CC BY-NC-ND license (http://creativecommons.org/licenses/by-nc-nd/4.0/).
Abstract
-
Objectives
- Misperception of weight status is a risk factor that affects psychological health. The aim of this study was to evaluate the association between weight misperception patterns and psychological distress among Iranian children and adolescents.
-
Methods
- This was a cross-sectional nationwide study where data was collected from 14,440 students, aged 7–18 years who participated in the national school-based surveillance program (CASPIAN-V). The students’ weight perception and psychological distress were assessed by validated questionnaires. Weight misperception was classified as misperception of being either underweight or overweight with respect to actual weight.
-
Results
- The rate of weight misperception in all study participants was 59.1%. In groups with a perception of being underweight or overweight, the risks of worthlessness, being worried, experiencing aggression, insomnia, or depression, were significantly higher than groups with an accurate weight perception (p < 0.05). The risk of anxiety in girls of normal weight who perceived themselves as underweight, decreased by 57% compared to girls with an accurate weight perception (OR: 0.43; 95% CI, 0.28–0.66).
-
Conclusion
- Weight misperception is highly prevalent among Iranian children and adolescents and is associated with their psychological health status. Appropriate education intervention needs to be developed to improve the children and adolescents’ perception of their body weight status.
- There is a growing body of evidence to show that the stigma of obesity and lack of fitness has increased in recent years, alongside childhood and adolescent obesity [1]. It is not surprising that concerns about weight status and body dissatisfaction are common among children and adolescents [2,3]. The prevalence of body dissatisfaction has been reported to be as high as 82% among Brazilian children (8–11 years), and up to 40% in boys and 80% in girls in Australian adolescents (12–18 years) [4,5]. In Iran, body dissatisfaction has been reported in 51% of college students [6] and in another study, 75% of 10–18-year-old girls in the study population were observed to have body dissatisfaction [7].
- Weight misperception is an important dimension of body concern, which has been defined as the discordance between an individual’s actual weight and perceived weight status, and may indirectly reflect body dissatisfaction [8,9]. However, body dissatisfaction and weight misperception are different to body perception. Since being fit is associated with being thin, a misperception of being overweight can lead to body dissatisfaction.
- Misperception of the ideal body shape has negative physical and mental effects [8,10,11]. Little has been known about the relationship between weight misperception patterns and depressive symptoms. This study explored the relationship between distortion of weight misperception patterns and depressive symptoms in Korean adolescents. METHODS The subjects of this study were 109,373 middle school students who participated in the Korea Youth Risk Behavior Web-based Survey (KYRBWS). For example, children and adolescents who misperceived themselves as being overweight were less likely to drink milk or fruit juice, eat fruits and tended not to regularly consume breakfast and dinner [10,12]. A study among Korean adolescents showed that an underestimation of actual weight was related to a high consumption of fast foods and unhealthy snacks [13]. Overall, individuals with weight misperception (especially girls), were more likely to choose unhealthy weight control methods [14].
- Previous studies have shown a significant association between weight misperception and psychological distress in students [15–17]. However, it seems that the nature of this association was dependent on both gender and actual weight status [15]. For instance, in a national survey of American students, overweight boys who misperceived themselves as normal, had more depression than boys with an accurate weight perception, and normal-weight girls who misperceived themselves as overweight, showed more symptoms of depression than girls with an accurate perception of their weight [18]. On the other hand, it is documented that overweight or underweight adolescents who misperceive their weight status as normal, would have a higher health-related quality of life than those with an accurate weight perception [19].
- To the best of our knowledge, few studies have focused on the association in individuals between the perception of being underweight or normal weight and psychological distress. Understanding weight misperception patterns among children and adolescents, and its association with psychiatric distress factors, may provide the basis for more effective health policies to support this age group in developing a positive mental status. The aim of the current study was to evaluate the association between body weight perception and weight misperception patterns with psychiatric distress, in a nationally representative sample of Iranian children and adolescents.
Introduction
- This cross-sectional nationwide study was conducted on 14,440 students, aged 7–18 years, as a part of the fifth survey of a national school-based surveillance program in Iran, entitled “Childhood and Adolescence Surveillance and Prevention of Adult Non-communicable Disease (CASPIAN-V)” study. Students were selected by a multistage, stratified, cluster sampling method from urban and rural areas across the country [20].
- 1. Measurement
- To collect data, a questionnaire obtained from the World Health Organization-Global School Student Health Survey was translated into Persian. The validity and reliability of the questionnaire had been previously confirmed [20]. This questionnaire was comprised of several components including demographic data (age, gender, and living area), lifestyle questions (socioeconomic status, physical activity, and screen time), academic performance, self-perceived health, and psychiatric distress which were assessed by the relevant questions below.
Depression: During the past 12 months, did you ever feel sad or hopeless? (Responses were “yes/no”).
Worry: During the past 12 months, how often have you been worried about something, that it meant you could not sleep at night? (Responses ranged from never to always).
Anxiety: During the past 6 months, how often did you experience anxiety such that you could not perform your daily activities? (Responses ranged from almost every day to never).
Aggression: During the past 6 months, how often did you experience aggression such that you could not perform your daily activities? (Responses ranged from almost every day to never).
Insomnia: During the past 6 months, how often did you experience insomnia such that you could not perform your daily activities? (Responses ranged from almost every day to never).
Worthless: During the past 6 months, how often did you experience worthless such that you could not perform your daily activities? (Responses ranged from almost every day to never).
- 2. Anthropometrics measurement
- Anthropometrics indices were measured by a trained healthcare team using standardized protocols. Weight (with light clothing) and height (without shoes) were measured on flat ground to the nearest 0.1 kg, and 0.1 cm respectively [21]. Body mass index (BMI) was calculated by dividing weight (kg) by height squared (m2). The WHO growth charts were used to categorize BMI [22]. In addition BMI Z-scores were calculated using the LMS (The λ-median-coefficient of variation)method [23, 24].
- 3. Socioeconomic status
- By principal component analysis methods, variables such as parents’ job, parental education, child or adolescent school type (public/private), owning a family car, and possessing a personal computer for the home were summarized in 1 main component. This main component of socioeconomic status (SES) was classified into low, intermediate, and high SES [25].
- 4. Self-perception of body weight
- Self-perception of body weight was obtained by asking, “What do you think about your body type?” The student’s responses varied from very thin to very fat, and were classified as underweight (very thin- thin), normal weight, and excess weight (fat-very fat) groups.
- 5. Weight misperception pattern
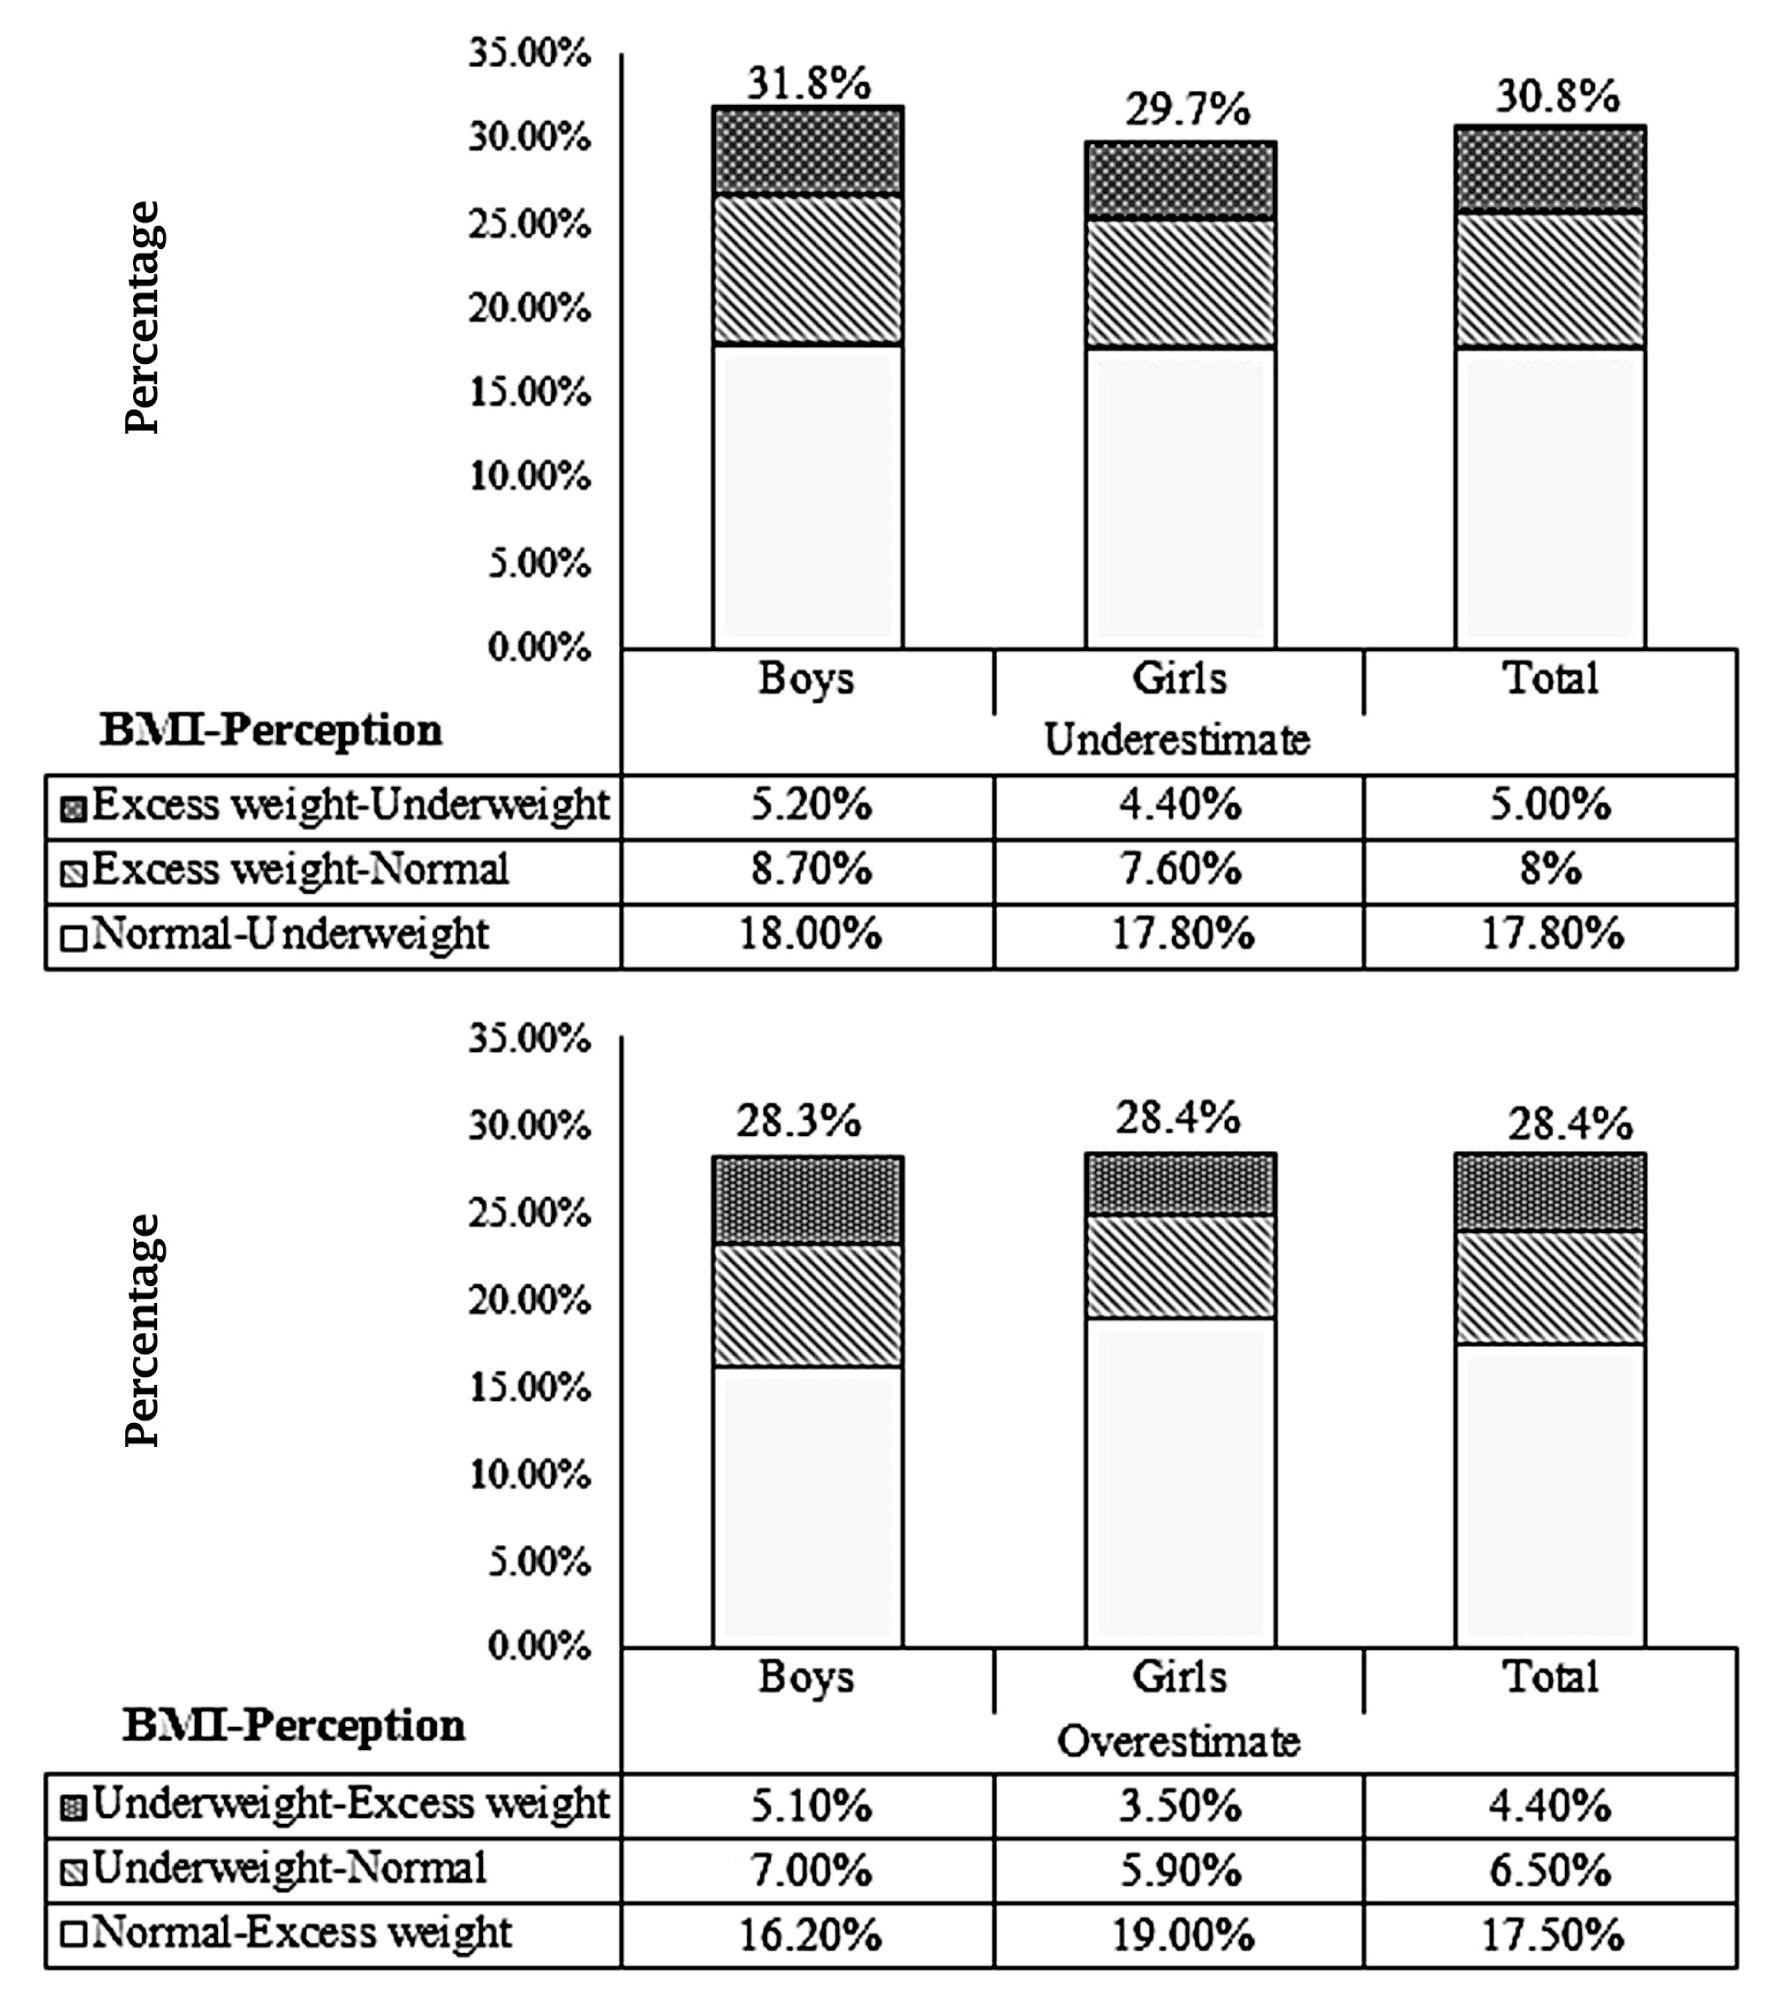
- By comparing actual body weight status (based on BMI) with self-perception of weight, weight misperceptions were classified as underweight (perceived weight status as less than the actual BMI category status) and overweight (perceived weight status as more than actual BMI category status). Students who correctly estimated their body weight status were considered as the “accurate weight perceived group.” To analyze the relationship between the various patterns of weight misperceptions and psychiatric distress, misperceptions of underweight were classified into 3 categories including “normal weight students who perceived themselves as underweight,” “excess weight students who perceived themselves as normal weight,” and “excess weight students who perceived themselves as underweight.” Misperceptions of being overweight were classified into “normal weight students who perceived themselves as having excess weight,” “underweight students who perceived themselves as a normal weight,” and “underweight students who perceived themselves as having excess weight.”
- 6. Statistical analysis
- Data was expressed as mean (95% CI) for continuous variables, and as a percent (95% CI) for categorical variables. The Student t test and Chi-square test were used to compare demographic characteristics between gender categories. The association between psychiatric distress with BMI, body weight perception, and weight misperception pattern, were assessed by multivariate logistic regression. All models were adjusted for living area, age, socioeconomic status, school performance, and self-perceived health. Data were analyzed using the SPSS statistical package 18.0 (SPSS Inc., Chicago, IL, USA) for windows. When p < 0.05 the result was considered statistically significant.
- 7. Ethical concerns
- This study was approved by the Ethical Committees and other relevant national regulatory organizations. The research and ethics council of Isfahan University of Medical Sciences approved the study (Project no.: 194049). Written informed consent was obtained from the parents and verbal consent was given by the students.
Materials and Methods
- There was a total of 14,440 students, aged 7–18 years who were part of the CASPIAN-V study. There were 14,274 students included in the study population for analysis (the participant rate was 99%). Overall, 50.6% of the study population were boys, and 71.4% of the study population were from urban areas. The mean age of students was 12.28 (± 3.16) years. The participant’s demographic characteristics and body weight perception status according to gender are shown in Table 1. The rate of accurate and excess weight perception was significantly higher in girls than in boys (p < 0.05).
- Overall agreement between self-perception of weight and actual weight status was 40.9%. In addition, the rates of underestimation and overestimation by all participants were 30.8%, and 28.4%, respectively (Table 1). The prevalence of weight misperception pattern is presented in Figure 1. The frequency of underestimation was higher in boys (31.8%) than girls (29.7%).
- The prevalence of psychiatric distress according to gender is shown in Table 2. The prevalence of worrying, and aggression was significantly higher in girls (34.6% and 36.9%) than in boys (31.7 % and 34.8%; p < 0.05).
- The association between psychiatric distress with self-perception of weight and actual weight status (based on BMI) according to gender is shown in Table 3. The students who perceived themselves as underweight or overweight were more likely to experience worthlessness, be worried, show aggression, have insomnia, or depression than students with normal weight perception, in both genders (p < 0.05).
- All students (regardless of gender), who perceived themselves as underweight (56%) were less likely to experience anxiety than students who perceived themselves as normal (39%; p < 0.05), while the risk of anxiety in all students with the perception of being overweight [OR in boy: 5.88 (4.40–7.76)] and [OR in girl: 4.45 (3.40–5.82)], was significantly higher than students with a normal weight perception (p < 0.05).
- As shown in Table 3, the actual weight status of the students was not associated with the experience of psychological distress, and there were no statistically significant differences between underweight or overweight students compared with their normal weight peers (p > 0.05).
- Table 4 shows the association between body weight misperception pattern and psychiatric distress, according to gender (patterns of weight misperception were shown as “actual weight-perception of weight”). The risk of worry and depression in boys who perceived themselves as underweight while having a normal weight, was significantly higher than in boys with an accurate weight perception (OR: 1.41; 95% CI, 1.23–1.65 and OR: 1.25; 95% CI, 1.02–1.53 respectively). Boys who had excess weight and perceived themselves as underweight, were 46% less likely to experience aggression than all other groups of boys. The risk of depression in normal weight boys who perceived themselves as having excess weight, increased by 24% compared with the boys who correctly perceived their weight (OR: 1.24; 95% CI, 1.02–1.51; Table 4).
- Girls who perceived themselves as underweight whilst being a normal weight, were 38% more likely to experience worthlessness than girls who perceived themselves as the correct weight. The risk of anxiety in girls who perceived themselves as underweight whilst being of normal weight, decreased by 57% compared with girls who perceived themselves as the correct weight (OR: 0.43; 95% CI, 0.28–0.66; Table 4).
- All students who perceived themselves as having excess weight whilst being a normal weight or underweight, were more likely to exhibit psychiatric distress than students who perceived their weight accurately (p < 0.05). The risk of psychiatric distress in girls and boys who perceived themselves as normal weight but were either underweight or had excess weight, was significantly lower than students who accurately predicted their weight (p < 0.05; Table 4).
Results
- In the present study, a negative self-perception of body weight as expressed by perceived excess weight or underweight status, was statistically significantly associated with psychiatric distress in both genders. Students who perceived themselves as underweight or had excess weight were more likely to experience psychiatric distress than their peers who perceived themselves as having a normal weight. However, this association was not statistically significant between actual weight status and psychiatric distress. These finding were similar to previous studies [26–29]. In addition, a study on Chinese adolescents reported that perceived weight status (overweight or underweight) not actual weight status, was associated with psychological disorder in both genders [9]. The Korean Youth Risk Behavior Web-based Survey showed that girls who perceived themselves as underweight or overweight, as well as boys who perceived themselves as underweight, were at a higher risk of depression [30]. Self-perception of weight depends on subjective appraisement of reality, although it may not always reflect reality, i.e. actual weight, and would indirectly reflect the ideal body shape [26,31]. Moreover, psychiatric distress is stimulated by inaccurate perceptions of oneself, others, and the environment [26]. It is reasonable that weight perception in this current study had a stronger association with psychiatric distress than actual weight status.
- In this study, the association of weight perception with psychiatric distress was not different between genders and this is in line with previous studies [17,26]. However, this finding differs from studies that reported the moderator role for gender in this association [28,32]. This difference might be related to the effects of cultural disparity between the populations studied.
- In this study it was observed that 59.1% of students misperceived their body weight. Prevalence of weight misperception has large variations between different studies. In the survey on Korean children and adolescents, 49.3% of students misperceived their weight [33]. Weight misperception rate was 46% among American students and 45.0% in 6 different Central-Eastern European countries [34,35]. Differences between individual characteristics, cultural, and ethical issues may account for the discrepancies in the findings.
- Consistent with other studies [28,34,36], the perception of being underweight was more common in boys than in girls. This may be because of the popularity of a muscular male physique for boys as seen in society and in the media and online, as well as their tendency to want to be big and strong.
- In this study, regardless of actual weight status, both genders had a misperception of excess weight, which was statistically significantly associated with a higher risk of psychiatric distress similar to previous studies [16,27,36]. Moreover, a large sample study in 122,180 school students using the Minnesota Student Survey, reported that students who misperceived themselves as overweight had the highest prevalence of mental distress [15]. Being overweight or obese is not viewed favorably, and the social stigma of being overweight has increased in recent years [27,37,38]. Therefore, children and adolescents who have recognized that their weight status had deviated from the social ideal of being thin, in turn have experienced psychological problems. Misperceptions of being overweight and its association with psychological distress, could have clinical consequences such as eating disorders including anorexia nervosa, harmful ways of weight loss (purging, laxative use), and unhealthy dietary habits [27,39,40].
- According to the findings in this current study, for both genders the risk of feeling worried and depressed were significantly higher in those students who perceived themselves as underweight whilst being a normal weight. In a nationwide survey on the health behaviors of Korean adolescents (12–18 years), a similar finding has been reported, but only in boys [10]. It may be because boys expected to have a muscular body and any deviation from this ideal led them to feelings of depression [28,30]. One possible explanation for differences between the findings of the current study in Iran and the Korean survey is that the perception of being underweight, despite actually being a normal weight, may be an expression of body dissatisfaction that would lead to lack of self-confidence as well as feelings of depression.
- The current study showed that students of both genders with the perception of being underweight but having excess weight, was associated with a low risk of aggression and anxiety. In previous studies, the emotional problems associated with a misperception of being underweight have received less attention than the problems of being overweight [10,41].
- It has also been reported that underweight students who perceived themselves as a normal weight, experienced a healthier psychological status than their peers [8].
- In this current study, girls with excess weight who perceived themselves as being a normal weight, had lower risk of worrying, experiencing aggression, anxiety, and depression, than girls with an accurate perception of their weight. However, boys who had excess weight and perceived themselves as being a normal weight, had a lower risk of experiencing aggression and depression, and their risk of worrying or anxiety was not reduced. This finding is in line with the German Health Interview and Examination Survey for Children and Adolescents, which showed the association between perception of normal weight and protective mental health factors [42]. This association might lead to better mental health status, even in those with a higher actual weight status [42]. Indeed, perception of being a normal weight and having body satisfaction, seem to be more important than the actual weight status in affecting psychological health [8].
- The findings of this current study indicate a link between an incorrect perception about body weight status and negative psychological status among children and adolescents in Iran. Although a protective effect was observed for some psychological factors in students who misperceived themselves as a normal weight, weight control policies such as obesity prevention, rely on recognition of actual weight status. In addition, previous studies have reported that misperception about weight status can impact health-related factors including dietary and physical activity patterns during childhood [11,12,14]. Public health policies targeting psychological distress may need to promote healthy attitudes towards body weight perception and self-acceptance, along with actual weight status.
- The main limitation of this study was its cross-sectional design, which does not allow causality to be determined. Moreover, self-reported data on psychiatric distress are subject to recall bias. The study strengths include its novelty in the region and the large nationally representative sample of children and adolescents studied.
Discussion
- Weight misperception, rather than actual weight status is related to psychological distress. Students who perceived their body to have deviated from the societal ideal, were more likely to experience psychological problems compared with those who had an accurate weight perception. Whilst lower risk of experiencing depression, anxiety, and aggression was documented in students who perceived themselves as being of normal weight, regardless of their actual weight status. Intervention programs need to encourage children and adolescents to know what accurate and perceived body weight is, and hence protect their psychological health.
Conclusion
-
Acknowledgements
- The authors are thankful to the students who participated in this study, their school’s staff, project team, and all the relevant administrators.
Acknowledgments
-
Conflicts of Interest
The authors declare that they have no conflicts of interest.
Article information
- 1. Lawler M, Nixon E. Body Dissatisfaction Among Adolescent Boys and Girls: The Effects of Body Mass, Peer Appearance Culture and Internalization of Appearance Ideals. J Youth Adolesc 2011;40(1). 59−71. PMID: 10.1007/s10964-009-9500-2.ArticlePubMedPDF
- 2. Byeon H. Gender differences in the association between weight perception and depression experience among adolescent students. Int Info Inst 2014;17(7). 3493−8.
- 3. Davison KK, Markey CN, Birch LL. A Longitudinal Examination of Patterns in Girls ’ Weight Concerns and Body Dissatisfaction from Ages 5 to 9 Years. Int J Eat Disord 2003;33(3). 320−32. PMID: 10.1002/eat.10142. PMID: 12655629. PMID: 2548285.ArticlePubMedPMC
- 4. Kostanski M, Gullone E. Adolescent body image dissatisfaction: Relationships with self-esteem, anxiety, and depression controlling for body mass. J Child Psychol Psychiatry 1998;39(2). 255−62. PMID: 9669238.ArticlePubMed
- 5. Pinheiro AP, Giugliani ERJ. Body dissatisfaction in Brazilian schoolchildren : prevalence and associated factors. Rev Saude Publica 2006;40(3). 489−96. PMID: 10.1590/S0034-89102006000300018. PMID: 16810374.ArticlePubMedPDF
- 6. Alipour B, Abbasalizad Farhangi M, Dehghan P, et al. Body image perception and its association with body mass index and nutrient intakes among female college students aged 18–35 years from Tabriz, Iran. Eat Weight Disord 2015;20(4). 465−71. PMID: 10.1007/s40519-015-0184-1. PMID: 25701442.ArticlePubMedPDF
- 7. Hatami M, Taib MNM, Djazayery A, et al. Relationship between body image, body dissatisfaction and weight status in Iranian adolescents. Glob Epidemi Obes 2015;3:1PMID: 10.7243/2052-5966-3-1.Article
- 8. Jáuregui-Lobera I, Ezquerra-Cabrera M, Carbonero-Carreño R, et al. Weight misperception, self-reported physical fitness, dieting and some psychological variables as risk factors for eating disorders. Nutrients 2013;5(11). 4486−502. PMID: 10.3390/nu5114486. PMID: 24232917. PMID: 3847744.ArticlePubMedPMC
- 9. Tang J, Yu Y, Du Y, et al. Association between actual weight status, perceived weight and depressive, anxious symptoms in Chinese adolescents: A cross-sectional study. BMC Public Health 2010;10:594PMID: 10.1186/1471-2458-10-594. PMID: 20932280. PMID: 3091556.ArticlePubMedPMCPDF
- 10. Byeon H. Association between weight misperception patterns and depressive symptoms in Korean young adolescents: National cross-sectional study. PLoS One 2015;10(8). e0131322PMID: 10.1371/journal.pone.0131322. PMID: 26313680. PMID: 4551853.ArticlePubMedPMC
- 11. Yan H, Wu Y, Oniffrey T, et al. Body Weight Misperception and Its Association with Unhealthy Eating Behaviors among Adolescents in China. Int J Environ Res Public Health 2018;15(5). 936−46. PMID: 10.3390/ijerph15050936. PMID: 5981975.ArticlePubMedPMC
- 12. Angoorani P, Heshmat R, Ejtehad H, et al. Body weight misperception and health-related factors among Iranian children and adolescents: the CASPIAN-V study. J Pediatr Endocrinol 2017;30(10). 1033−40. PMID: 10.1515/jpem-2017-0149.ArticlePDF
- 13. Lim H, Wang Y. Body weight misperception patterns and their association with health-related factors among adolescents in South Korea. Obesity J 2013;21(12). 2596−603. PMID: 10.1002/oby.20361.Article
- 14. Shin A, Nam CM. Weight perception and its association with socio-demographic and health-related factors among Korean adolescents. BMC Public Health 2015;15:1292−300. PMID: 10.1186/s12889-015-2624-2. PMID: 26703247. PMID: 4690271.ArticlePubMedPMC
- 15. Christoph MJ, Jarrett ES, Gower AL, et al. Weight Status and Weight Perception in Relation to Mental Distress and Psychosocial Protective Factors Among Adolescents. Acad Pediatr 2018;18(1). 51−8. PMID: 10.1016/j.acap.2017.08.007. PMID: 5756678.ArticlePubMed
- 16. Jiang Y, Kempner M, Loucks EB. Weight Misperception and Health Risk Behaviors in Youth: the 2011 US YRBS. Am J Health Behav 2014;38(5). 765−80. PMID: 10.5993/AJHB.38.5.14. PMID: 24933146. PMID: 4635682.ArticlePubMedPMC
- 17. Lo WS, Ho SY, Mak KK, et al. Weight misperception and psychosocial health in normal weight Chinese adolescents. Int J Pediatr Obes 2011;6(Suppl 3). e381−9. PMID: 10.3109/17477166.2010.514342.ArticlePubMed
- 18. Frisco ML, Houle JN, Martin MA. The image in the mirror and the number on the scale: weight, weight perceptions, and adolescents depressive symptoms. J Health Soc Behav 2010;51(2). 215−28. PMID: 10.1177/0022146510372353. PMID: 20617760. PMID: 3610322.ArticlePubMedPMC
- 19. Hayward J, Millar L, Petersen S, et al. When ignorance is bliss: weight perception, body mass index and quality of life in adolescents. Int J Obes 2014;38(10). 1328−34. PMID: 10.1038/ijo.2014.78.ArticlePDF
- 20. Motlagh ME, Ziaodini H, Qorbani M, et al. Methodology and Early Findings of the Fifth Survey of Childhood and Adolescence Surveillance and Prevention of Adult Noncommunicable Disease: The CASPIANV Study. Int J Prev Med 2017;8:4PMID: 10.4103/2008-7802.198915.ArticlePubMedPMC
- 21. World Health Organization [Internet]. Physical status: the use of and interpretation of anthropometry, report of a WHO expert committee Geneva (Switzerland): World Health Organization; 1995 Available from: https://apps.who.int/iris/handle/10665/37003.
- 22. WHO Multicentre Growth Reference Study Group. WHO child growth standards based on length/height, weight and age. Acta Paediatr Suppl 2006;450:76−85. PMID: 16817681.ArticlePubMed
- 23. Centers for Disease Control and Prevention [Internet]. Modified z-scores in the CDC growth charts Available from: https://www.cdc.gov/nccdphp/dnpa/growthcharts/resources/BIV-cutoffs.pdf.
- 24. Flegal KM, Cole TJ. Construction of LMS parameters for the Centers for Disease Control and Prevention 2000 growth charts. Natl Health Stat Report 2013;(63). 1−3. PMID: 24992748.
- 25. Caro DH, Cortés D. Measuring family socioeconomic status: An illustration using data from PIRLS 2006. IERI Monogr Ser 2012;5(1). 9−33.
- 26. Gray WN, Crawford MJ, Follansbee-Junger K, et al. Associations between Actual and Perceived Weight and Psychosocial Functioning in Children: The Importance of Child Perceptions. Child Obes 2012;8(2). 147−54. PMID: 10.1089/chi.2011.0033. PMID: 22799514.ArticlePubMed
- 27. Jáuregui-Lobera I, Bolanos Rios P, Santiago-Fernández MJ, et al. Perception of weight and psychological variables in a sample of Spanish adolescents. Diabetes Metab Syndr Obes 2011;4:245−51. PMID: 10.2147/DMSO.S21009. PMID: 21792323. PMID: 3139532.ArticlePubMedPMC
- 28. Schiefelbein EL, Mirchandani GG, George GC, et al. Association between depressed mood and perceived weight in middle and high school age students: Texas 2004–2005. Matern Child Health J 2012;16(1). 169−76. PMID: 10.1007/s10995-010-0733-1.ArticlePubMedPDF
- 29. Xie B, Chou CP, Spruijt-Metz D, et al. Weight Perception, Academic Performance, and Psychological Factors in Chinese Adolescents. Am J Health Behav 2006;30(2). 115−24. PMID: 10.5993/AJHB.30.2.1. PMID: 16533096.ArticlePubMed
- 30. Lim Y, Kim B. Body Mass Index, Body Weight Perception, and Depressed Mood in Korean Adolescents. J Korean Acad Child Adolesc Psychiatry 2017;28(1). 31−7. PMID: 10.5765/jkacap.2017.28.1.31.ArticlePDF
- 31. Ozmen D, Ozmen E, Ergin D, et al. The association of self-esteem, depression and body satisfaction with obesity among Turkish adolescents. BMC Public Health 2007;7:80PMID: 10.1186/1471-2458-7-80. PMID: 17506879. PMID: 1888702.ArticlePubMedPMCPDF
- 32. Cortese S, Falissard B, Angriman M, et al. The Relationship between Body Size and Depression Symptoms in Adolescents. J Pediatr 2009;154(1). 86−90. PMID: 10.1016/j.jpeds.2008.07.040.ArticlePubMed
- 33. Kim S, So WY. Prevalence and sociodemographic trends of weight misperception in Korean adolescents. BMC Public Health 2014;14:452PMID: 10.1186/1471-2458-14-452. PMID: 24885579. PMID: 4047550.ArticlePubMedPMCPDF
- 34. Martin MA, Frisco ML, May AL. Gender and race/ethnic differences in inaccurate weight perceptions among U.S. adolescents. Womens Health Issues 2009;19(5). 292−9. PMID: 10.1016/j.whi.2009.05.003. PMID: 19733799. PMID: 2764324.ArticlePubMedPMC
- 35. Page R, Ihasz F, Uvacsek M, et al. Self-perception of body weight, weight management practices and goals, and other weight-related factors in central and eastern European adolescents. Int Q Community Health Educ 2007;27(1). 39−58. PMID: 10.2190/IQ.27.1.d. PMID: 18039628.Article
- 36. Lo WS, Ho SY, Mak KK, et al. Prospective effects of weight perception and weight comments on psychological health among Chinese adolescents. Acta Paediatr 2009;98(12). 1959−64. PMID: 10.1111/j.1651-2227.2009.01472.x. PMID: 19673720.ArticlePubMed
- 37. Xie B, Chou CP, Spruijt-Metz D, et al. Longitudinal Analysis of Weight Perception and Psychological Factors in Chinese Adolescents. Am J Health Behav 2011;35(1). 92−104. PMID: 10.5993/AJHB.35.1.9.ArticlePubMedPMC
- 38. Perrin EM, Boone-Heinonen J, Field AE, et al. Perception of overweight and self-esteem during adolescence. Int J Eat Disord 2010;43(5). 447−54. PMID: 2882505.ArticlePubMedPMC
- 39. Fan M, Jin Y, Khubchandani J. Overweight misperception among adolescents in the United States. J Pediatr Nurs 2014;29(6). 536−46. PMID: 10.1016/j.pedn.2014.07.009. PMID: 25135882.ArticlePubMed
- 40. Liechty JM. Body Image Distortion and Three Types of Weight Loss Behaviors Among Nonoverweight Girls in the United States. J Adolesc Heal 2010;47(2). 176−82. PMID: 10.1016/j.jadohealth.2010.01.004.Article
- 41. Atlantis E, Ball K. Association between weight perception and psychological distress. Int J Obes 2008;32(4). 715−21. PMID: 10.1038/sj.ijo.0803762.ArticlePDF
- 42. Fuchs T, Eschenbeck H, Krug S, et al. Perception Makes the Difference: The Association of Actual and Perceived Weight Status with Self-Reported and Parent-Reported Personal Resources and Well-Being in Adolescents. Appl Psychol Health Well Being 2012;4(3). 321−40. PMID: 10.1111/j.1758-0854.2012.01077.x. PMID: 23081766.ArticlePubMed
References

| Boys | Girls | Total | p | |
|---|---|---|---|---|
| Age (y) | 12.39 (12.32–12.46) | 12.18 (12.10–12.26) | 12.28 (12.23–12.33) | < 0.001* |
| Weight (kg) | 42.31 (41.92–42.74) | 40.36 (39.97–40.76) | 41.35 (41.06–41.63) | < 0.001* |
| BMI z-score (LMS method) | −0.57 (−0.51–−0.63) | −0.54 (−0.48–−0.60) | −0.56 (−0.50–−0.62) | 0.560 |
|
|
||||
| Actual weight (based on BMI) | ||||
| Underweight | 17.4 (16.5–18.3) | 14.8 (14.0–15.6) | 16.1 (15.5–16.7) | < 0.001* |
| Normal weight | 61.4 (60.4–62.5) | 64.7 (63.6–65.9) | 63.0 (62.3–63.8) | |
| Excess weight | 21.2 (20.3–22.1) | 20.5 (19.5–21.5) | 20.8 (20.2–21.6) | |
|
|
||||
| Body weight perception | ||||
| Underweight | 28.4 (27.4–29.4) | 27.5 (26.5–28.5) | 28.0 (27.5–28.9) | 0.010* |
| Normal | 42.9 (41.8–44.1) | 41.4 (40.4–42.6) | 42.2 (41.1–42.7) | |
| Excess weight | 28.6 (27.6–29.6) | 31.0 (30.0–32.1) | 29.8 (29.1–30.7) | |
|
|
||||
| BMI-BWP agreement | ||||
| Underestimate | 31.8 (30.7–32.9) | 29.7 (28.6–30.7) | 30.8 (30.1–31.7) | 0.010* |
| Correct estimate | 39.9 (38.8–41.0) | 41.9 (40.7–43.1) | 40.9 (39.9–41.5) | |
| Overestimate | 28.3 (27.2–29.4) | 28.4 (27.4–29.5) | 28.4 (26.7–29.2) | |
|
|
||||
| SES | ||||
| Low | 33.6 (32.5–34.7) | 33.3 (32.2–34.4) | 33.5 (32.8–34.4) | 0.080 |
| Moderate | 33.8 (32.7–35.0) | 32.4 (31.3–33.4) | 33.1 (32.3–33.9) | |
| High | 32.6 (31.5–33.6) | 34.3 (33.1–35.4) | 33.4 (32.5–34.1) | |
|
|
||||
| School performance | ||||
| Poor | 32.8 (31.7–33.9) | 28.8 (27.7–29.8) | 30.8 (30.0–31.6) | < 0.001* |
| Good | 67.2 (66.1–68.3) | 71.2 (70.2–72.3) | 69.2 (68.4–70.0) | |
|
|
||||
| Self-perceived health | ||||
| Poor | 18.8 (18.4–20.1) | 19.2 (18.0–19.7) | 19.0 (18.3–19.7) | 0.540 |
| Good | 81.2 (79.9–81.6) | 80.8 (80.3–82.0) | 81.0 (80.3–81.7) | |
|
|
||||
| Living area | ||||
| Rural | 28.7 (27.7–29.9) | 28.4 (27.3–29.4) | 71.4 (70.7–72.1) | 0.660 |
| Urban | 71.3 (70.1–72.3) | 71.6 (70.6–72.7) | 28.6 (27.9–27.3) | |
| Boys (%) | Girls (%) | Total (%) | p | |
|---|---|---|---|---|
| Worthless | ||||
| Yes | 10.3 (9.6–11.2) | 11.5 (10.6–12.3) | 10.9 (10.3–11.5) | 0.060 |
| No | 89.7 (88.8–90.4) | 88.5 (88.7–89.4) | 89.1 (88.5–89.7) | |
|
|
||||
| Worried | ||||
| Yes | 31.7 (30.4–33.0) | 34.6 (33.4–35.9) | 33.2(32.3–34.1) | 0.001* |
| No | 68.3 (67.0–69.6) | 65.4 (64.1–66.6) | 66.8 (65.9–67.7) | |
|
|
||||
| Aggression | ||||
| Yes | 34.8 (33.5–36.0) | 36.9 (35.6–38.2) | 64.2 (63.3–65.1) | 0.020* |
| No | 65.2 (64.0–66.5) | 63.1 (61.8–64.4) | 35.8 (34.9–36.7) | |
|
|
||||
| Insomnia | ||||
| Yes | 19.0 (18.0–20.0) | 20.4 (19.4–21.4) | 19.7 (19.0–20.5) | 0.060 |
| No | 81.0 (80.0–82.0) | 79.6 (76.6–80.6) | 80.3 (79.5–81.0) | |
|
|
||||
| Anxiety | ||||
| Yes | 5.7 (4.2–5.3) | 4.7 (5.1–6.4) | 5.2 (4.8–5.6) | 0.020* |
| No | 94.3 (94.7–95.8) | 95.3 (93.6–94.9) | 94.8 (94.4–95.2) | |
|
|
||||
| Depression | ||||
| Yes | 19.6 (17.9–19.9) | 18.9 (18.6–20.7) | 19.2 (18.5–20.0) | 0.300 |
| No | 80.4 (80.1–82.1) | 81.1 (79.3–81.4) | 80.8 (80.0–81.5) | |
| Boys | Worthless | Worried | Aggression | Insomnia | Anxiety | Depression |
|---|---|---|---|---|---|---|
| OR (95% CI) | OR (95% CI) | OR (95% CI) | OR (95% CI) | OR (95% CI) | OR (95% CI) | |
| Actual weight status (based on BMI) | ||||||
|
|
||||||
| Normal | 1 | 1 | 1 | 1 | 1 | 1 |
| Underweight | 1.19 (0.97–1.46) | 1.11 (0.96–1.28) | 1.04 (0.90–1.20) | 1.17 (1.00–1.38) | 1.15 (0.86–1.54) | 1.01 (0.84–1.21) |
| Excess weight | 1.02 (0.84–1.24) | 1.07 (0.93–1.22) | 0.90 (0.72–1.02) | 0.99 (0.85–1.15) | 1.08 (0.83–1.43) | 1.03 (0.87–1.22) |
|
|
||||||
| Self-perception of weight | ||||||
|
|
||||||
| Normal | 1 | 1 | 1 | 1 | 1 | 1 |
| Underweight | 2.09 (1.67–2.61)* | 1.75 (1.53–1.99)* | 1.20 (1.05–1.38)* | 1.41 (1.20–1.65)* | 0.44 (0.27–0.74)* | 1.85 (1.55–2.21)* |
| Excess weight | 4.10 (3.35–5.10)* | 1.81 (1.59–2.06)* | 2.92 (2.31–3.70)* | 2.68 (2.31–3.11)* | 5.88 (4.40–7.86)* | 3.78 (3.19–4.48)* |
|
|
||||||
| Girls | Worthless | Worried | Aggression | Insomnia | Anxiety | Depression |
| OR (95% CI) | OR (95% CI) | OR (95% CI) | OR (95% CI) | OR (95% CI) | OR (95% CI) | |
|
|
||||||
| Actual weight status (based on BMI) | ||||||
|
|
||||||
| Normal | 1 | 1 | 1 | 1 | 1 | 1 |
| Underweight | 0.92 (0.73–1.15) | 0.97 (0.83–1.13) | 0.89 (0.76–1.04) | 1.03 (0.87–1.23) | 0.89 (0.65–1.22) | 0.90 (0.74–1.10) |
| Excess weight | 1.01 (0.84–1.22) | 0.92 (0.80–1.05) | 0.99 (0.87–1.14) | 0.95 (0.81–1.11) | 0.84 (0.64–1.10) | 0.99 (0.84–1.18) |
|
|
||||||
| Self-perception of weight | ||||||
|
|
||||||
| Normal | 1 | 1 | 1 | 1 | 1 | 1 |
| Underweight | 1.09 (1.53–2.35)* | 1.62 (1.42–1.85)* | 1.19 (1.04–1.36)* | 1.32 (1.13–1.54)* | 0.61 (0.40–0.91)* | 1.76 (1.47–2.11)* |
| Excess weight | 3.18 (2.62–3.85)* | 1.53 (1.34–1.73)* | 3.55 (3.12–4.04)* | 2.23 (1.93–2.58)* | 4.45 (3.40–5.82)* | 3.48 (2.93–4.12)* |
| Boys | Worthless | Worried | Aggression | Insomnia | Anxiety | Depression | |
|---|---|---|---|---|---|---|---|
| Weigh misperception pattern | OR (95% CI) | OR (95% CI) | OR (95% CI) | OR (95% CI) | OR (95% CI) | OR (95% CI) | |
| Underestimate (correct estimate) | |||||||
|
|
|||||||
| BMI | Weight perception | ||||||
| Normal | Under weight | 1.17 (0.92–1.48) | 1.41 (1.23–1.65)* | 0.97 (0.83–1.12) | 1.10 (0.92–1.32) | 0.26 (0.15–0.46)* | 1.25 (1.02–1.53)* |
| Excess weight | Normal | 0.79 (0.56–1.13) | 0.96 (0.78–1.18) | 0.69 (0.56–0.86)* | 0.82 (0.64–1.06) | 0.58 (0.32–1.04) | 0.68 (0.49–0.92)* |
| Excess weight | Under weight | 1.12 (0.75–1.67) | 1.32 (1.04–1.96) | 0.54 (0.41–0.71)* | 0.89 (0.65–1.21) | 0.21 (0.07–0.66)* | 1.26 (0.92–1.71) |
|
|
|||||||
| Overestimate (correct estimate) | |||||||
|
|
|||||||
| BMI | Weight perception | ||||||
| Normal | Excess weight | 2.62 (2.14–3.21)* | 1.55 (1.33–1.80)* | 3.23 (2.77–3.76)* | 2.08 (1.76–2.45)* | 3.17 (2.43–4.13)* | 1.24 (1.02–1.51)* |
| Under weight | Normal | 0.56 (0.35–0.87)* | 0.91 (0.72–1.14) | 0.78 (0.62–0.98)* | 0.81 (0.61–1.08) | 0.43 (0.21–0.90)* | 0.70 (0.50–0.92)* |
| Under weight | Excess weight | 2.64 (1.96–3.55)* | 1.39 (1.09–1.76)* | 2.92 (2.31–3.70)* | 2.36 (1.84–3.02)* | 3.81 (2.66–5.46)* | 1.30 (0.92–1.70) |
|
|
|||||||
| Girls | Worthless | Worried | Aggression | Insomnia | Anxiety | Depression | |
| Weigh misperception pattern | OR (95% CI) | OR (95% CI) | OR (95% CI) | OR (95% CI) | OR (95% CI) | OR (95% CI) | |
|
|
|||||||
| Underestimate (correct estimate) | |||||||
|
|
|||||||
| BMI | Weight perception | ||||||
| Normal | Under weight | 1.38 (1.10–1.72)* | 1.42 (1.22–1.64)* | 0.90 (0.77–1.05) | 1.13 (0.95–1.35) | 0.43 (0.28–0.66)* | 1.22 (1.01–1.47)* |
| Excess weight | Normal | 0.69 (0.46–1.01) | 0.75 (0.60–0.94)* | 0.65 (0.52–0.82)* | 0.84 (0.65–1.10) | 0.41 (0.20–0.81)* | 0.71 (0.51–0.98)* |
| Excess weight | Under weight | 1.40 (0.93–2.04) | 1.36 (1.04–1.77)* | 0.61 (0.45–0.81)* | 0.88 (0.63–1.22) | 0.07 (0.01–0.51)* | 1.08 (0.77–1.53) |
|
|
|||||||
| Overestimate (correct estimate) | |||||||
|
|
|||||||
| BMI | Weight perception | ||||||
| Normal | Excess weight | 2.23 (1.85–2.70)* | 1.29 (1.12–1.49)* | 2.47 (2.14–2.85)* | 1.85 (1.58–2.17)* | 2.87 (2.25–3.66)* | 2.42 (2.04–2.89)* |
| Under weight | Normal | 0.66 (0.42–1.03)* | 0.77 (0.60–0.99)* | 0.55 (0.42–0.72)* | 0.72 (0.53–0.99)* | 0.58 (0.30–1.12)* | 0.52 (0.35–0.77)* |
| Under weight | Excess weight | 2.66 (1.90–3.74)* | 1.55 (1.17–2.05)* | 3.29 (2.45–4.41)* | 2.45 (1.90–3.39)* | 3.18 (2.10–4.84)* | 2.65 (1.89–3.72)* |
Figure & Data
References
Citations
- Association between weight, weight perception, weight teasing and mental health among adolescents
Wenxin Gu, Xiaoyan Yu, Yinliang Tan, Zhiping Yu, Jingfen Zhu
Child and Adolescent Psychiatry and Mental Health.2024;[Epub] CrossRef - Body image and behavioural and emotional difficulties in German children and adolescents
Lea Krause, Tanja Poulain, Wieland Kiess, Mandy Vogel
BMC Pediatrics.2023;[Epub] CrossRef - Extracting the Hidden Patterns Affecting Mental Health through Data Mining Techniques
Maryam Jahanbakhsh, Asal Aghadavodian Jolfaee, Roya Kelishadi, Mohammad Sattari
Journal of Advances in Medical and Biomedical Rese.2022; 30(140): 281. CrossRef - Migrating Populations and Health: Risk Factors for Cardiovascular Disease and Metabolic Syndrome
Talma Rosenthal, Rhian M. Touyz, Suzanne Oparil
Current Hypertension Reports.2022; 24(9): 325. CrossRef - Understanding the Turkish adolescents' weight perception: A cross‐sectional study
Figen I. Esenay, Tufan A. Sezer
Journal of Child and Adolescent Psychiatric Nursin.2022; 35(4): 349. CrossRef - Scene Matching Method for Children’s Psychological Distress Based on Deep Learning Algorithm
Junli Su, Wei Wang
Complexity.2021; 2021: 1. CrossRef - Weight self-perception in adolescents: evidence from a population-based study
Mariana Contiero San Martini, Daniela de Assumpção, Marilisa Berti de Azevedo Barros, Antônio de Azevedo Barros Filho, Josiemer Mattei
Public Health Nutrition.2021; 24(7): 1648. CrossRef - Childhood obesity prevention policies in Iran: a policy analysis of agenda-setting using Kingdon’s multiple streams
Shahnaz Taghizadeh, Rahim Khodayari-Zarnaq, Mahdieh Abbasalizad Farhangi
BMC Pediatrics.2021;[Epub] CrossRef - Stakeholders perspectives of barriers and facilitators of childhood obesity prevention policies in Iran: A Delphi method study
Shahnaz Taghizadeh, Mahdieh Abbasalizad Farhangi, Rahim Khodayari-Zarnaq
BMC Public Health.2021;[Epub] CrossRef - Between perception and reality: BMI in adolescence
Alessia Margarito, Eleonora Guaitoli, Giovanni Di Trapani, Lorenzo Petrucci
Journal of Advanced Health Care.2020;[Epub] CrossRef
 PubReader
 ePub Link
 Cite
Cite