Articles
- Page Path
- HOME > Osong Public Health Res Perspect > Volume 10(6); 2019 > Article
-
Original Article
Distribution of PathogenicVibrio Species in the Coastal Seawater of South Korea (2017–2018) - Seung Hun Leea, Hee Jung Leea, Go Eun Myunga, Eun Jin Choia, In A Kima, Young Il Jeongb, Gi Jun Parkc, Sang Moon Soha
-
Osong Public Health and Research Perspectives 2019;10(6):337-342.
DOI: https://doi.org/10.24171/j.phrp.2019.10.6.03
Published online: December 31, 2019
aYeosu National Quarantine Station, Korea Centers for Disease Control and Prevention, Yeosu, Korea
bDivision of Viral Disease Research, Korea Centers for Disease Control and Prevention, Osong, Korea
cDivision of Quarantine Support, Korea Centers for Disease Control and Prevention, Osong, Korea
- *Corresponding author: Sang Moon Soh, Yeosu National Quarantine Station, Korea Centers for Disease Control and Prevention, Yeosu, Korea, E-mail: ssm1344@korea.kr
• Received: July 21, 2019 • Revised: November 18, 2019 • Accepted: November 27, 2019
Copyright ©2019, Korea Centers for Disease Control and Prevention
This is an open access article under the CC BY-NC-ND license (http://creativecommons.org/licenses/by-nc-nd/4.0/).
Abstract
-
Objectives
- Pathogenic Vibrio species are widely distributed in warm estuarine and coastal environments, and can infect humans through the consumption of raw or mishandled contaminated seafood and seawater. For this reason, the distribution of these bacteria in South Korea was investigated.
-
Methods
- Seawater samples were collected from 145 coastal area points in the aquatic environment in which Vibrio species live. Environmental data (i.e., water temperature, salinity, turbidity, and atmospheric temperature) was collected which may help predict the distribution of the species (data not shown). Seawater samples were filtered, and incubated overnight in alkaline peptone water, at 37°C. Using species-specific polymerase chain reaction methods, screening tests were performed for the hlyA, ctxA, vvhA, and tlh genes. Clones of pathogenic Vibrio species were isolated using 3 selective plating media.
-
Results
- In 2017, total seawater isolation rates for Vibrio vulnificus, Vibrio cholerae (non-pathogenic, non-O1, non-O139 serogroups), and Vibrio parahaemolyticus were 15.82%, 13.18%, 65.80%, respectively. However, in 2018 isolation rates for each were 21.81%, 19.40%, and 70.05%, respectively.
-
Conclusion
- The isolation rates of pathogenic Vibrio species positively correlated with the temperature of seawater and atmosphere, but negatively correlated with salinity and turbidity. From 2017 to 2018, the most frequent seawater-isolated Vibrio species were V. parahaemolyticus (68.10 %), V. vulnificus (16.54%), and non-toxigenic V. cholerae (19.58%). Comprehensive monitoring, prevention, and control efforts are needed to protect the public from pathogenic Vibrio species.
- More than 100 Vibrio bacterial species which are ubiquitous in seawater, marine, and estuarine environments, have been identified worldwide. Among all Vibrio species, the most clinically significant include V. cholerae, V. parahaemolyticus, and V. vulnificus [1,2]. Cholera is an infectious disease caused by V. cholerae; a symptom of which is severe diarrhea and this may lead to dehydration, and death if untreated. Moreover, cholera outbreaks are seasonal, and in specific biogeographical zones with warmer temperatures, and ecology [1]. Cholera is an ancient disease and V. cholerae reportedly has killed millions of people from warm tropical to cold temperate regions of the world. Evidently, Vibrio infections occur during summer and early fall, corresponding to the period of warmer seawater temperatures [3]. Almost all cases of food-borne Vibrio infections are associated with a recent history of handling or consuming seafood (primarily raw oysters) [1–5].
- By the end of the 20th century, it was reported that V. cholerae was completely eliminated from most parts of the developed world. However, it remained endemic to many tropical regions [4]. In recent years, this species has been detected in temperate regions and in many developed countries worldwide [6–11]. Its extreme diversity has facilitated its prevalence in North America, and among the prominent halophilic Vibrio species, V. parahaemolyticus is the leading cause of seafood-associated disease globally [7, 9]. In the 1950s, seafood-borne Vibrio species were reported, wherein a strain which caused the pandemic outbreak and its variants, were identified in far East Japan [3,12]. In South Korea, the main cause of seafood-borne disease was determined to be infection by V. parahaemolyticus, leading to 18 outbreaks (223 patients) in 2010, 9 outbreaks (133 patients) in 2011, 11 outbreaks (195 patients) in 2012, 5 outbreaks (40 patients) in 2013, 7 outbreaks (78 patients) in 2014, 5 outbreaks (25 patients) in 2015, 22 outbreaks (251 patients) in 2016, and 9 outbreaks (354 patients) in 2017 (Korea Ministry of Food and Drug Safety, 2019). Similarly, V. vulnificus was another leading cause of seafood-borne illness and mortality in Korea, resulting in deaths from infection, and specifically 371 patients and 183 deaths in a 7-year period from 2011 to 2017 [Korea Centers for Disease Control and Prevention (KCDC), 2019]. According to the US Centers for Disease Control and Prevention, since 2011, the incidence of Vibrio infections has increased dramatically in the United States [13].
- Many surveillance and research studies regarding human pathogenic Vibrio species, ranging from bacterial characterization, to antimicrobial resistance, distribution, and human infection, have been reported in South Korea [14–19]. In 2001 and 2016, 2 toxigenic V. cholerae outbreaks were reported to be due to the ingestion of raw fish and raw seafood in South Korea [17,20]. Since South Korea has specific peninsular plateau geographical characteristics, and its people traditionally favor seafood consumption, KCDC has been investigating the seawater distribution of Vibrio species, and analyzing the genetic characteristics of isolated strains and their relationship with environmental factors, to use these data for the prevention of human infectious disease [21,22]. Based on these results, the KCDC aims to prevent the emergence of human infection due to the abnormal growth of pathogenic Vibrio species resulting from climate change. These surveillance results may be helpful to track the reasons for epidemic outbreaks of Vibrio species.
Introduction
- 1. Sample collection and amplification
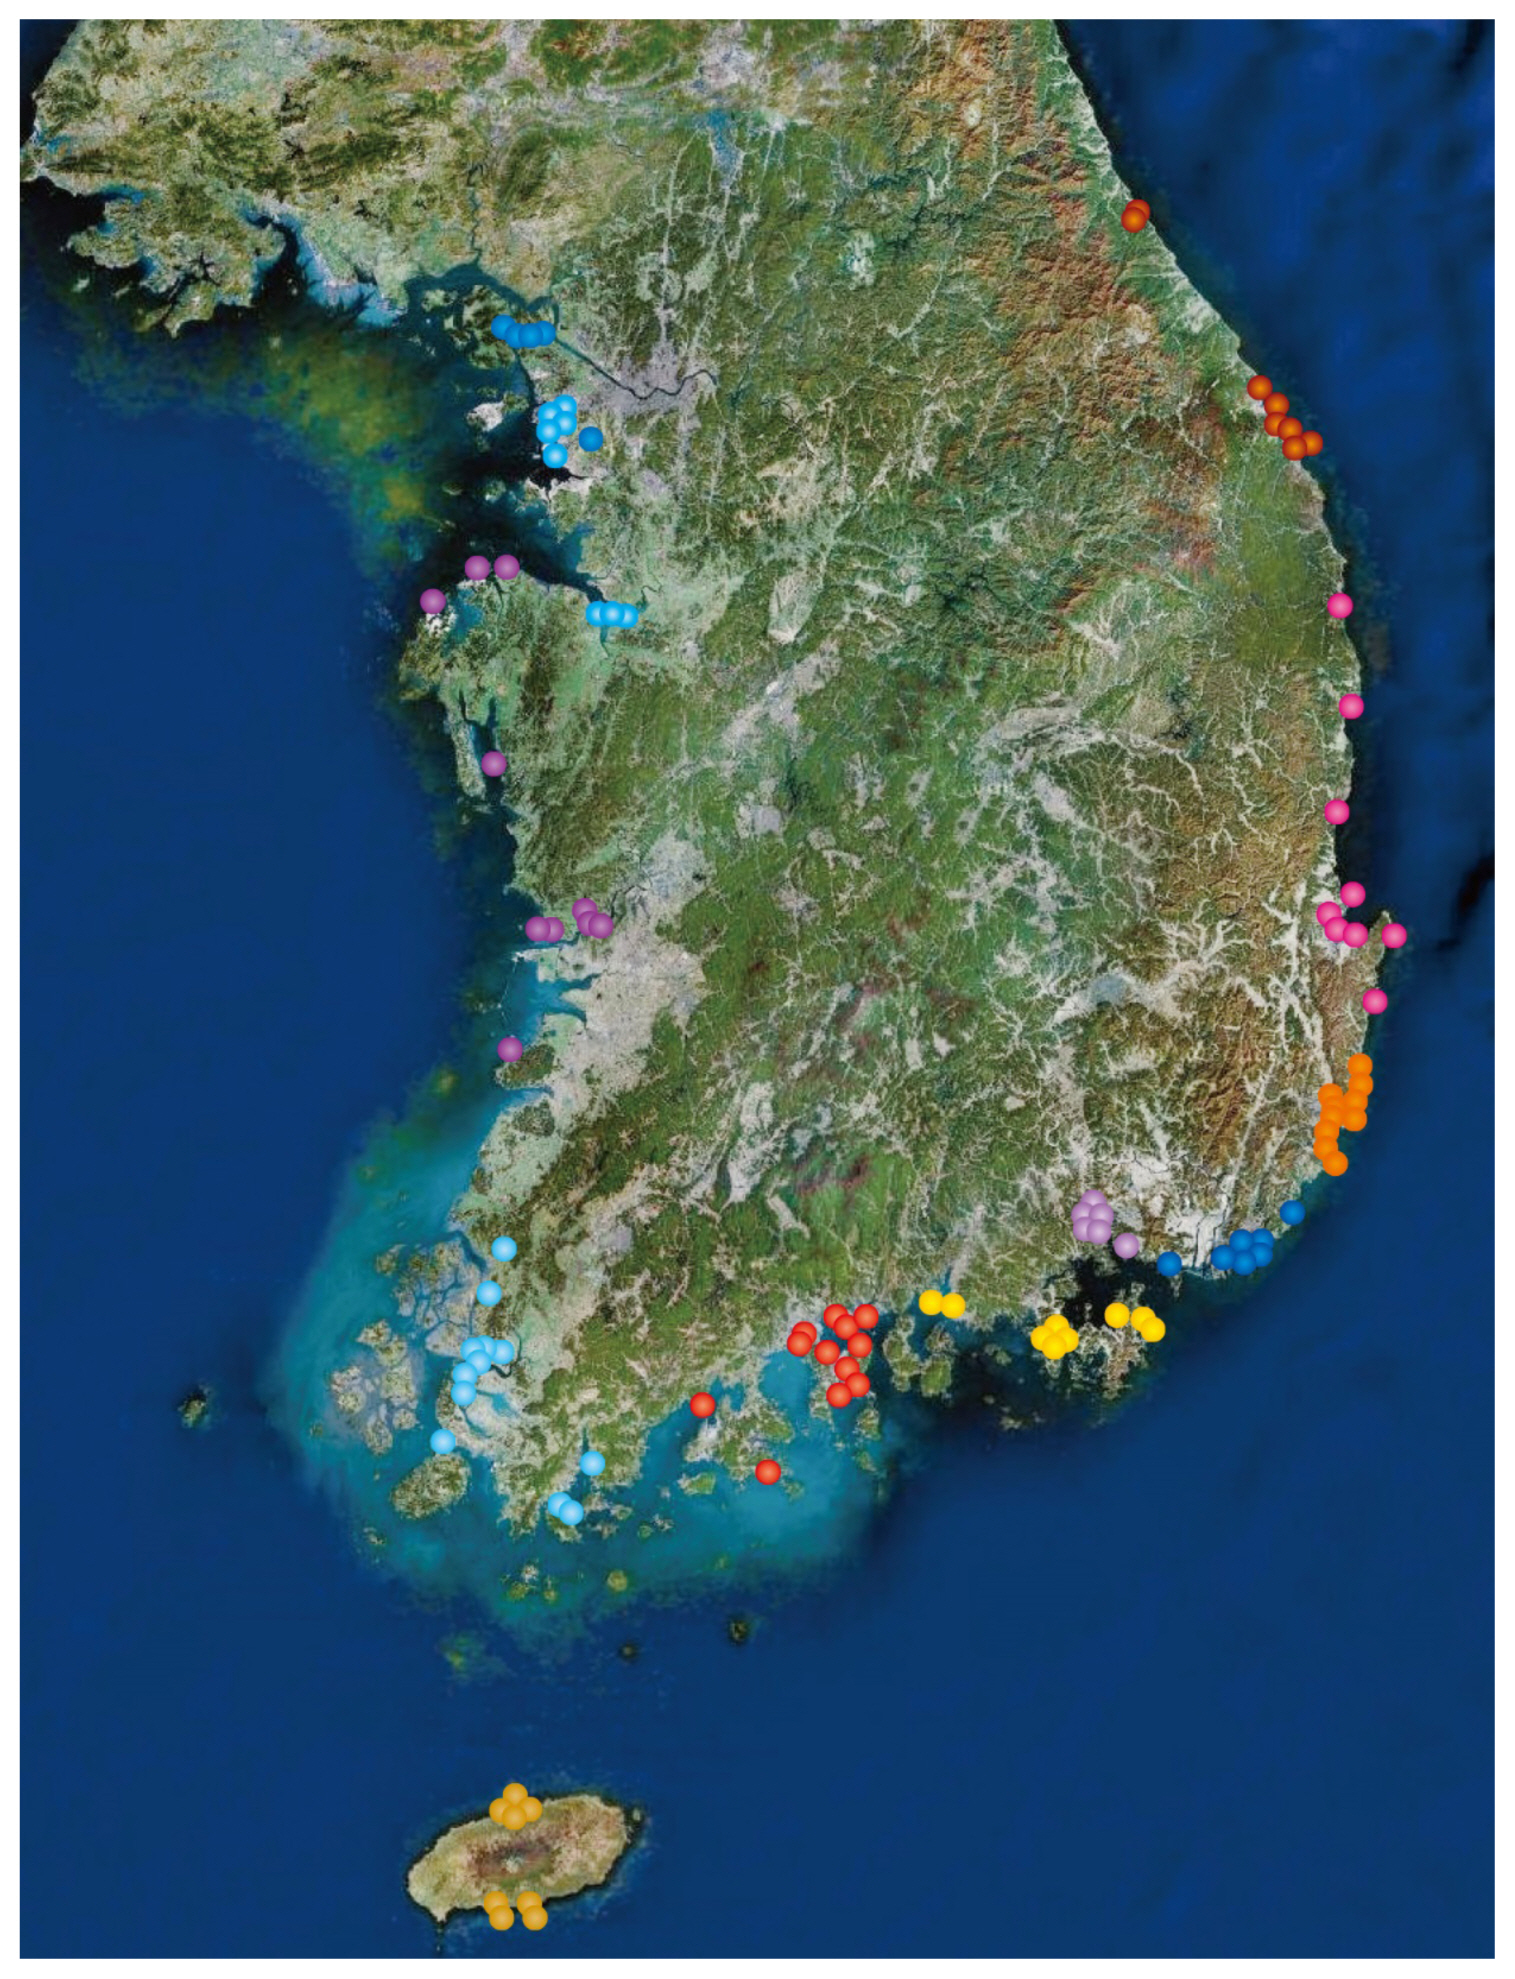
- Seawater samples were collected bimonthly during 2017–2018 from 145 South Korean coastal area collection points. Sample collection was performed by 11 Coastal Quarantine stations and 2 Metropolitan Institutes of Health and Environment (Jeollanamo-do and Incheon; Figure 1). More than 500 mL of seawater was collected within 1 meter of the seawater surface. Collected seawater samples were filtered using a 0.45-μm nitrocellulose membrane filter paper (Pall laboratories, NY, USA). After filtration, membranes were incubated in 5 mL of alkaline peptone water (Oxoid, Basingstoke, UK) for 8–16 hours, at 37°C.
- 2. DNA extraction
- For DNA extraction, 1 mL of seawater-enriched broth sample was used. Seawater samples were pelleted by centrifugation at 12,000 × g for 2 minutes, at room temperature. After discarding the supernatant, 200 μL of distilled water was added to each sample. Samples were then heated to 100°C for 10 minutes, and subsequently cooled to −20°C for 10 minutes. DNA was collected by centrifugation at 12,000 × g for 2 minutes, at room temperature. The extracted DNA samples were stored at −20°C until required.
- 3. Screening of Vibrio species
- Specifically-designed primers were used to amplify a fragment from each of the species-specific genes: V. cholerae (hlyA and ctxA), V. vulnificus (vvhA), and V. parahaemolyticus (tlh). The Vibrio 4-plex real-time polymerase chain reaction (PCR) Kit (Kogenebiothech, Seoul, South Korea) was used for genetic characterization, according to the manufacturer’s real-time PCR protocol (Applied Biosystems, CA, USA).
- 4. Vibrio species culture and colony isolation
- Seawater-enriched broth samples were spread on selective medium plates, namely CHROMagar Vibrio (CHROMagar, Paris, France), thiosulfate citrate bile salt agar (Difco, MI, USA), and Tryptic Soy Agar (Difco, Michigan, USA), and incubated for > 16 hours at 37°C. After incubation, colonies that were suspected as Vibrio species were picked from each plate, and were confirmed using the VITEK II (BioMérieux, Paris, France) system and real-time PCR.
- 5. Genetic determination of V. vulnificus
- Colonies that were suspected to be of V. vulnificus were extracted from each plate and confirmed by PCR methods for environmental and clinical types. Tri-primer PCR methods [23] based on targeted 16S rRNA genes, were performed using a Bio-Rad Thermal Cycler (Bio-Rad, CA, USA) using Maxime PCR PreMix I-star taq (Intronbio, Seongnam, South Korea) containing 2.5 U i-Star Taq DNA polymerase, 2.5 mM of each dNTP, 1×reaction buffer, and 1×gel loading dye as stabilizer.
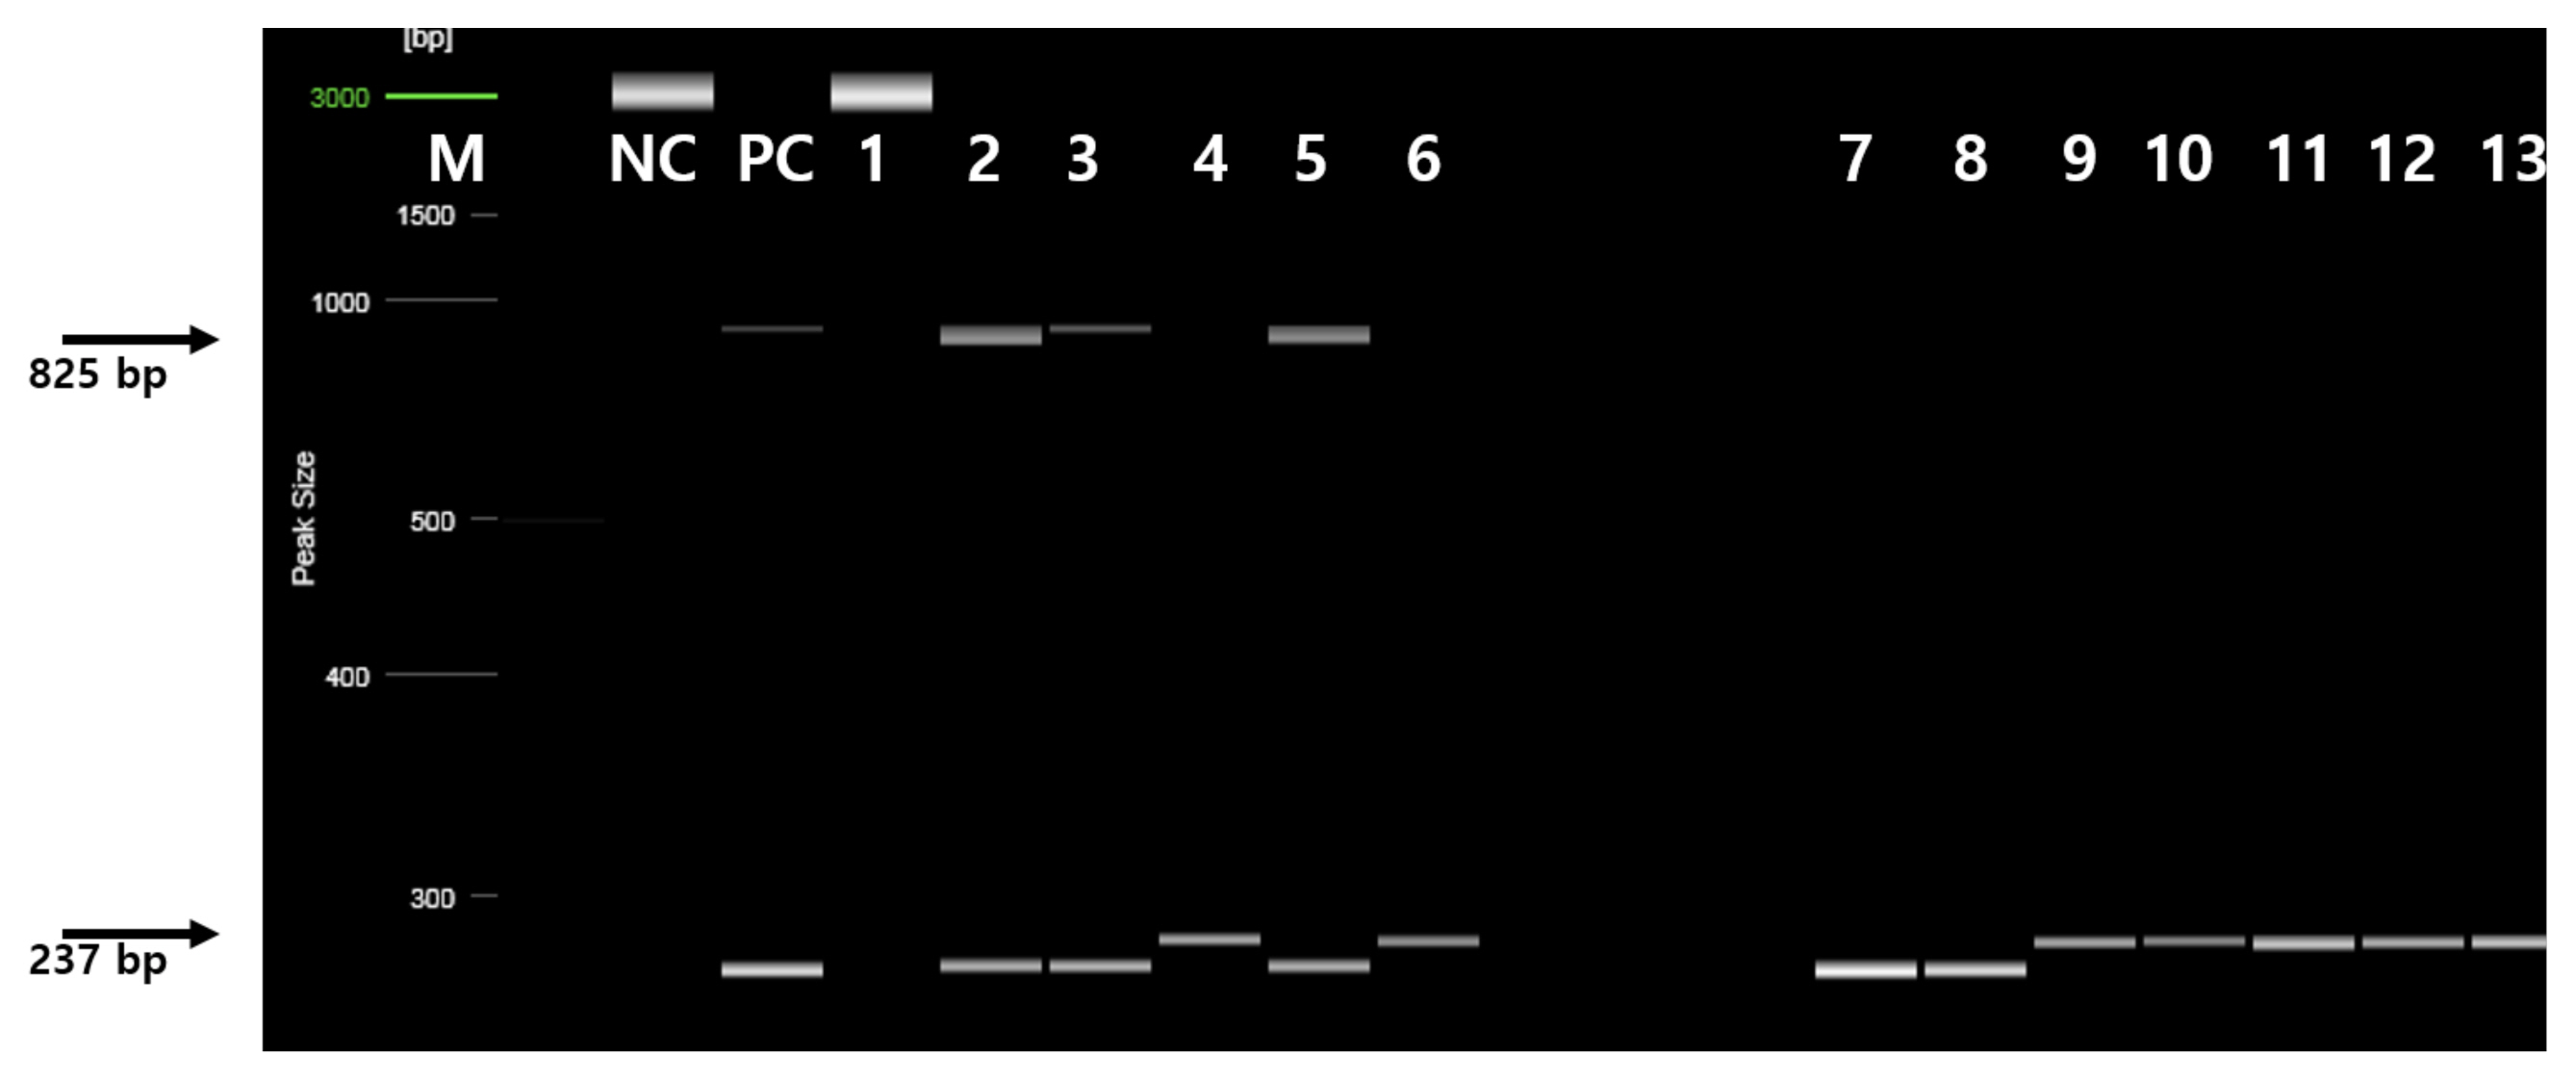
- Conventional tri-primer PCR was performed for amplification of the 16S rRNA gene [23] and specifically, the 237-bp (Vib 2F and 3R) and 825-bp (Vib 1F and 3R) fragments of 16S rRNA to distinguish between environmental and clinical types. The 16S rRNA tri-primer set which was used included Vib 1F (5′-GTGGTAGTGTTAATAGCACT-3′), Vib 2F (5′-TCTAGCGGAGACGCTGGA-3′), and Vib 3R (5′-GCTCACTTTCGCAAGTTGGCC-3′). The PCR conditions were 95°C for 3 minutes, followed by 35 cycles of denaturation at 95°C for 30 seconds, annealing at 55°C for 30 seconds, extension at 72°C for 30 seconds, and a single extension cycle at 72°C for 5 minutes.
Materials and Methods
- From 2017 to 2018, and for the 145 surveillance points, the annual percentages of seawater-isolated, laboratory-confirmed, pathogenic Vibrio cases reported in South Korea in 2017 were: hlyA, 28.52% (678/2,377 cases), ctxA, 0% (0/2,377 cases), vvhA, 33.61% (799/2,377 cases), and tlh, 77.32% (1,838/2,377 cases). In 2018 pathogenic Vibrio cases were: hlyA, 35.06% (987/2,815 cases) ctxA, 0% (0/2,815 cases), vvhA, 43.09% (1,213/2,815 cases), and tlh, 74.85% (2,107/2,815 cases), which were an increase on 2017 figures (Table 1). Similarly, isolation of bacteria increased in 2018 relative to those in 2017 (Table 1). However, there was no significant difference in mortality rates of V. vulnificus-infected patients between 2017 and 2018. In 2017 and 2018, the occurrence of 46 V. vulnificus septicemia cases related to eating contaminated seafood, raw fish, and oysters were reported (Table 2). Mortality rates for patients suffering septicemia caused by V. vulnificus were 52.2% (24/46) in 2017, and 42.6% (20/47) in 2018 (Table 2). Of note, septicemia cases where the infection was caused by V. vulnificus resulted in the highest death rates among all foodborne infectious diseases.
- Analysis of seawater-isolated V. vulnificus by 16S rRNA-based classification revealed 4 environmental and 81 clinical type cases in 2017. In 2018, there was an increase in both clinical (n = 38) and environmental types (n = 489) compared to those in the previous year (Table 3; Figure 2). From 2017 to 2018, the monthly distribution of seawater-isolated, laboratory-confirmed pathogenic strains, had the highest numbers of V. cholerae non-O1/non-O139 in August 2017 and July 2018, V. vulnificus in August 2017 and September 2018, and V. parahaemolyticus in August 2017 and September 2018 (Tables 4 and 5).
Results
- Researchers have historically paid attention to disease caused by V. cholerae and placed relatively minor medical focus on other Vibrio species, some of which are now emerging as pathogens that can cause human disease with mild to severe symptoms [24]. The surveillance work in this study was representative of the Vibrio species and specifically, the coastal seawater distribution of pathogenic Vibrio species in South Korea. However, it should be noted that the relationship to human infections may not be adequately represented.
- Before the endemic outbreak of toxigenic V. cholerae in 2016, the KCDC had been investigating seawater distribution of Vibrio species based on only 3 surveillance points for each of the 11 coastal quarantine stations [17,20,21,25]. Following the endemic outbreak, the surveillance points were extended to 13, for each of the 11 coastal quarantine stations. Thus, the surveillance areas for pathogenic Vibrio species had been expanded to monitor coastal areas in Korea.
- As previously described, V. vulnificus infections in South Korea are the leading cause of septicemia and high mortality, due to seafood-borne and seawater-borne illnesses. To control and prevent human infectious diseases caused by pathogenic Vibrio species, plans for future surveillance projects and survey points should consider analyzing the results of marine environmental monitoring projects. Parameters should include temperature changes due to sub-tropical climate, seawater flow, coastal geographical conditions, seawater exchange cycle, and population movement according to urban planning. The surveillance should also consider changes in the distribution patterns of pathogenic Vibrio species in the marine environment, the direct relevance to patient disease outbreaks, and death. This should be considered in terms of algae seawater migration, resident time spent in seawater (reflective of the topographical factors of the Korean coast), and the possibility of contact with pathogenic Vibrio species.
- In conclusion, this report describes the need to prevent Vibrio species infections in the general public, and for the surveillance of pathogens in Korean coastal waters. Continuous coastal water monitoring of Vibrio pathogens, associated with the early detection of infectious agents, could reduce infection risks, and help to understand the natural ecology and distribution of Vibrio pathogens. However, due to the changing nature of the tropical climate, it is necessary to prepare for outbreaks of human infections caused by non-seasonal growth of Vibrio species. Therefore, comprehensive monitoring, prevention, and control efforts are required as part of the strategy to protect the public from foodborne and waterborne diseases.
Discussion
-
Acknowledgements
- This research was supported by a fund (no.: 4800-4851-304-210-13) from the Korean Center for Disease Control and Prevention. We wish to thank all 11 Coastal Quarantine stations, as well as the Jeollanam-do and Incheon Metropolitan Institutes of Health and Environment, for all data collected used in this study.
Acknowledgments
-
Conflicts of Interest
All authors declare that there are no conflicts of interest.
Article information
- 1. Colwell RR. Global climate and infectious disease: the cholera paradigm. Nature 1996;274(5295). 2025−31.Article
- 2. Thompson FL, Iida T, Swings J. Biodiversity of Vibrios. Microbiol Mol Biol Rev 2004;68(3). 403−31. PMID: 10.1128/MMBR.68.3.403-431.2004. PMID: 15353563. PMID: 515257.ArticlePubMedPMC
- 3. Baker-Austin C, Trinanes J, Gonsales-Escalona N, et al. Non-cholera Vibrios: The microbial barometer of climate change. Trends Microbiol 2017;25(1). 76−84. PMID: 10.1016/j.tim.2016.09.008.ArticlePubMed
- 4. The Lancet Infectious Disease. Ending cholera for all. Lancet Infect Dis 2018;18(10). 1047PMID: 10.1016/S1473-3099(18)30562-0.ArticlePubMed
- 5. Iwamoto M, Ayers T, Mahon BE, et al. Epidemiology of seafood-associated infections in the United States. Clin Microbiol Rev 2010;23(2). 399−411. PMID: 10.1128/CMR.00059-09. PMID: 20375359. PMID: 2863362.ArticlePubMedPMC
- 6. Baker-Austin C, Trinanes JA, Salmenlinna S, et al. Heat wave-associated vibriosis, Sweden and Finland, 2014. Emerg Infect Dis 2016;22(7). 1216−20. PMID: 10.3201/eid2207.151996. PMID: 27314874. PMID: 4918148.ArticlePubMedPMC
- 7. Banerjee SK, Kearney AK, Nadon CA, et al. Phenotypic and genotypic characterization of Canadian clinical isolates of Vibrio parahaemolyticus collected from 2000 to 2009. J Clin Microbiol 2014;52(4). 1081−8. PMID: 10.1128/JCM.03047-13. PMID: 24452166. PMID: 3993483.ArticlePubMedPMC
- 8. Huehn S, Eichhorn C, Urmersbach S, et al. Pathogenic Vibrios in environmental, seafood and clinical sources in Germany. Int J Med Microbiol 2014;304(7). 843−50. PMID: 10.1016/j.ijmm.2014.07.010. PMID: 25129553.ArticlePubMed
- 9. Jones JL, Lüdeke CH, Bowers JC, et al. Biochemical, serological, and virulence characterization of clinical and oyster Vibrio parahaemolyticus isolates. J Clin Microbiol 2012;50(7). 2343−52. PMID: 10.1128/JCM.00196-12. PMID: 22535979. PMID: 3405591.ArticlePubMedPMC
- 10. Turner JW, Paranjpye RN, Landis ED, et al. Population structure of clinical and environmental Vibrio parahaemolyticus from the Pacific Northwest coast of the United States. PLoS One 2013;8(2). e55726PMID: 10.1371/journal.pone.0055726. PMID: 23409028. PMID: 3567088.ArticlePubMedPMC
- 11. Banerjee SK, Rutley R, Busseya J. Diversity and dynamics of the Canadian coastal Vibrio community: An emerging trend detected in the temperate regions. J Bacteriol 2018;200(15). e00787−17. PMID: 10.1128/JB.00787-17. PMID: 29735763. PMID: 6040189.ArticlePubMedPMC
- 12. Nair GB, Ramamurthy T, Bhattacharya SK, et al. Global dissemination of Vibrio parahaemolyticus serotype O3:K6 and its serovariants. Clin Microbiol Rev 2007;20(1). 39−48. PMID: 10.1128/CMR.00025-06. PMID: 17223622. PMID: 1797631.ArticlePubMedPMC
- 13. Elmahdi S, DaSilva LV, Parveen S. Antibiotic resistance of Vibrio parahaemolyticus and Vibrio vulnificus in various countries: a review. Food Microbiol 2016;57(14). 128−34. PMID: 10.1016/j.fm.2016.02.008. PMID: 27052711.ArticlePubMed
- 14. Lee HK, Shin OR, Lee DG, et al. A case of Vibrio cholerae non-O1/O139 gastroenteritis. Korean J Lab Med 2004;24(6). 386−8.
- 15. Yang JH, Mok JS, Jung YJ, et al. Distribution and antimicrobial susceptibility of Vibrio species associated with zooplankton in coastal area of Korea. Mar Pollut Bull 2017;125(1–2). 39−44. PMID: 10.1016/j.marpolbul.2017.07.054. PMID: 28781188.ArticlePubMed
- 16. Di DYW, Lee A, Jang J, et al. Season-specific occurrence of potentially pathogenic Vibrio spp. on the southern coast of South Korea. Appl Environ Microbiol 2017;83(3). e02680−16. PMID: 10.1128/AEM.02680-16. PMID: 5244290.ArticlePubMedPMC
- 17. Kim JH, Lee J, Hong S, et al. Cholerae outbreak due to Raw seafood consumption in South Korea, 2016. Am J Trop Hyg 2018;99(1). 168−70. PMID: 10.4269/ajtmh.17-0646.Article
- 18. Lee KH, Heo ST, Kim YR, et al. Isolation of Vibrio vulnificus from seawater and emerging Vibrio vulnificus septicemia on Jeju Island. Infect Chemother 2014;46(2). 106−9. PMID: 10.3947/ic.2014.46.2.106. PMID: 25024873. PMID: 4091370.ArticlePubMedPMC
- 19. Park J, Lee CS. Vibrio vulnificus Infection. N Engl J Med 2018;379(4). 375PMID: 10.1056/NEJMicm1716464. PMID: 30044934.ArticlePubMed
- 20. Na HY, Lee DY, Yoo CK. Surveillance of pathogenic Vibrio spp. from marine environment in Korea, 2014. Public Health Wkly Rep 2015;8(24). 542−7. [in Korean].
- 21. Lee JH, Lim HS, Lee K, et al. Epidemiologic investigation on an outbreak of cholera in Gyeongsangbuk-do, Korea, 2001. Korea J Prev Med 2002;35(4). 295−304.
- 22. Na HY, Hong SH, Chung GT. The relationship of pathogenic Vibrio spp. with marine environmental factors, Korea, 2013–2015. Public Health Wkly Rep 2016;9(9). 154−8. [in Korean].
- 23. Kim MS, Jeong HD. Development of 16S rRNA targeted PCR methods for the detection and differentiation of Vibrio vulnificus in marine environments. Aquaculture 2001;193(3–4). 199−211. PMID: 10.1016/S0044-8486(00)00495-6.Article
- 24. Osunla CA, Okoh AI. Vibrio pathogens: A public health concern in rural water resources in Sub-Saharan Africa. Int J Environ Res Public Health 2017;14(10). E1188PMID: 10.3390/ijerph14101188. PMID: 28991153. PMID: 5664689.Article
- 25. Jeong YI, Myung GE, Choi EJ, et al. Distribution of pathogenic Vibrio in the aquatic environment adjacent to coastal areas of South Korea and analysis of the environmental factors affecting their occurrence. J Environ Health Sci 2018;44(2). 133−42.
References
Figure 1Study area comprising the 145 sampling points along the whole coastal region of South Korea.

Figure 2
Conventional PCR results of the amplification of the 16S rRNA gene.
Lane 9–13: clinical type and lanes 2, 3, and 5: environmental type of Vibrio vulnificus.
M = maker; NC = negative control; PC= positive control (237 and 825 bp), clinical type (237 bp) and environmental type (237 and 825 bp); PCR = polymerase chain reaction.

Table 1PCR amplification, and positive isolation of 3 pathogenic Vibrio species in the coastal seawater of South Korea from 2017 to 2018.
Table 2Occurrence of septicemia cases and deaths caused by Vibrio vulnificus, during 2017 and 2018.
| Jan | Feb | Mar | Apr | May | Jun | Jul | Aug | Sep | Oct | Nov | Dec | Total | |
|---|---|---|---|---|---|---|---|---|---|---|---|---|---|
| 2017 | 0 | 0 | 0 | 1 | 0* (1)† | 1 (1) | 2 | 13 (8) | 19 (11) | 9 (3) | 1 | 0 | 46 (24) |
| 2018 | 0 | 0 | 0 | 1 | 0 | 2 | 7 (3) | 16 (8) | 10 (6) | 11 (3) | 0 | 0 | 47 (20) |
Table 3Classification of Vibrio vulnificus seawater isolates based on tri-primer PCR amplification of 16S rRNA.
| Year | Environmental-type | Clinical-type | No. total isolates |
|---|---|---|---|
| 2017 | 4 | 81 | 313 |
| 2018 | 38 | 489 | 546 |
Table 4Monthly occurrence and distribution of pathogenic Vibrio species (detected by real-time PCR and colony isolation), from seawater samples collected at 145 points, from 35 coastal sites in South Korea during 2017.
Table 5Monthly occurrence and distribution of pathogenic Vibrio species as detected by real-time PCR and colony isolation from seawater samples collected at 145 points from 35 coastal sites in South Korea, 2018.
Figure & Data
References
Citations
Citations to this article as recorded by 
- Bacterial biocontrol of vibriosis in shrimp: A review
Esti Harpeni, Alim Isnansetyo, Indah Istiqomah, Murwantoko
Aquaculture International.2024;[Epub] CrossRef - Design of a multi-epitope vaccine (vme-VAC/MST-1) against cholera and vibriosis based on reverse vaccinology and immunoinformatics approaches
Pedro Henrique Marques, Thais Cristina Vilela Rodrigues, Eduardo Horta Santos, Lucas Bleicher, Flavia Figueira Aburjaile, Flaviano S. Martins, Carlo Jose Freire Oliveira, Vasco Azevedo, Sandeep Tiwari, Siomar Soares
Journal of Biomolecular Structure and Dynamics.2023; : 1. CrossRef - Nested Spatial and Temporal Modeling of Environmental Conditions Associated With Genetic Markers of Vibrio parahaemolyticus in Washington State Pacific Oysters
Brendan Fries, Benjamin J. K. Davis, Anne E. Corrigan, Angelo DePaola, Frank C. Curriero
Frontiers in Microbiology.2022;[Epub] CrossRef - Spatial and temporal effects of fish feed on antibiotic resistance in coastal aquaculture farms
Shahbaz Raza, Sangki Choi, Minjeong Lee, Jingyeong Shin, Heejong Son, Jinhua Wang, Young Mo Kim
Environmental Research.2022; 212: 113177. CrossRef - An Assay Combining Droplet Digital PCR With Propidium Monoazide Treatment for the Accurate Detection of Live Cells of Vibrio vulnificus in Plasma Samples
Ling Hu, Yidong Fu, Shun Zhang, Zhilei Pan, Jiang Xia, Peng Zhu, Jing Guo
Frontiers in Microbiology.2022;[Epub] CrossRef - Seasonal variation, virulence gene and antibiotic resistance of Vibrio in a semi-enclosed bay with mariculture (Dongshan Bay, Southern China)
Qiancheng Gao, Xiaowan Ma, Zhichao Wang, Haisheng Chen, Yu Luo, Bi Wu, Shanni Qi, Miaozhen Lin, Jing Tian, Ying Qiao, Hans-Peter Grossart, Wei Xu, Lixing Huang
Marine Pollution Bulletin.2022; 184: 114112. CrossRef - Molecular Epidemiology of Antimicrobial Resistance and Virulence Profiles of Escherichia coli, Salmonella spp., and Vibrio spp. Isolated from Coastal Seawater for Aquaculture
Saharuetai Jeamsripong, Varangkana Thaotumpitak, Saran Anuntawirun, Nawaphorn Roongrojmongkhon, Edward R. Atwill, Woranich Hinthong
Antibiotics.2022; 11(12): 1688. CrossRef - Meteorological and Water Quality Factors Associated with Microbial Diversity in Coastal Water from Intensified Oyster Production Areas of Thailand
Saharuetai Jeamsripong, Varangkana Thaotumpitak, Saran Anuntawirun, Nawaphorn Roongrojmongkhon, Edward R. Atwill
Water.2022; 14(23): 3838. CrossRef - Predictive models for the effect of environmental factors on the abundance of Vibrio parahaemolyticus in oyster farms in Taiwan using extreme gradient boosting
Nodali Ndraha, Hsin-I Hsiao, Yi-Zeng Hsieh, Abani K. Pradhan
Food Control.2021; 130: 108353. CrossRef - Prevalence, detection of virulence genes and antimicrobial susceptibility of pathogen Vibrio species isolated from different types of seafood samples at “La Nueva Viga” market in Mexico City
Ana Karen Álvarez-Contreras, Elsa Irma Quiñones-Ramírez, Carlos Vázquez-Salinas
Antonie van Leeuwenhoek.2021; 114(9): 1417. CrossRef
 PubReader
 ePub Link
 Cite
Cite