Articles
- Page Path
- HOME > Osong Public Health Res Perspect > Volume 9(5); 2018 > Article
-
Original Article
Public Awareness of Early and Late Complications of Type 2 Diabetes - Application of Latent Profile Analysis in Determining Questionnaire Cut-Off Points - Nasrin Shirmohammadia, Ali Reza Soltanianb, Shiva Borzoueic
-
Osong Public Health and Research Perspectives 2018;9(5):261-268.
DOI: https://doi.org/10.24171/j.phrp.2018.9.5.08
Published online: October 31, 2018
aModeling of noncommunicable diseases Research Center, School of Public Health, Hamadan University of Medical Sciences, Hamadan, Iran
bDepartment of Biostatistics, Modeling of noncommunicable diseases Research Center, School of Public Health, Hamadan University of Medical Sciences, Hamadan, Iran
cDepartment of Internal Medicine, School of Medicine, Hamadan University of Medical Sciences, Hamadan, Iran
- *Corresponding author: Ali Reza Soltanian, Department of Biostatistics, Modeling of noncommunicable diseases Research Center, School of Public Health, Hamadan University of Medical Sciences, Hamadan, Iran, E-mail: soltanian@umsha.ac.ir
Copyright ©2018, Korea Centers for Disease Control and Prevention
This is an open access article under the CC BY-NC-ND license (http://creativecommons.org/licenses/by-nc-nd/4.0/)
Abstract
-
Objectives
- A questionnaire was designed to determine public understanding of early and late complications of Type 2 diabetes mellitus (T2DM).
-
Methods
- A cross-sectional study was performed in participants who were selected using a multi-stage sampling method and a standard questionnaire of 67 questions was proposed. An expert panel selected 53 closed-ended questions for content validity to be included in the questionnaire. The reliability of the questionnaire was tested using Cronbach’s alpha coefficient giving a score of 0.84.
-
Results
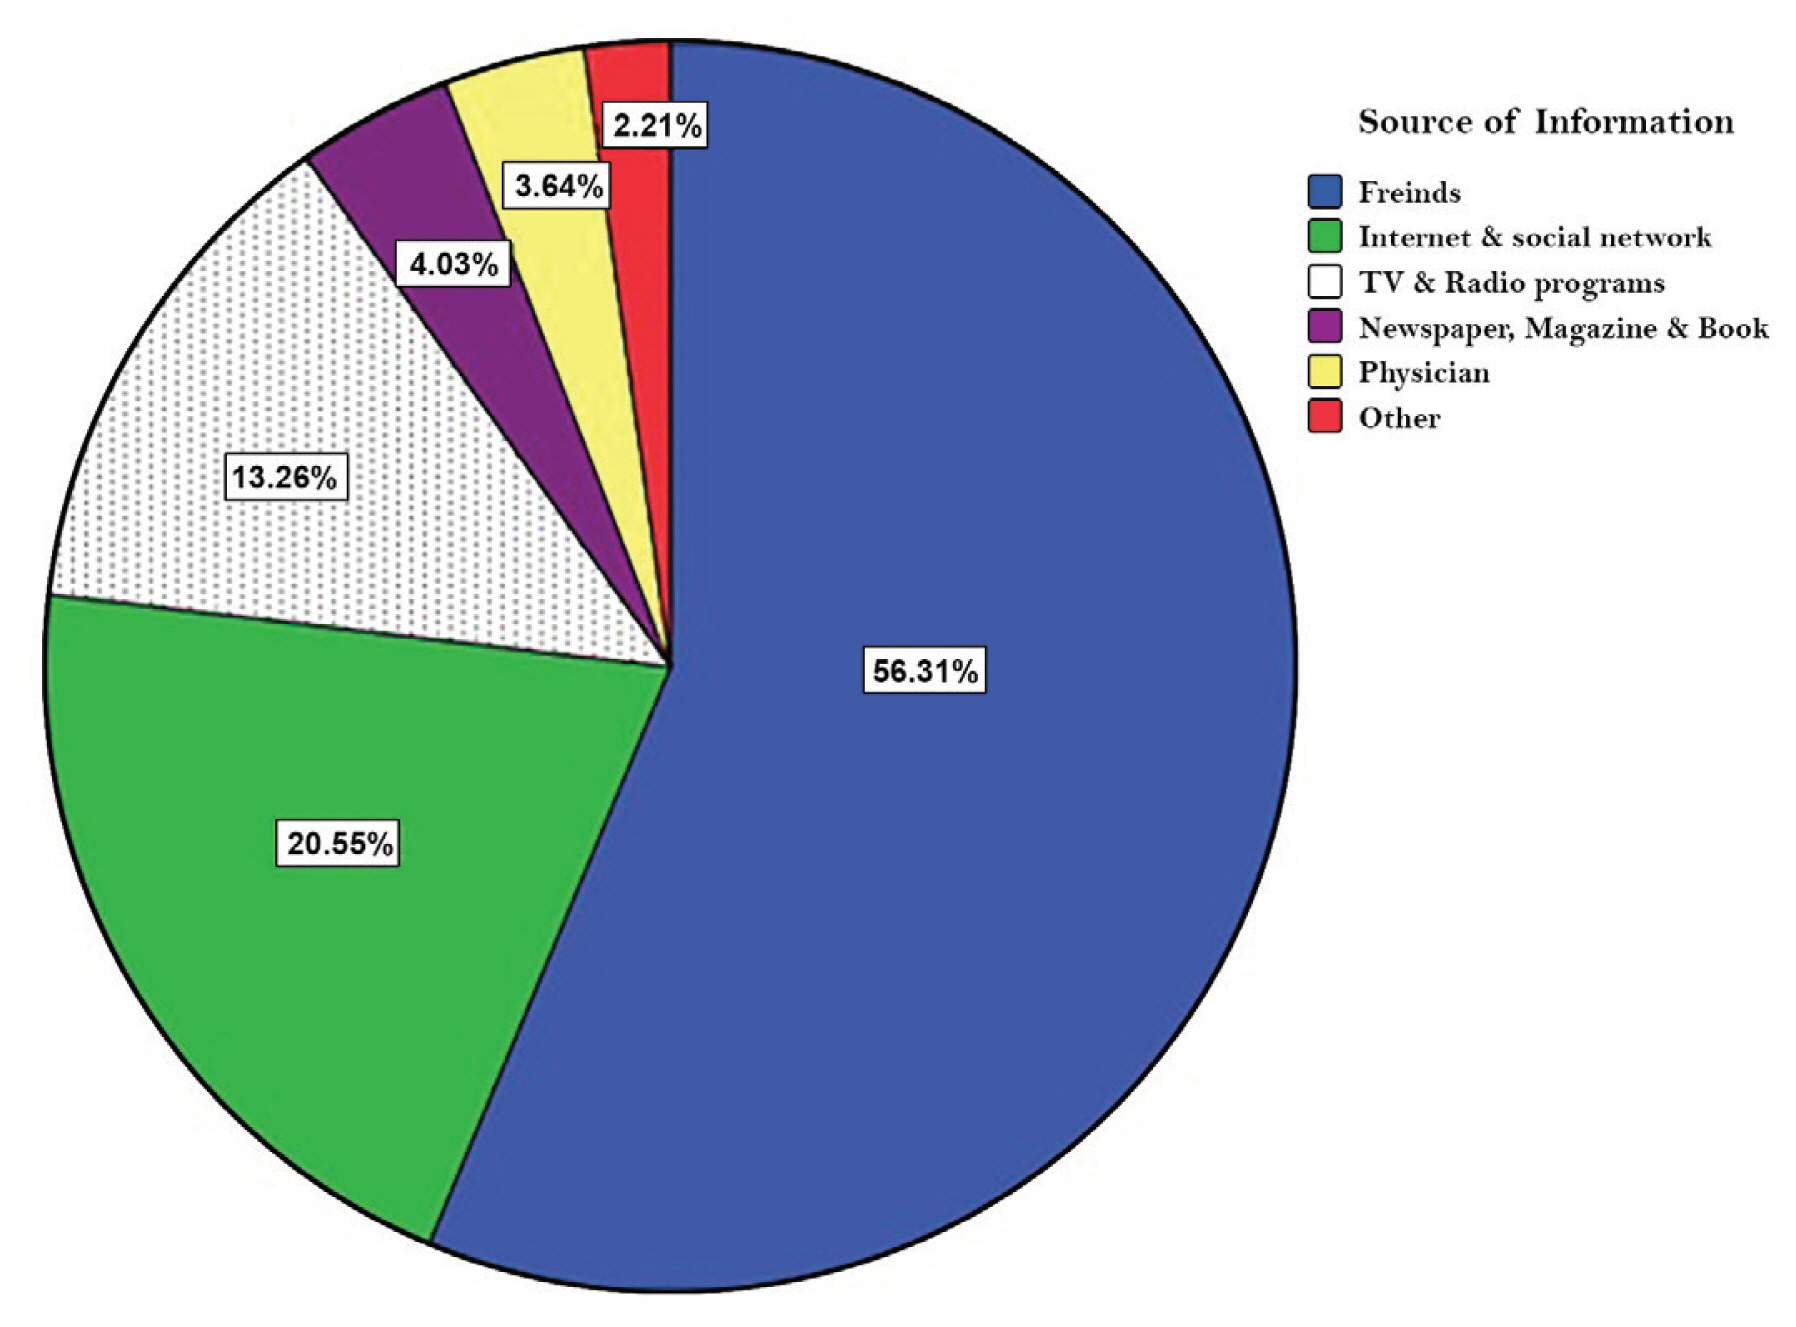
- Of the 825 participants, 443 (57.6%) were male, and 322 (41.87%) were 40 years or more. The proportion of low-, moderate- and high- awareness about T2DM and its complications was 29.26%, 62.68%, and 8.06%, respectively. Friends (56.31%) and internet and social networks (20.55%) were the 2 major sources of awareness, respectively. The medical staff (e.g., physicians) had the lowest share in the level of public awareness (3.64%) compared to other sources.
-
Conclusion
- These results present data that shows the general population awareness of T2DM is low. Healthcare policymakers need to be effective at raising awarenes of diabetes and it should be through improved education.
- Type 2 diabetes mellitus (T2DM) is a non-communicable disease that is prevalent in all societies, with progression higher in low- or moderate-income countries [1]. In addition, according to the World Health Organization (WHO), the diabetes prevalence in the world has doubled from 1980 (4.7%) to 2014 (8.5%) [2]. In addition, in recent years the prevalence of diabetes in low- and middle-income countries has risen faster than in high-income countries [2].
- Diabetes was the leading cause of 5.1 million deaths worldwide in 2012, and the deaths in low- and middle-income countries occurs predominantly before the age of 70 years [2]. In addition, diabetes creates many complications such as heart attack [3], stroke [4], vision loss [5], and renal failure [6]. A previous study has indicated that deaths from T2DM are rising [7].
- It should be noted that increasing knowledge and awareness for the prevention of Type 1 diabetes has been ineffective, but it is thought that increasing awareness may lead to reductions in the prevalence of T2DM [2]. Early diagnosis of T2DM is necessary to prevent and reduce the human burden of the disease. Therefore, assessment of public awareness on T2DM and identifying people with low awareness is very important for effective health planning. On the other hand, raising the level of awareness of people with a low level of knowledge about diabetes can help prevent T2DM. Measuring the awareness rate of individuals is difficult without the use of a suitable tool such as a questionnaire. Despite the large number of questionnaire tools that have been developed to measure awareness on T2DM, numerous studies have used crude scores to assess awareness. In those studies, awareness scores could not be categorized into statistically distinct subgroups (e.g., low-, moderate-, or high- awareness). The first aim of the present study was to determine statistically distinct subgroups and identify a cut-off point based on awareness scores. The second aim was to investigate the relationship between public awareness of T2DM and socio-demographic factors.
Introduction
- 1. Participants
- In this cross-sectional study, 825 healthy participants were recruited from Hamadan, west of Iran in 2016. Of the 825 questionnaires, 769 (93.21%) participants returned completed questionnaires. Participants were selected by a multi-stage sampling method, and informed consent obtained. Firstly, 15 centers of the 32 health centers were randomly sampled. Secondly, 11 registered individuals were randomly sampled in each health center as the primary point of the cluster. Thirdly, in each cluster, in addition to the primary point of the cluster, 4 eligible people were selected in their neighborhood (i.e., a sample size of each cluster was 5).
- The Research Council and the Ethics Committee of Hamadan University of Medical Sciences approved the study (IR.UMSHA.REC.1394.238). Informed consent was obtained from all individual participants included in the study.
- 2. Questionnaire
- In the present study, a standard questionnaire was used to measure public awareness of T2DM and its complications, which included 53 closed-ended questions (containing 7 subscales, such as fundamentals of diabetes, common symptoms of diabetes, early complications of T2DM, late complications of diabetes, diet, methods for blood sugar control, and source of information about T2DM). The answer to each question had 3 options (i.e., yes, no and I do not know). The correct answer was given a score of 1, and the incorrect answer/I do not know was given a score of zero. Firstly, 67 questions were designed according to an expert panel (n = 10), with 53 questions confirmed. The content validity of the questions was approved by the expert panel. In addition, confirmatory factor analysis was used to determine goodness of fit of the questionnaire. To determine the content validity ratio, the expert panel should judge each item with the question: “Is diabetes awareness measured by this item?” They chose 1 of 3 answers; “essential,” “useful but not essential,” or “neither necessary nor useful” to the performance of the construct. Content validity ratio was considered to be more than 0.8.
- Soltanian et al [8] determined internal consistency of the questionnaire and reported that Cronbach’s alpha coefficient and ICC were 0.84 and 0.82, respectively.
- 3. Latent Profile Model
- Before determining the cut-off points, it needs to be specified that the data can be divided into several categories using latent profile analysis (LPA). In other words, LPA was used to determine the number of classes or subgroups based on the participants’ awareness scores. Using LPA, the probability of assigning each individual to the subgroups was determined and the results were considered as the gold standard. A latent profile analysis for the response vector of p normally distributed variables (i = 1,…, p) with K classes (j = 1,…, K) defined as a finite mixture model [9, 10] (see Equation 1):
- where, ηj is the probability that any individual is a member of class
- 4. The goodness of fit criteria for evaluation LPA
- After dividing the knowledge scores of individuals into several subgroups (e.g., 1, 2 and 3 subgroups), the goodness of their fitness was examined and 1 of them selected. To increase the accuracy of the selection of the number of subgroups, several goodness of fit criteria were applied including Akaike’s Information Criteria (AIC) [11], Bayesian Information Criteria (BIC) [12], Sample size adjusted Bayesian Information Criteria (SSABIC) [13], Lo-Mendell-Rubin Adjusted Likelihood Ratio Test (LMRT) [14] and the Entropy criterion for determining the number of latent classes and accuracy of classifying individuals [10]. The lower values of AIC, BIC, SSABIC indicate more parsimonious models [11–13]. The LMRT statistically compares a normal mixture distribution model with a lower number of classes against an alternative normal mixture distribution model with more number of classes. A significant p value indicates that the model with more number of classes fits better than another one [10, 14]. The Entropy criterion determines the accuracy of classifying individuals into their appropriate classes where higher values indicate better fits. The Entropy values > 0.80 indicate that the latent classes are highly discriminating [9, 14].
- 5. Determination of cut-off points
- The number and measure of cut-off points were determined using Youden’s index [15], and each individual was assigned to a subgroup based on the cut-off points. The surfaceunder the ROC curve was calculated using the results of the LPA (as the gold standard) and the Youden’s index [16]. The cut-off points that have the highest surfaceunder the ROC curve were selected as optimal cut-off points.
- The Youden’s index takes an optimal value means that the correct classification is maximum overall. The Youden’s index can take a value between 0 and 1 in practical applications, corresponding to an inadequate and a good pointer, respectively.
- In this study, qualitative variables were described by frequency, and qualitative variables were described as mean ± SD. Statistical analyses were performed using M-plus 6.0 [17], R 3.3.0 package of DiagTest3Grp [18].
Materials and Methods
- In this study, the response rate to the questionnaire was 93.21%, and the proportion of male and female respondants was 57.6% (n = 443) and 42.4% (n = 326), respectively. More than half of the participants (58.13%) were 40 years or less.
- 1. Latent profile analysis
- A latent profile analysis with 1-, 2- and 3- latent classes was performed on the 7 dimensions of the awareness questionnaire for T2DM. Five indices (Table 1) were used to decide whether awareness scores would be divided into 1, 2 or 3 subgroups. The results suggested that the knowledge scores should be divided into 3 subgroups [e.g., low-, moderate-, and high- awareness (Table 1)].
- 2. The optimal cut-off points
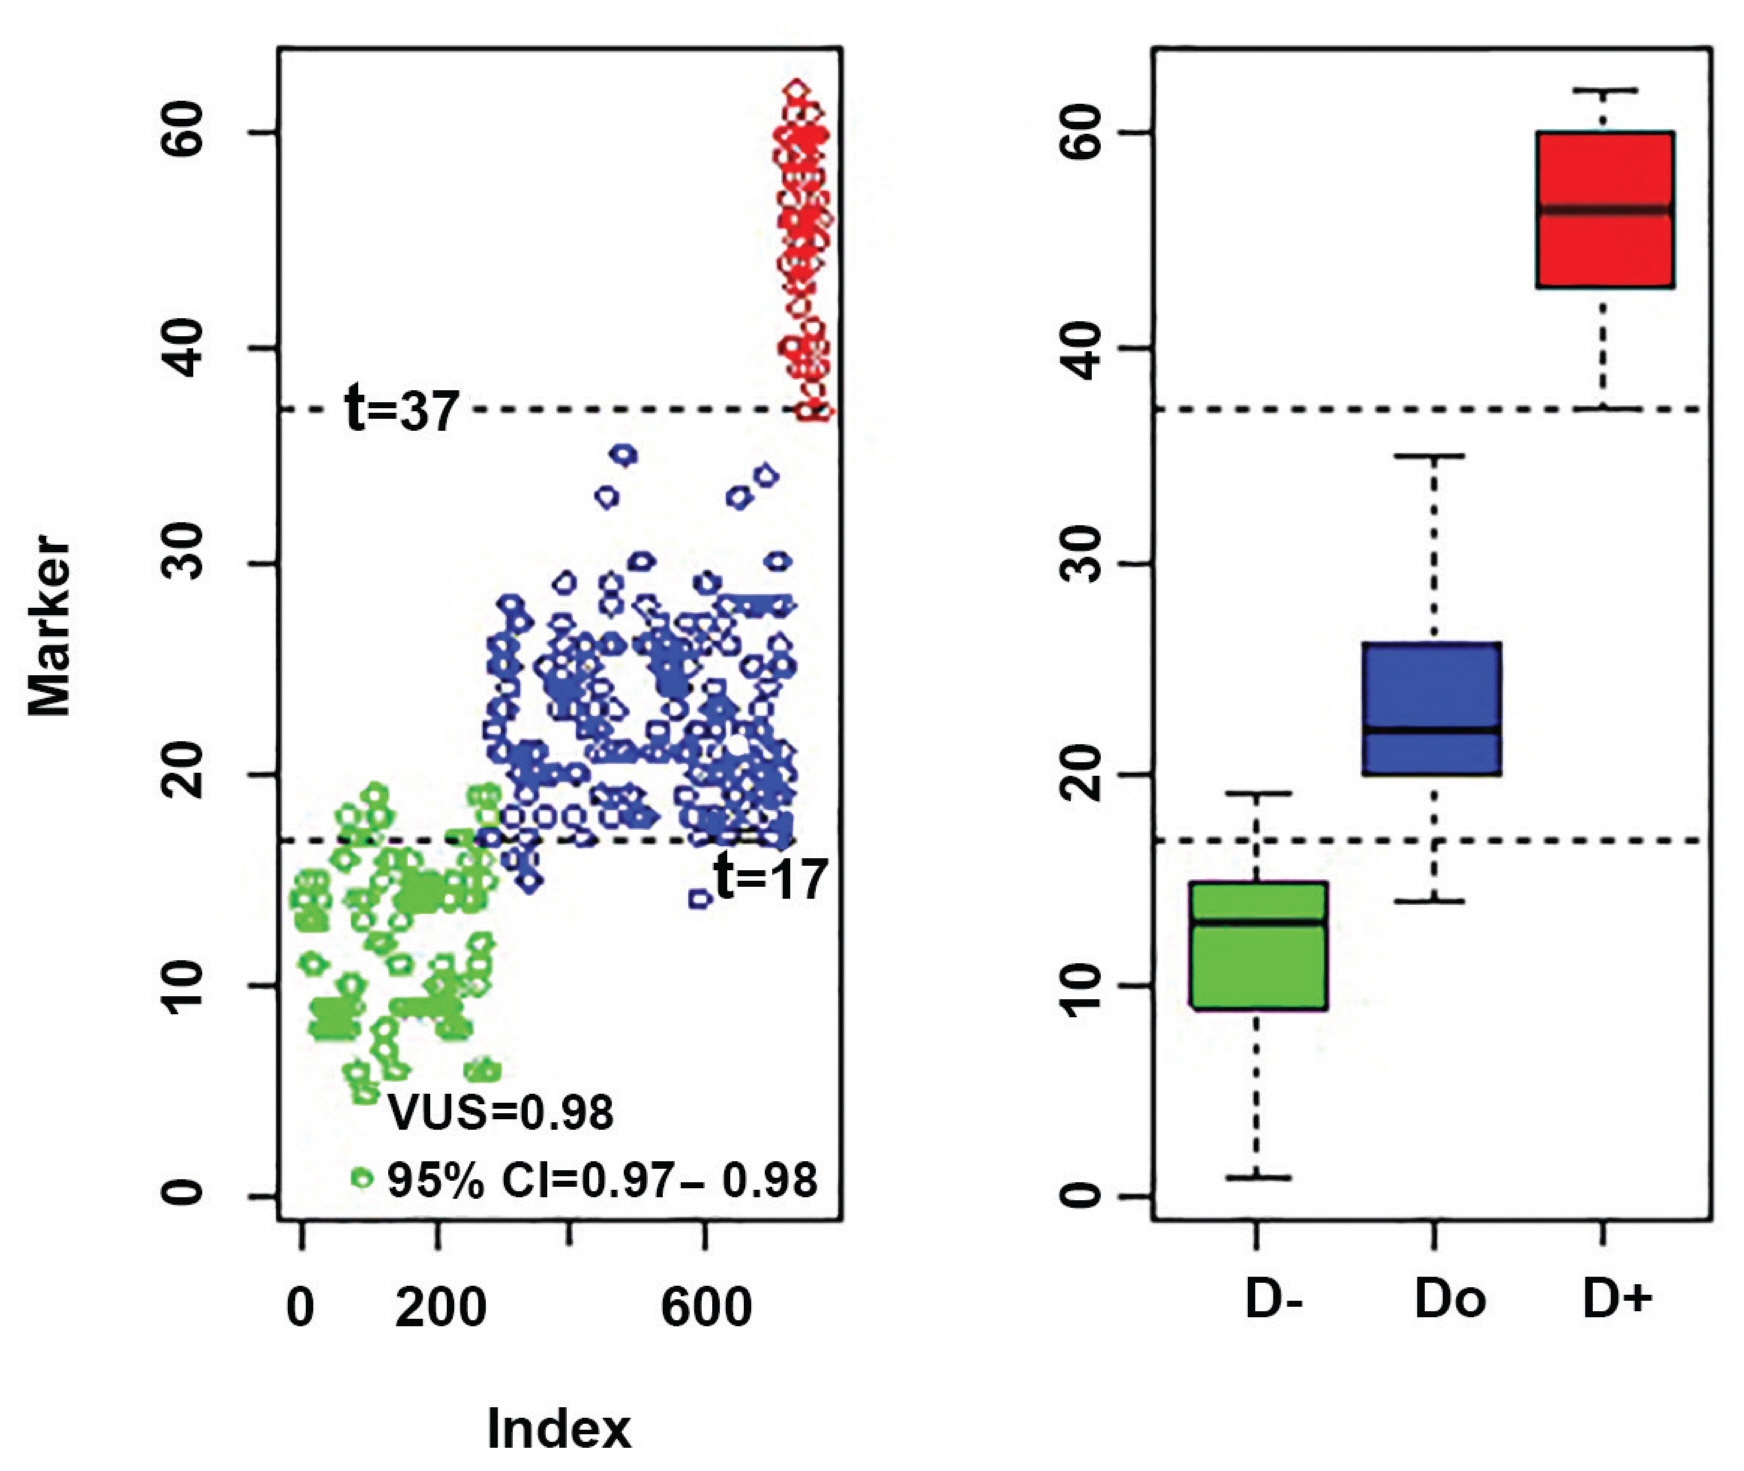
- To divide the knowledge scores into 3 subgroups, it required 2 cut-off points (thresholds). Those 2 cut-off points were determined by the extended Youden’s index and volume under the receiver operating characteristic surface simultaneous. Those cut-off points were 17 and 37. The Youden’s index measure based on the 2 thresholds was 0.92 (95% CI: 0.90–0.93) and correct classification proportions for low-, moderate- and high- awareness groups were 92%, 91%, and 99%, respectively (Figure 1). Therefore, based on the results score ≤ 16, 17–36 and ≥ 37 indicating low-, moderate-, and high- awareness, respectively.
- 3. Association between awareness scores and demographic characteristics
- Characteristics of participants are shown in Table 1. Mean (SD) age of the participant was 24.92 (2.89) years. The people that belonged to the higher awareness category were more likely to be (a) female, (b) single, (c) have a family history of diabetes, (d) have higher education, and (e) lower age (Table 2). Of all participants (n = 769), 225 (29.26%), 482 (62.68%) and 62 (8.06%) had low-, moderate- and high- awareness level of T2DM and its early and late complications, respectively.
- In this study, approximately a quarter of the participants (24.32%) knew about Type 1 diabetes, whilst less than one-third (29.52%) knew about T2DM (Table 3). The results show that approximately half of the participants (55.79%) knew that T2DM was preventable (Table 3) and the rest believed that T2DM was not preventable. The participants knew about failure of blood pressure (48.5%) and blurred vision (39.79%), more than other early complications of T2DM (Table 3). In addition, the participants were more aware of heart failure (52.02%) and stroke (44.21%), among the late complications of T2DM (Table 3).
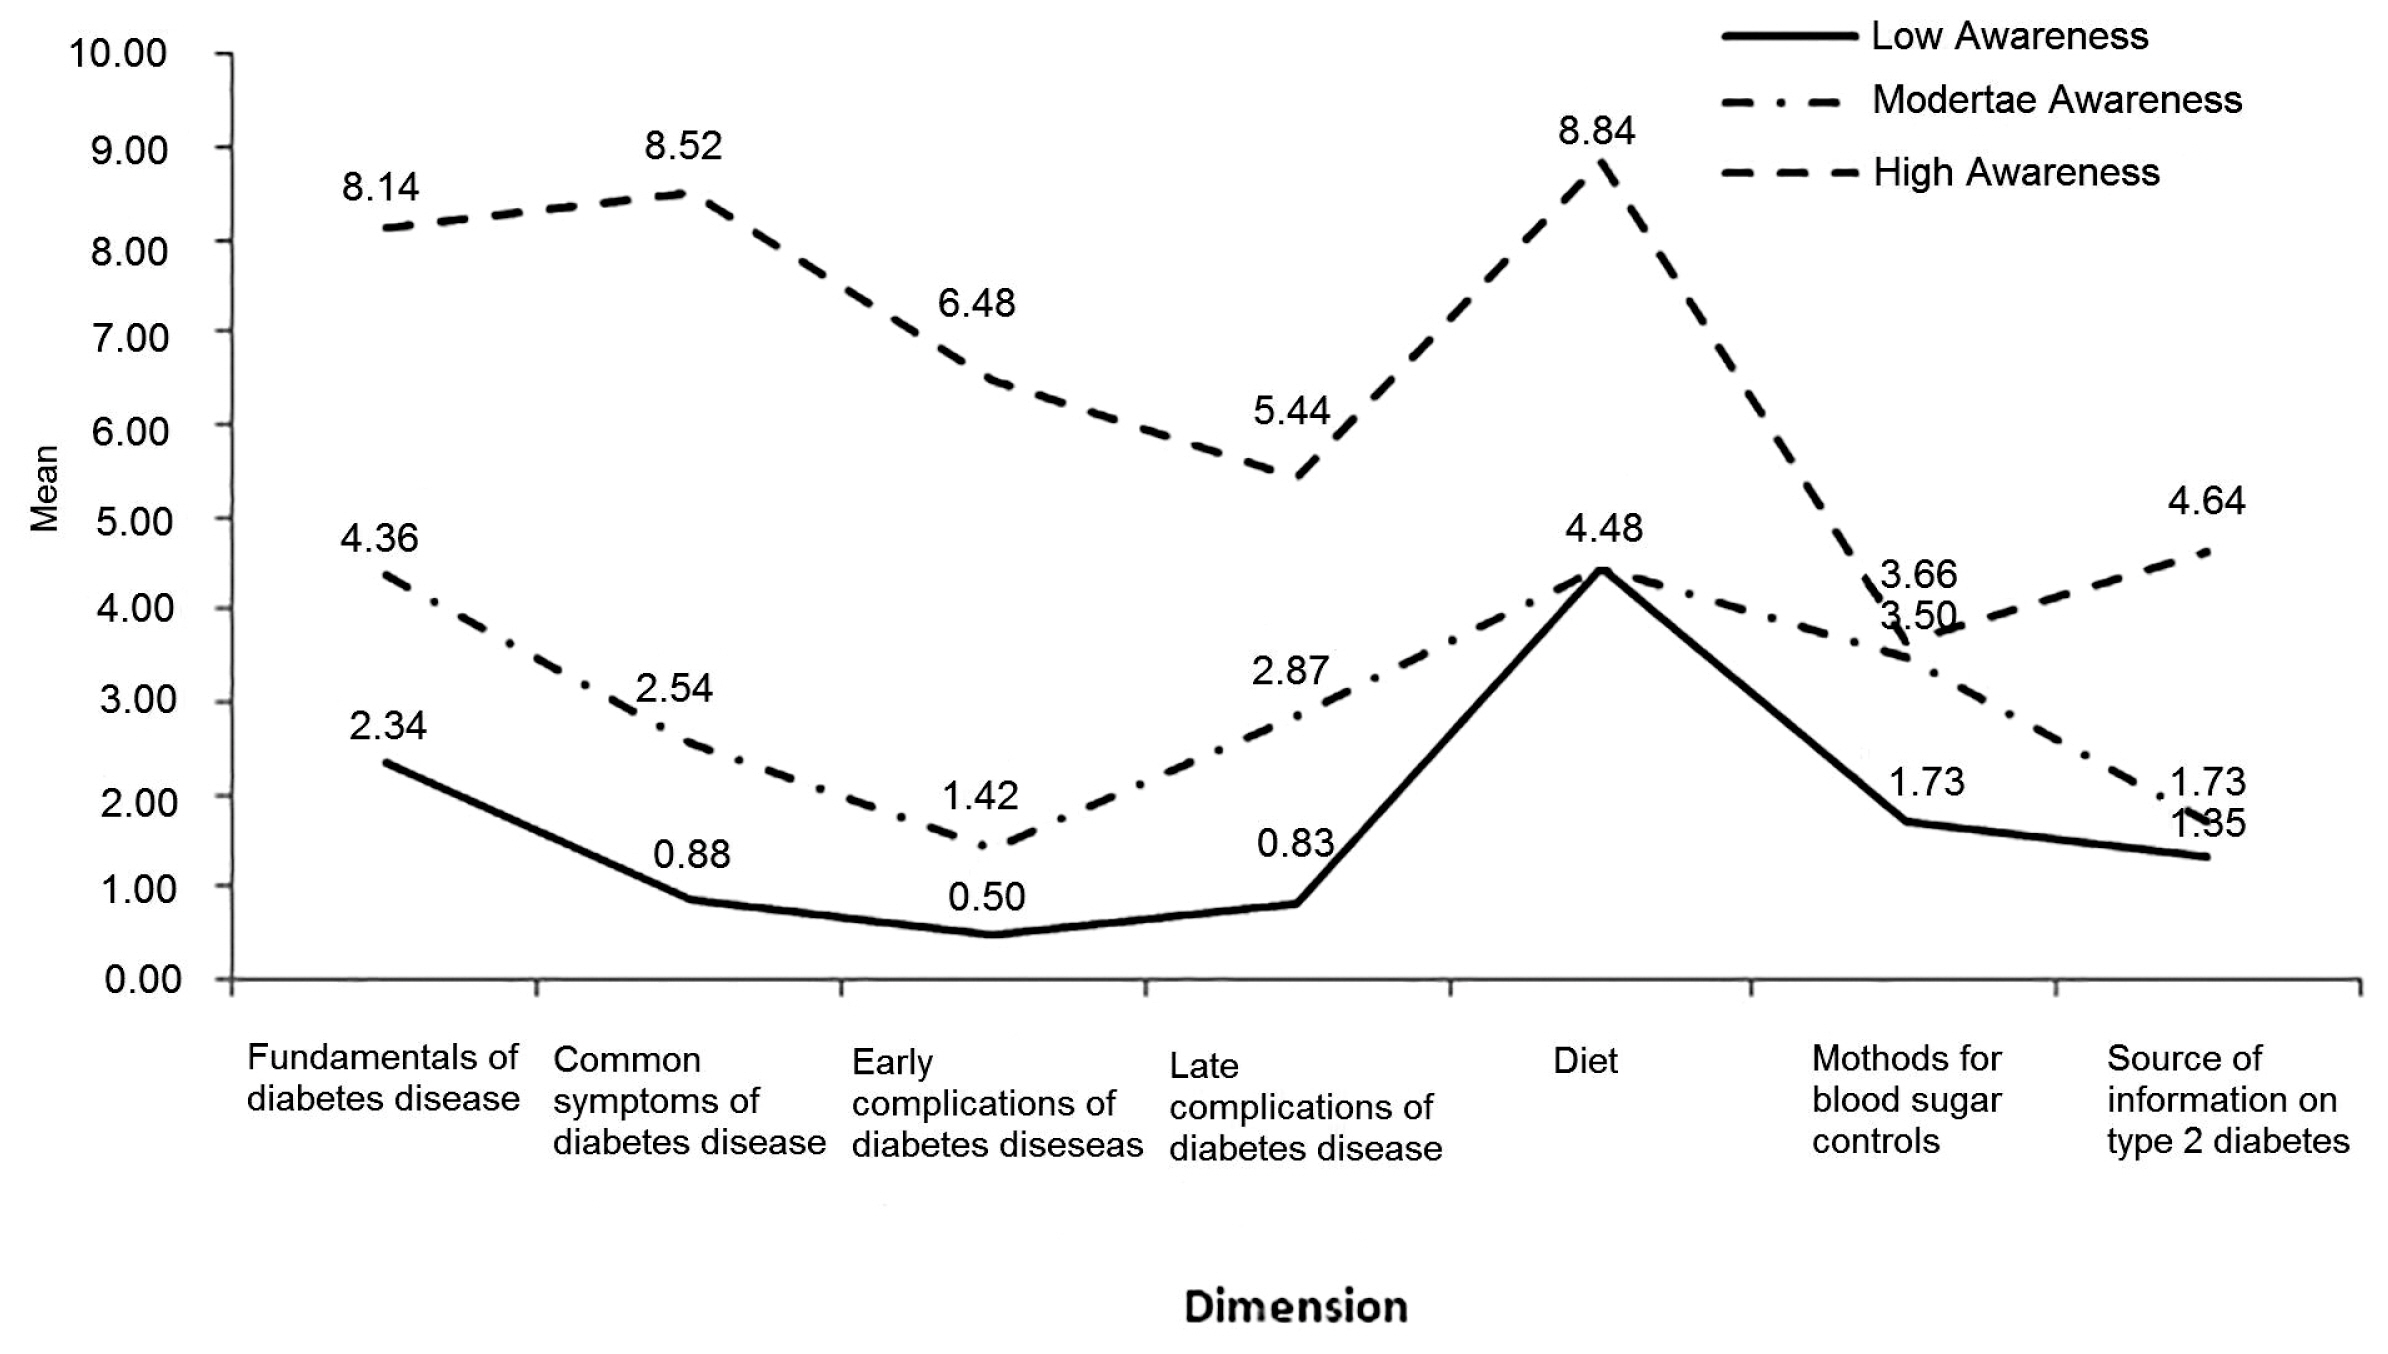
- Awareness score of blood sugar control methods was low, even amongst the people who were in the third group (i.e., individuals with a high awareness level), whilst nutrition knowledge was more than the other dimensions (Figure 2). Knowledge of people in the low- and moderate- groups, on early or late complications of T2DM, was less than the other dimensions (Figure 2).
- Figure 3 showed that friends (56.31%), and the internet and social networks (20.55%), were the most important source of information about T2DM amongst the public, whilst medical staff (e.g., physician) had the lowest frequency (3.64%).
Results
- Early diagnosis of diabetes symptoms can prevent T2DM and reduce the risk of developing complications of the disease (e.g., vascular problems, kidney, etc.). In addition, lifestyle changes, through increased physical activity and weight loss, will play a more effective role in reducing the risk of developing T2DM. In most cases, early diagnosis of diabetes can restore normality to high blood sugar levels in the body. A prerequisite for preventing diabetes in any society is knowing the level of awareness and sources of information about diabetes.
- In this study, a questionnaire was used that did not have a cut-off point. For this reason, 3 basic tasks were identified. Firstly, the number of awareness classes was set based on data by a quantitative method (i.e., latent profile analysis) to classify participants from a heterogeneous population into homogeneous subgroups based on an individual’s measures on continuous variables. Secondly, the cut-off point using Yoden’s index was obtained; and thirdly, the individuals were categorized based on the cut-off points.
- Three different classes were found to be more suitable than 1- or 2- classes to classify individuals into homogeneous subgroups. To adjust for gender, age, married status, and family history of diabetes effect, LPA was used. Youden’s index classified individuals into 3 classes based on awareness scores (i.e., low, medium, and high awareness). Previous studies did not determine the cut-off points for their questionnaires [8, 19–22].
- In accordance with 3 cut-offs (i.e., ≤ 16, 17–36 and ≥ 37), only 8.06% of participants had high awareness, while the rest had low (i.e., 62.68%) or moderate (i.e., 29.26%) awareness. Therefore, awareness regarding T2DM among the general population is inadequate in the west of Iran. Such results were shown in East Asia [20, 23], Africa [24, 25], and some Middle East regions [19]. Overall, the results of this study and studies conducted in China [23], Tanzania, India and Bushehr [19] show that people’s level of diabetic awareness and its complications is low, therefore, ongoing education programs should be implemented to raise people’s awareness about diabetes. In addition, diabetes screening should be performed routinely.
- This study showed that the average score of awareness of diet related to T2DM is higher than other dimensions. Despite the awareness of people about healthy diets, the prevalence of T2DM in Iran is increasing. Perhaps such a paradox is the lack of awareness of people’s attitude to diabetes or low perceived sensitivity of people. It is recommended that perceived sensitivity and barriers be taken into consideration in educational programs.
- The results from this study were similar to Xu’s study [23] which showed that females have more diabetic awareness than males, but in the southern region of Iran [19] and India [26], it was reported that men’s awareness was higher than women. Therefore, because of the contradiction between the results of the studies, it is not possible to be certain that which gender has more diabetic awareness. It seems the relationship between gender and awareness depends on the climate and the research community.
- In the present study, the level of diabetes awareness among older people was lower than that of younger people. The relationship between age and knowledge of people has already been reported [27]. Therefore, it is recommended that the level of public awareness must be increased, especially in the elderly. For this reason, policymakers should implement training courses for middle-aged people.
- The results showed that having a diabetic person in a family could increase awareness, while people who do not have diabetes in their family have a low level of knowledge of diabetes. Therefore, it is important to educate families that have not had first hand experience of diabetes.
- We showed that more than half of the participants (56.31%) received information about T2DM disease from friends. This may be considered a high proportion. Friends may not be a reliable scientific source of information on diabetes, thus it is advisable to inform the public through official sources (e.g., television programs, newspapers and medical staff). The important sources of information on diabetes was different in the present study, i.e., mainly friends, compared with Xu’s study, i.e., books and newspaper [23]. In this study, 4.03% and 3.68% participants received information about T2DM from books and magazines, and medical staff (e.g., physicians), respectively, which is a small amount. Of course, this difference is due to the age structure in the 2 studies. In other words, the participants in Xu’s study were young (i.e., students), while in our study there was a wider range of age groups.
- The results of this study were similar to previous studies [23, 25], demonstrating that people have little knowledge about diabetes and its complications. Therefore, in order to reduce the incidence of T2DM, young people who have an incentive to change their lifestyle have to be considered.
- Our study showed that the general population had a low awareness of the early and late complications of T2DM as well as its early symptoms. Perhaps this has led to less self-awareness and knowledge to live a healthy lifestyle. Therefore, it is suggested that future training programs focus more on complications of T2DM disease and its early symptoms.
- In this study, although 62.62% and 58.78% of participants explained that periodic visit to a physician and regular sport and physical activity can control T2DM disease, respectively, these proportions are still low, with an increase in T2DM prevalence. Therefore, the benefits of exercise needs to be provided in education programs for these communities.
- The results in this study showed that people’s knowledge of the symptoms of T2DM is very low and this may lead to the latent development of diabetes within the community if there is a lack of general awareness of the disease.
Discussion
- The results of this study showed that people’s understanding about T2DM disease is low, so health policymakers should raise diabetic awareness in the public using training programs. There should be a focus on education using accurate scientific and medical information via medical staff, books and newspapers, and TV and radio programs. Older people are more at risk for diabetes and because their level of awareness is low, the health policymakers must increase understanding, particularly in young people.
Conclusion
-
Acknowledgements
- We thank the participants. The study was funded by the vice-chancellor for research and technology of Hamadan University of Medical Sciences (Grant no. 9406173162)
Acknowledgments
-
Conflicts of Interest
The authors have declared that they have no competing interests.
Article information
- 1. Rawal LB, Tapp RJ, Williams ED, et al. Prevention of type 2 diabetes and its complications in developing countries: a review. Int J Behav Med 2012;19(2). 121−33. PMID: 10.1007/s12529-011-9162-9. PMID: 3358560.ArticlePubMed
- 2. World Health Organization. Global report on diabetes. France: 2016.
- 3. Zannad F, Cannon CP, Cushman WC, et al. Heart failure and mortality outcomes in patients with type 2 diabetes taking alogliptin versus placebo in EXAMINE: a multicentre, randomised, double-blind trial. Lancet 2015;385(9982). 2067−76. PMID: 10.1016/S0140-6736(14)62225-X. PMID: 25765696.ArticlePubMed
- 4. Peters SAE, Huxley RR, Woodward M. Diabetes as a risk factor for stroke in women compared with men: a systematic review and meta-analysis of 64 cohorts, including 775 385 individuals and 12 539 strokes. Lancet 2014;383(9933). 1973−80. PMID: 10.1016/S0140-6736(14)60040-4. PMID: 24613026.ArticlePubMed
- 5. Looker HC, Nyangoma SO, Cromie DT, et al. Rates of referable eye disease in the Scottish National Diabetic Retinopathy Screening Programme. Br J Ophthalmol 2014;98(6). 790−5. PMID: 10.1136/bjophthalmol-2013-303948. PMID: 24599419. PMID: 4033179.ArticlePubMed
- 6. Tuttle KR, Bakris GL, Bilous RW, et al. Diabetic Kidney Disease: A Report From an ADA Consensus Conference. Am J Kidney Dis 2014;64(4). 510−33. PMID: 10.1053/j.ajkd.2014.08.001. PMID: 25257325.ArticlePubMed
- 7. Mayeda ER, Haan MN, Kanaya A, Yaffe K, Neuhaus J. Type 2 diabetes and 10-year risk of dementia and cognitive impairment among older Mexican Americans. Diabetes Care 2013;36(6). 2600−6. PMID: 10.2337/dc12-2158. PMID: 23514732. PMID: 3747945.ArticlePubMedPMC
- 8. Soltanian AR, Borzouei S, Afkhami-Ardekan M. Design, developing and validation a questionnaire to assess general population awareness about type II diabetes disease and its complications. Diabetes Metab Syndr 2017;11(Suppl 1). S39−43. PMID: 10.1016/j.dsx.2016.09.002.ArticlePubMed
- 9. Berlin KS, Williams NA, Parra GR. An introduction to latent variable mixture modeling (part 1): Overview and cross-sectional latent class and latent profile analyses. J Ped Psychol 2013;39(2). 174−87. PMID: 10.1093/jpepsy/jst084.ArticlePDF
- 10. Tein J-Y, Coxe S, Cham H. Statistical power to detect the correct number of classes in latent profile analysis. Struct Equ Modeling 2013;20(4). 640−57. PMID: 10.1080/10705511.2013.824781.ArticlePubMedPMC
- 11. Akaike H. Factor analysis and AIC. Psychometrika 1987;52(3). 317−32. PMID: 10.1007/BF02294359.Article
- 12. Schwarz G. Estimating the dimension of a model. Ann Stat 1978;6(2). 461−4. PMID: 10.1214/aos/1176344136.Article
- 13. Sclove SL. Application of model-selection criteria to some problems in multivariate analysis. Psychometrika 1987;52(3). 333−43. PMID: 10.1007/BF02294360.ArticlePDF
- 14. Lo Y, Mendell NR, Rubin DB. Testing the number of components in a normal mixture. Biometrika 2001;88(3). 767−78. PMID: 10.1093/biomet/88.3.767.ArticlePDF
- 15. Nakas CT, Alonzo TA, Yiannoutsos CT. Accuracy and cut-off point selection in three-class classification problems using a generalization of the Youden index. Stat Med 2010;29(28). 2946−55. PMID: 10.1002/sim.4044. PMID: 20809485. PMID: 2991472.ArticlePubMedPMC
- 16. In: In : Ferri C, Hernández-Orallo J, Salido MA. Volume under the ROC surface for multi-class problems. In: European Conference on Machine Learning; Springer; 2003.Article
- 17. Muthén LK, Muthén BO. Mplus User’s Gide. Seventh Edition. Los Angeles (CA): Muthén & Muthén; 1998–2012.
- 18. Luo J, Xiong C. DiagTest3Grp: an R package for analyzing diagnostic tests with three ordinal groups. J Stats Software 2012;51(3). 1. Article
- 19. Soltanian AR, Bahreini F, Afkhami-Ardekani M. People awareness about diabetes disease and its complications among aged 18 years and older in Bushehr port inhabitants (Iran). Diabetes Metab Syndr 2007;1(4). 245−9. PMID: 10.1016/j.dsx.2007.09.003.Article
- 20. Lau SL, Debarma R, Thomas N, et al. Healthcare Planning in North-East India: A Survey on Diabetes Awareness, Risk Factors and Health Attitudes in a Rural Community. J Assoc Physicians India 2009;57:305−9. PMID: 19702036.PubMed
- 21. Murugesan N, Snehalatha C, Shobhana R, Roglic G, Ramachandran A. Awareness about diabetes and its complications in the general and diabetic population in a city in southern India. Diabetes Res Clin Pract 2007;77(3). 433−7. PMID: 10.1016/j.diabres.2007.01.004. PMID: 17291622.ArticlePubMed
- 22. Sabri AA, Qayyum MA, Saigol NU, Zafar K, Aslam F. Comparing knowledge of diabetes mellitus among rural and urban diabetics. Mcgill J Med 2007;10(2). 87−9.ArticlePubMedPMCPDF
- 23. Xu Y, Zhang D, Liu K, Guo Y, Yang Y. Self-reported knowledge on diabetes and its related factors among Chinese college students: a cross-sectional study. BMJ Open 2016;6:e011963PMID: 10.1136/bmjopen-2016-011963. PMID: 27609848. PMID: 5020855.ArticlePubMedPMC
- 24. Asmamaw A, Asres G, Negese D, Fekadu A, Assefa G. Knowledge and Attitude About Diabetes Mellitus and Its Associated Factors Among People in DebreTabor Town, Northwest Ethiopia: Cross Sectional Study. Sci J Public Health 2015;3(2). 199−209. PMID: 10.11648/j.sjph.20150302.17.Article
- 25. Cullen K, Buzek B. Knowledge about type 2 diabetes risk and prevention of African-American and Hispanic adults and adolescents with family history of type 2 diabetes. Diabetes Educ 2009;35(5). 836−42. PMID: 10.1177/0145721709341851. PMID: 19696204.ArticlePubMed
- 26. Deepa M, Bhansali A, Anjana RM, et al. Knowledge and awareness of diabetes in urban and rural India: The Indian Council of Medical Research India Diabetes Study (Phase I): Indian Council of Medical Research India Diabetes 4. Indian J Endocrinol Metab 2014;18(3). 379−85. PMID: 10.4103/2230-8210.131191. PMID: 24944935. PMID: 4056139.ArticlePubMedPMC
- 27. Chinnappan S, Sivanandy P, Sagaran R, Molugulu N. Assessment of Knowledge of Diabetes Mellitus in the Urban Areas of Klang District, Malaysia. Pharmacy 2017;5(1). 1−8. PMID: 10.3390/pharmacy5010011.Article
References

| Variables | n (%) | Awareness scores * | OR§ | p§ | OR¶ | p¶ | ||
|---|---|---|---|---|---|---|---|---|
|
|
||||||||
| Low (n = 225) | Moderate (n = 482) | High (n = 62) | ||||||
| Gender | ||||||||
| Male | 443 (57.6) | 93 (41.3) | 318 (65.9) | 32 (51.6) | 0.33 | < 0.001 | 0.381 | < 0.001 |
| Female | 326 (42.4) | 132 (58.7) | 164 (34.1) | 30 (48.4) | 1 | 1 | ||
|
|
||||||||
| Age (y) | ||||||||
| ≤ 25 | 121 (15.7) | 15 (6.7) | 68 (14.1) | 38 (61.3) | 0.36 | < 0.001 | 0.91 | 0.012 |
| 26–40 | 326 (42.39) | 79 (35.1) | 227 (47.1) | 20 (32.2) | 0.51 | < 0.001 | 0.82 | < 0.001 |
| 41–54 | 257 (33.42) | 96 (42.7) | 157 (32.57) | 4 (6.5) | 0.34 | < 0.001 | 0.85 | < 0.001 |
| ≥55 | 65 (8.45) | 35 (15.6) | 30 (6.2) | 0 (0.0) | 1 | 1 | ||
|
|
||||||||
| Marriage status | ||||||||
| Single | 267 (34.7) | 48 (21.3) | 176 (36.5) | 43 (69.4) | 2.16 | < 0.001 | 1.18 | 0.60 |
| Married | 502 (65.3) | 177 (78.7) | 306 (63.5) | 19 (30.6) | 1 | 1 | ||
|
|
||||||||
| Education | ||||||||
| Illiterate | 110 (14.3) | 41 (18.2) | 69 (14.3) | 0 (0.0) | 1 | 1 | ||
| Primary | 114 (14.8) | 83 (36.9) | 31 (6.4) | 0 (0.0) | 1.24 | < 0.001 | 1.31 | 0.017 |
| Secondary | 101 (13.1) | 40 (17.8) | 61 (12.7) | 0 (0.0) | 1.21 | < 0.001 | 1.28 | 0.081 |
| High school | 88 (11.4) | 17 (7.6) | 65 (13.5) | 6 (9.7) | 2.69 | < 0.001 | 2.07 | 0.030 |
| Bachelor | 180 (23.4) | 29 (12.9) | 143 (29.7) | 8 (12.9) | 2.29 | < 0.001 | 1.88 | 0.023 |
| ≥ M.Sc. | 176 (16.4) | 15 (6.7) | 113 (23.4) | 48 (77.4) | 2.16 | < 0.001 | 2.12 | 0.042 |
|
|
||||||||
| Family history of diabetes | ||||||||
| First degree † | 58 (7.5) | 18 (8.0) | 55 (11.4) | 19 (30.6) | 3.13 | < 0.001 | 2.14 | < 0.001 |
| Second degree ‡ | 44 (5.7) | 7 (3.1) | 52 (10.8) | 7 (11.3) | 1.97 | < 0.001 | 2.01 | < 0.001 |
| No | 667 (50.0) | 200 (88.9) | 375 (77.8) | 36 (58.1) | 1 | 1 | ||
T2DM = type 2 diabetes mellitus.
* Awareness scores were divided into 3 categories based on latent profile analysis and Youden’s index.
† First degree denotes father/mother/sister/brother;
‡ Second degree denotes aunt/uncle/cousin.
§ OR and P denotes Odds ratio and statistical significance, respectively, and were estimated by multiple ordinal logistic regression.
¶ OR and P were estimated by multiple logistic regression (low v.s. moderate + high).
Figure & Data
References
Citations
- Healthcare Practitioners' Perspective of Prevailing Awareness on Diabetes Complications: A Questionnaire-Based Pan-India Study
Nikhil Tandon, Piya Ballani Thakkar, Jubbin Jacob, Pramila Kalra, Nanditha Arun, Alok Kanungo, Ashish Birla, Ashish Prasad, Mayuri Talathi
Cureus.2023;[Epub] CrossRef - What Is the Optimal Cut-Off Point of the 10-Item Center for Epidemiologic Studies Depression Scale for Screening Depression Among Chinese Individuals Aged 45 and Over? An Exploration Using Latent Profile Analysis
Hanlin Fu, Lulu Si, Ruixia Guo
Frontiers in Psychiatry.2022;[Epub] CrossRef - Classification of probable online social networking addiction: A latent profile analysis from a large-scale survey among Chinese adolescents
Ji-Bin Li, Anise M.S. Wu, Li-Fen Feng, Yang Deng, Jing-Hua Li, Yu-Xia Chen, Jin-Chen Mai, Phoenix K.H. Mo, Joseph T.F. Lau
Journal of Behavioral Addictions.2020; 9(3): 698. CrossRef
 PubReader
 Cite
Cite