
Articles
- Page Path
- HOME > Osong Public Health Res Perspect > Volume 2(3); 2011 > Article
-
Articles
Sensitivity Analysis of the Parameters of Korea’s Pandemic Influenza Preparedness Plan - Chaeshin Chua, Junehawk Leeb, Dong Hoon Choib, Seung-Ki Youna, Jong-Koo Leec
-
Osong Public Health and Research Perspectives 2011;2(3):210-215.
DOI: https://doi.org/10.1016/j.phrp.2011.11.048
Published online: December 31, 2011
aDivision of Epidemic Intelligence Service, Korea Centers for Disease Control and Prevention, Osong, Korea.
bKorea Institute of Science and Technology Information, Daejeon, Korea.
cKorea Centers for Disease Control and Prevention, Osong, Korea.
- Corresponding author. E-mail: docmohw@korea.kr
• Received: July 20, 2011 • Revised: September 22, 2011 • Accepted: October 15, 2011
Copyright ©2011, Korea Centers for Disease Control and Prevention
This is an Open Access article distributed under the terms of the Creative Commons Attribution Non-Commercial License () which permits unrestricted non-commercial use, distribution, and reproduction in any medium, provided the original work is properly cited.
Abstract
-
Objectives
- Our aim was to evaluate Korea’s Pandemic Influenza Preparedness Plan.
-
Methods
- We conducted a sensitivity analysis on the expected number of outpatients and hospital bed occupancy, with 1,000,000 parameter combinations, in a situation of pandemic influenza, using the mathematical simulation program InfluSim.
-
Results
- Given the available resources in Korea, antiviral treatment and social distancing must be combined to reduce the number of outpatients and hospitalizations sufficiently; any single intervention is not enough. The antiviral stockpile of 4–6% is sufficient for the expected eligible number of cases to be treated. However, the eligible number assumed (30% for severe cases and 26% for extremely severe cases) is very low compared to the corresponding number in European countries, where up to 90% of the population are assumed to be eligible for antiviral treatment.
-
Conclusions
- A combination of antiviral treatment and social distancing can mitigate a pandemic, but will only bring it under control for the most optimistic parameter combinations.
- It is necessary to evaluate a nation’s pandemic influenza preparedness plan for whether it effectively reflects the capacity of the public health system on a national basis. Several papers have reported that an influenza pandemic can stretch the capacity of a nation’s health system [1-3]. Some studies use static models without parameter sensitivity analysis but consider a few fixed values for attack rates, hospitalization rates, and mortality rates [4-10], and a few consider the therapeutic use of neuraminidase inhibitors [5,8,10]. As pharmaceutical and nonpharmaceutical interventions can change the course of a pandemic, any sensitivity analysis must include whether these can lower the burden on the national public health system to a manageable level.
- However, this evaluation is difficult because we do not know the contagiousness of any upcoming unknown influenza strain. Here, we defined feasible ranges for the parameters of a future influenza pandemic, and then randomly sampled from these ranges. For each combination of sampled parameter values, we simulated the course of the pandemic wave using InfluSim software (http://www.influsim.info) [11,12]. We thereby generated a whole range of plausible influenza pandemics for which we could evaluate how many persons would seek medical help or need hospitalization. Simulations were conducted both with and without interventions, and the effects of the intervention were then estimated for each set of parameter values.
1. Introduction
- We conducted the sensitivity analysis using InfluSim version 2.1, a deterministic compartment model that extends the ‘susceptible–exposed-infectious–removed’ (SEIR) model by using clinical and demographic parameters relevant for pandemic preparedness planning [11,12]. The simulation produces daily time courses and cumulative numbers of influenza cases, outpatients, and
- Parameter values
- hospitalizations using demographic parameters from Korea (see the Appendix).
- The default setting of InfluSim parameters is that about one-third of infected individuals will become severely ill and seek medical care. Patients seeking medical care are “outpatients.” The distribution of outpatients delayed visits is exponential, which means that patients visit hospitals/clinics some time after onset of symptoms, on average after 24 hours. If patients seek medical care within 48 hours after the onset of their symptoms, they are given antiviral treatment, which reduces the duration and degree of infectivity and the chance of hospitalization [13].
- As many parameters of future viruses and intervention effects are uncertain, we performed sensitivity analyses by randomly choosing values for the key parameters listed in Table 1 for given ranges. All parameter samples were taken randomly assuming normal distributions with a mean value in the middle of the interval given in Table 1 and a 99% confidence interval (see Figure 1B below). A total of 1,000,000 different combinations of parameter values were sampled and a set of four simulations performed for the following scenarios: no intervention, social distancing (contact reduction) only, antiviral treatment only, and a combination of both. Social distancing can cause reduce the number of contacts in the general population and for cases with different levels of disease severity
- (Table 1). Antiviral treatment is given on average 24 hours (but not later than 48 hours) after the onset of symptoms; it reduces the infectivity of patients and the course of their disease, thus preventing a proportion of hospitalizations (Table 1).
- From each simulation, the peak number of outpatients, the cumulative number of outpatients, the peak hospital bed occupancy, and the cumulative number of hospitalizations were extracted. To evaluate the effects of the different interventions, each simulation outcome was divided by the result of the no-intervention scenario. Finally, we related our results to the available number of hospital beds [14] and the number of physicians in practice (general medicine, internal medicine, and pediatrics) [15].
2. Materials and Methods
Table 1.
Figure 1.
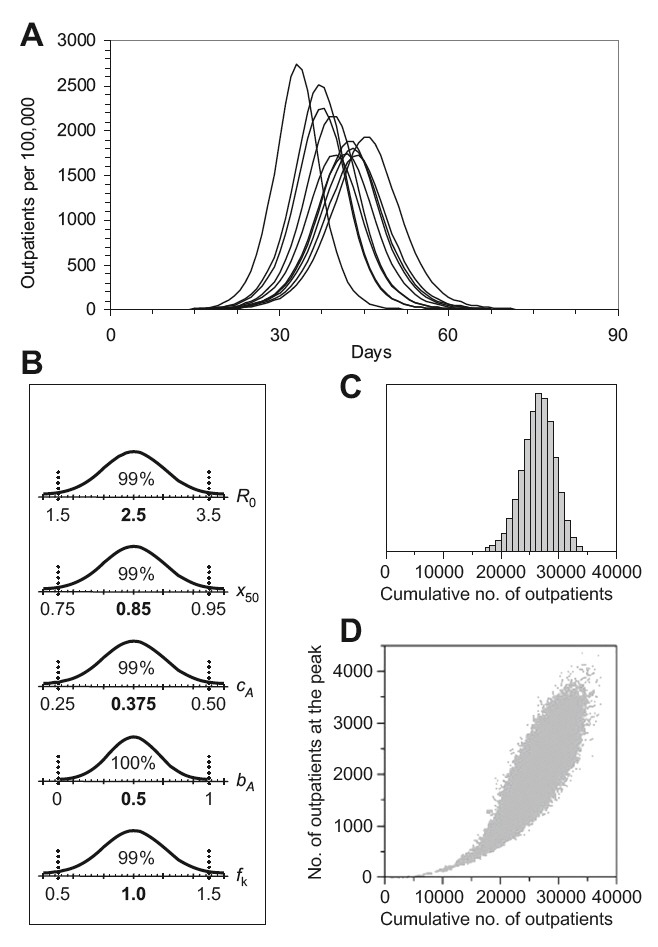
The number of outpatients in a no-intervention scenario (population size 100,000 individuals). (A) Epidemic curves for nine out of 100,000 realizations, representing the 10%, 20%, ..., 90% percentiles of all realizations. (B) Parameter values from normal distributions (means given in bold, with 99% of the values lying within the ranges specified by dotted lines). R0 = basic reproduction number; x50 = cumulative infectivity during the first half of the symptomatic period; cA = fraction of infections remaining asymptomatic; bA = relative infectivity of asymptomatic compared to symptomatic cases; fk = factor by which the InfluSim default percentage of hospitalizations was varied. (C) Distribution of the cumulative number of outpatients. (D) Correlation between the cumulative number of outpatients and the number of outpatients on the peak day.
Figure 2.

Effects of social distancing, antiviral treatment, and a combination of both interventions compared to the nointervention scenario. (A) Total number of outpatient visits; (B) outpatient visits prevented as a percentage of the nointervention scenario; (C) total number of hospitalizations; (D) hospitalizations prevented as a percentage of the no-intervention scenario.
Figure 3.
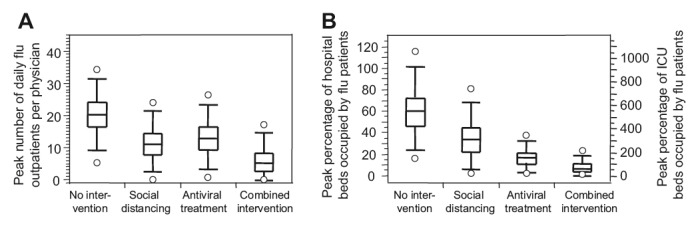
Simulation results of different intervention scenarios (population size 100,000 individuals). (A) Peak number of outpatient visits per physician in practice; (B) left axis: peak percentage of available hospital beds occupied by influenza patients; right axis: peak percentage of available intensive care unit (ICU) beds needed for influenza patients.
Figure 4.
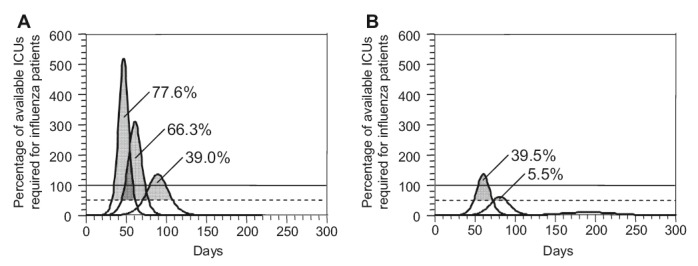
Demand for intensive care. The curves show the percentage of the currently available intensive care unit (ICU) beds in Korea, assuming that 15% of hospitalized patients need intensive care. The horizontal lines indicate 50% and 100% of the available ICU capacity. The gray areas under the curves indicate what percentage of cases needing ICU care cannot receive proper treatment if at most 50% of ICU beds can be made available for influenza patients. (A) Social distancing alone; (B) social distancing combined with antiviral treatment.
- This parameter sensitivity analysis has revealed some interesting properties of an influenza pandemic in Korea. As expected, the basic reproduction number and distribution of contagiousness over the infectious period have the largest effect on the course of the epidemic. Other parameters describing the contagiousness of cases in the late prodromal period and the contagiousness of asymptomatic and moderate cases compared to severe cases have only a moderate effect on the course of the epidemic. Interestingly, an increased contagiousness of moderately sick individuals reduces the peak and cumulative number of cases.
- The antiviral stockpile of 4–6% is sufficient for the expected eligible number of cases to be treated. However, the eligible number assumed (30% for severe cases and 26% for extremely severe cases) is very low compared to the equivalent figure in European countries, where up to 90% of the population are assumed to be eligible for antiviral treatment [16]. The two parameters describing the effect of antiviral treatment, i.e., the reduction in the duration of the contagious period and the reduction in the contagiousness of treated individuals,have only a minor effect on the simulation results.
- The general reduction of contacts has a large effect on the course of the epidemic, while the threshold for closing schools has only a minor effect. This can be explained by the small overall effect of school closure even though Korea has a larger fraction of school children than most European countries. However, the school closure threshold has been investigated for very small threshold values. The use of a deterministic simulator such as InfluSim may not be adequate to address the analysis of optimal school closure thresholds.
- Comparing the effect of social distancing interventions with antiviral treatment, social distancing interventions clearly have a larger effect. This can be explained by the small fraction of individuals eligible for treatment (26–30%). However, additional prophylaxis for healthcare workers and essential service workers will rapidly exploit the antiviral stockpile, so that treatment of cases will no longer be possible and the overall effect will be negative.
3. Results
- It is important to consider ranges of parameter values.Sampling random values from reasonable intervals translates input uncertainty into expected output variability. The wide regions of tolerance for the total number of outpatients and hospitalizations (Figure 1) show that pandemic preparedness plans should consider “best case” and “worst case” scenarios, not “average case” scenarios.
- The most important parameter that determines both the duration and the height of a pandemic is the basic reproduction number, R0. However, there is a wide range of proposed values for past pandemics and for seasonal influenza, ranging from 1.5 to 4 [17-21]. Many authors have adopted Longini’s containment strategies for R0, using a value of 1.1-2.4 [22]. Ferguson et al’s R0 for 1918 pandemic data should be regarded as an effective reproduction number that also reflects the effect of interventions, and they proposed R0 = 1.7 as “moderate” and R0 = 2.0 as “high” transmission scenarios [23]. We explored a wider range of pandemics (R0 = 1.5-3.5) and also considered hospital bed occupancy and intensive care unit (ICU) demand.
- The effects of antiviral treatment depend on the patients’ treatment time and on where they have already spent most of the contagious period before treatment. The success of social distancing measures depends on the compliance of the population. At the most pessimistic end of our simulations (high R0 and a strong concentration of contagiousness in the early phase of the infection, combined with low public health compliance and low treatment effects), the number of hospitalizations can be 1.9 times higher than the mean, whereas at the most optimistic end, a major outbreak may be prevented (cf. the 99% interval for the combined intervention in Figure 2C).
- Our study confirms the results of previous studies using static models [5,8] that have pointed out ICU capacity as a bottleneck in hospital settings, and have stated that appropriate contingency planning must consider a rapid expansion of ICU capacity. We show that, in pessimistic cases, a non-negligible percentage of hospitalized patients (ranging from 5.5% to 39.5%) would be at a higher risk of death if 50% of the currently existing ICU beds could be made available at the peak of the epidemic. We believe that, as ICU capacity is difficult to expand and costly to maintain, additional measures must be considered and extensive preparation will be needed. This includes occupational safety measures and the development of triage policies (Figures 3 and 4).
4. Discussion
-
Acknowledgements
- This work was supported by the fund from a project of KISTI Pandemic Influenza Parameter Sensitivity Study (contract no. 06.001333/304.0001-108).
- 1. Schoch-Spana M . “Hospital’s full-up”: the 1918 influenza pandemic. Public Health Rep 2011;(116(suppl. 2)). 32−3.ArticlePDF
- 2. Itzwerth RL . Pandemic influenza and critical infrastructure dependencies: possible impact on hospitals. Med J Aust 20 11 2006;(185(10 suppl)). S70−2. PMID: 17115957.ArticlePubMed
- 3. Wilson N Baker M Crampton P Mansoor O . The potential impact of the next influenza – pandemic on a national primary care medical workforce. Hum Resour Health 11 8 2005;3:7PMID: 16092972.ArticlePubMedPMC
- 4. Anderson TA Hart GK Kainer MA . ANZICS Database Management Committee. Pandemic influenza - implications for critical care resources in Australia and New Zealand. J Cri Care 9;2003;18(3). 173−80.Article
- 5. Menon DK Taylor BL Ridley SA . Modelling the impact of an influenza pandemic on critical care services in England. Anaesthesia 10;2005;60(10). 952−4. PMID: 16179037.ArticlePubMed
- 6. Schopflocher DP Russell ML Svenson LW et al.. Pandemic Influenza planning: using the U.S. centers for disease control Fluaid software for small area estimation in the Canadian context. Ann Epidemiol 1;2004;14(1). 73−6. PMID: 14664783.ArticlePubMed
- 7. Sobieraj JA Reyes J Dunemn KN et al.. Modeling hospital response to mild and severe influenza pandemic scenarios under normal and expanded capacities. Mil Med 5;2007;172(5). 486−90. PMID: 17521095.ArticlePubMed
- 8. Van Genugten ML Heijnen ML . The expected number of hospitalizations and beds needed due to pandemic influenza on a regional level in the Netherlands. Virus Res 7;2004;103(1-2). 17−23. PMID: 15163483.ArticlePubMed
- 9. Zhang X Meltzer MI . FluSurge – a tool to estimate demand for hospital services during the next pandemic influenza. Med Decis Making Nov-Dec;2006;26(6). 617−23. PMID: 17099200.ArticlePubMed
- 10. Nap RE Andriessen MPHM Meessen NE . Pandemic influenza and hospital resources. Emerg Infec Dis 11;2007;13(11). 1714−9. PMID: 18217556.Article
- 11. Eichner M Schwehm M Duerr HP Brockmann SO . The influenza pandemic preparedness planning tool InfluSim. BMC Infect Dis 13 3 2007;7:17PMID: 17355639.ArticlePubMedPMC
- 12. Duerr HP Brockmann SO Piechotowski I et al.. Influenza pandemic intervention planning using InfluSim: pharmaceutical and non-pharmaceutical interventions. BMC Infect Dis 13 7 2007;7:76PMID: 17629919.ArticlePubMedPMCPDF
- 13. Longini Jr IM Halloran ME Nizam A Yang Y . Containing pandemic influenza with antiviral agents. Am J Epidemiol 1 4 2004;159(7). 623−33. PMID: 15033640.ArticlePubMed
- 14. Korean Federal Statistical Office.2005 [accessed 14.01.10].Available from, http://www.bfs.admin.ch/bfs/portal/de/index/themen/14/03/01/key/01.Document.2153 3.xls.
- 15. Korean Medical Association.FMH-Aerztestatistik 2005 Bulletin. 2006;87:747−764.
- 16. Vidondo B et al.. Effects of interventions on the demand for hospital services in an influenza pandemic: a sensitivity analysis. Swiss Med Wkly 5 9 2009;139(35-36). 505−10. PMID: 19675954.ArticlePubMed
- 17. Meltzer MI Cox NJ Fukuda K . The economic impact of pandemic influenza in the United States: priorities for intervention. Emerg Infect Dis Sep-Oct;1999;5(5). 659−71. PMID: 10511522.ArticlePubMedPMC
- 18. Mills CE Robins JM Lipsitch M . Transmissibility of 1918 pandemic influenza. Nature 16 12 2004;432(7019). 904−6. PMID: 15602562.ArticlePubMedPMCPDF
- 19. Chowell G Ammon CE Hengartner NW . Estimation of the reproductive number of the Spanish flu epidemic in Geneva, Switzerland. Vaccine 10 11 2006;24(44-46). 6747−50. PMID: 16782243.ArticlePubMed
- 20. Chowell G Ammon CE Hengartner NW Hyman JM . Transmission dynamics of the great influenza pandemic of 1918 in Geneva, Switzerland: assessing the effects of hypothetical interventions. J Theor Biol 21 7 2006;241(2). 193−204. PMID: 16387331.ArticlePubMed
- 21. Chowell G Ammon CE Hengartner NW Hyman JM . Estimating the reproduction number from the initial phase of the Spanish flu pandemic waves in Geneva, Switzerland. Math Biosci Eng 7;2007;4(3). 457−70. PMID: 17658935.ArticlePubMed
- 22. Longini Jr IM Nizam A Xu S et al.. Containing pandemic influenza at the source. Science 12 8 2005;309(5737). 1083−7. PMID: 16079251.ArticlePubMed
- 23. Ferguson NM Cummings DAT Fraser C et al.. Strategies for mitigating an influenza pandemic. Nature 27 7 2006;442(7101). 448−52. PMID: 16642006.ArticlePubMedPMCPDF
Appendix
Table A1.Age distribution of the Korean population (per 100,000) contact matrix and risk of hospitalization and death from influenza by age class and risk group
Figure & Data
References
Citations
Citations to this article as recorded by 
- Working memory capacity predicts individual differences in social-distancing compliance during the COVID-19 pandemic in the United States
Weizhen Xie, Stephen Campbell, Weiwei Zhang
Proceedings of the National Academy of Sciences.2020; 117(30): 17667. CrossRef - Assessment of Intensive Vaccination and Antiviral Treatment in 2009 Influenza Pandemic in Korea
Chaeshin Chu, Sunmi Lee
Osong Public Health and Research Perspectives.2015; 6(1): 47. CrossRef - Doing Mathematics with Aftermath of Pandemic Influenza 2009
Hae-Wol Cho, Chaeshin Chu
Osong Public Health and Research Perspectives.2015; 6(1): 1. CrossRef - Roll the Dice
Hae-Wol Cho, Chaeshin Chu
Osong Public Health and Research Perspectives.2014; 5(5): 243. CrossRef - Journal Publishing: Never Ending Saga
Hae-Wol Cho, Chaeshin Chu
Osong Public Health and Research Perspectives.2014; 5(1): 1. CrossRef - Summing Up Again
Hae-Wol Cho, Chaeshin Chu
Osong Public Health and Research Perspectives.2014; 5(4): 177. CrossRef - Years of Epidemics (2009–2011): Pandemic Influenza and Foot-and-Mouth Disease Epidemic in Korea
Hae-Wol Cho, Chaeshin Chu
Osong Public Health and Research Perspectives.2013; 4(3): 125. CrossRef - Public Health Crisis Preparedness and Response in Korea
Hye-Young Lee, Mi-Na Oh, Yong-Shik Park, Chaeshin Chu, Tae-Jong Son
Osong Public Health and Research Perspectives.2013; 4(5): 278. CrossRef - Was the Mass Vaccination Effective During the Influenza Pandemic 2009–2010 in Korea?
Hae-Wol Cho, Chaeshin Chu
Osong Public Health and Research Perspectives.2013; 4(4): 177. CrossRef - How to Manage a Public Health Crisis and Bioterrorism in Korea
Hae-Wol Cho, Chaeshin Chu
Osong Public Health and Research Perspectives.2013; 4(5): 223. CrossRef
 PubReader
 Cite
Cite


