
Articles
- Page Path
- HOME > Osong Public Health Res Perspect > Volume 5(3); 2014 > Article
-
Original Article
Molecular Typing ofMycobacterium intracellulare Using Pulsed-Field Gel Electrophoresis, Variable-Number Tandem-Repeat Analysis, Mycobacteria Interspersed Repetitive-Unit-Variable-Number Tandem Repeat Typing, and Multilocus Sequence Typing: Molecular Characterization and Comparison of Each Typing Methods - Semi Jeona, Nara Lima, Seungjik Kwona, Taesun Shimb, Misun Parka, Bum-Joon Kimc,d,e, Seonghan Kima
-
Osong Public Health and Research Perspectives 2014;5(3):119-130.
DOI: https://doi.org/10.1016/j.phrp.2014.04.003
Published online: May 9, 2014
aDivision of Tuberculosis and Bacterial Respiratory Infections, Korea National Institute of Health, Korea Centers for Disease Control and Prevention, Osong, Korea
bDivision of Pulmonary and Critical Care Medicine, Department of Internal Medicine, Asan Medical Center, College of Medicine, University of Ulsan, Seoul, Korea
cDepartment of Microbiology and Immunology, College of Medicine, Seoul National University, Seoul, Korea
dCancer Research Institute, College of Medicine, Seoul National University, Seoul, Korea
eLiver Research Institute, College of Medicine, Seoul National University, Seoul, Korea
- ∗Corresponding authors. kbumjoon@snu.ac.krkkingsh@chol.com
- ∗Corresponding authors. kbumjoon@snu.ac.krkkingsh@chol.com
© 2014 Published by Elsevier B.V. on behalf of Korea Centers for Disease Control and Prevention.
This is an open access article under the CC BY-NC-ND license (http://creativecommons.org/licenses/by-nc-nd/3.0/).
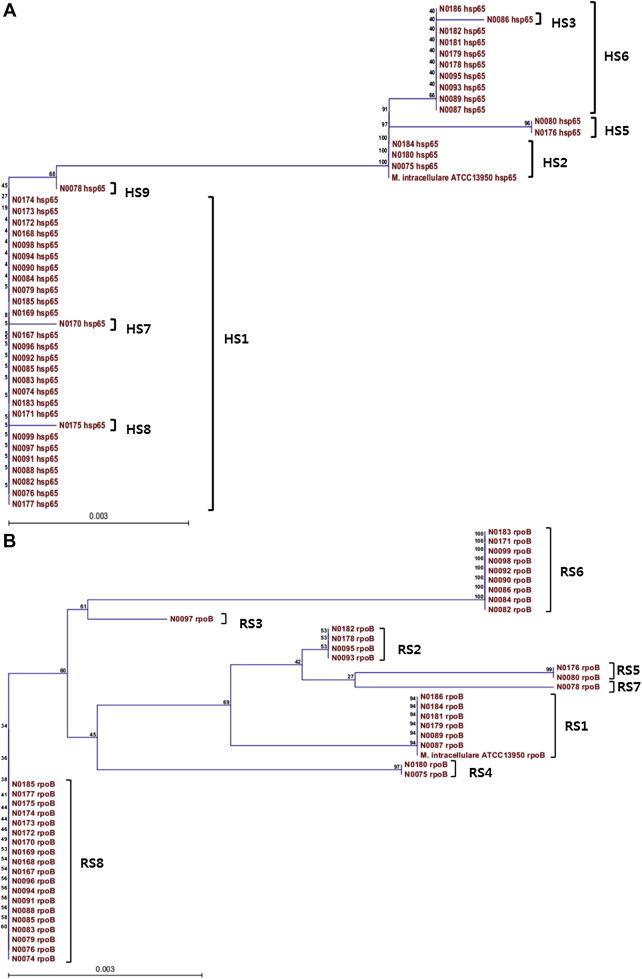
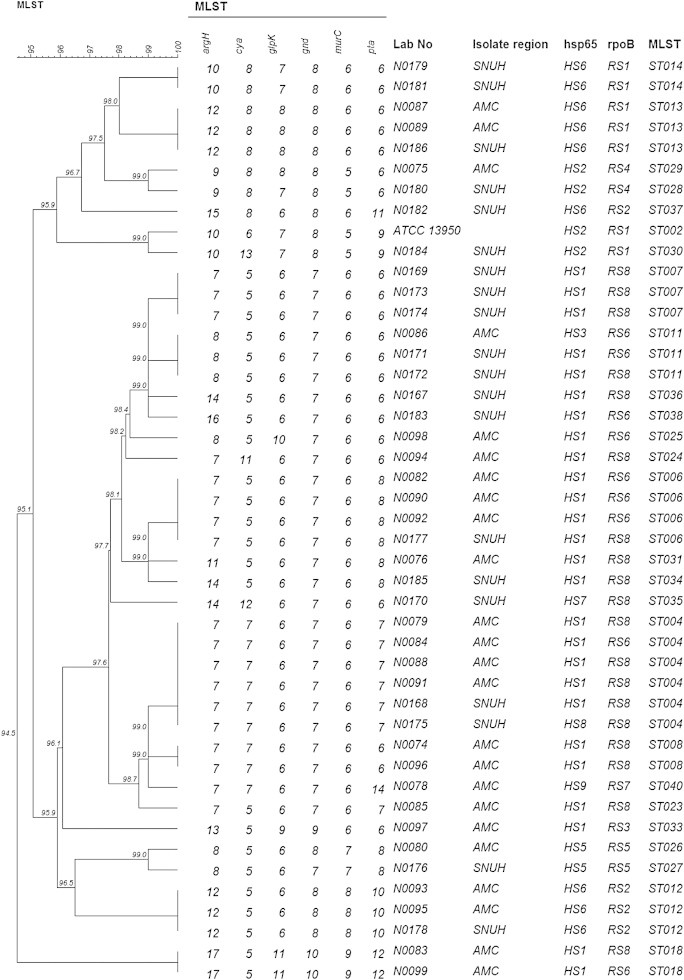

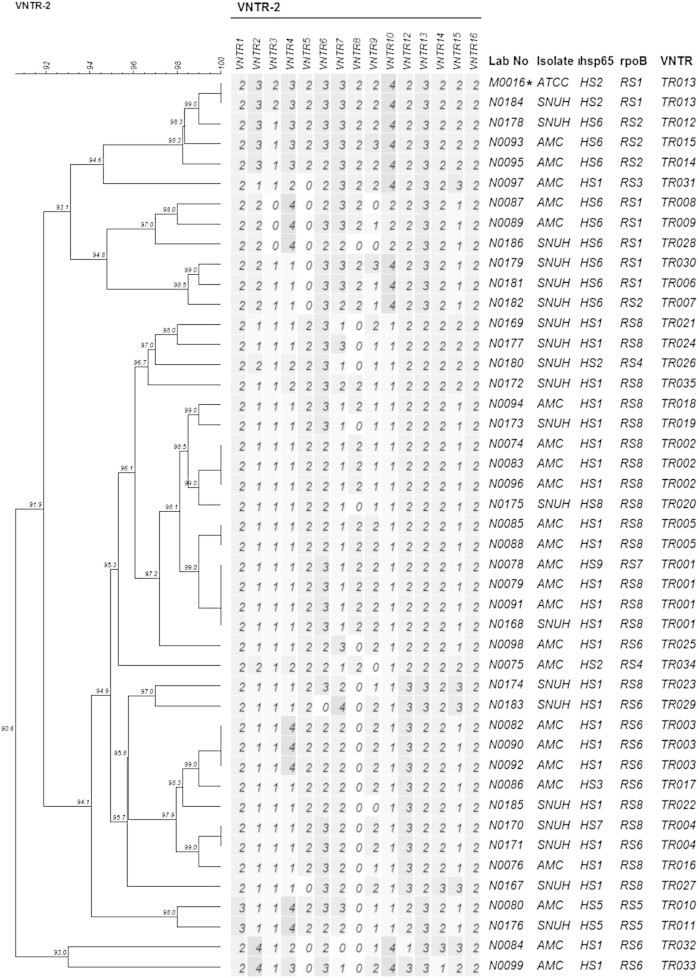
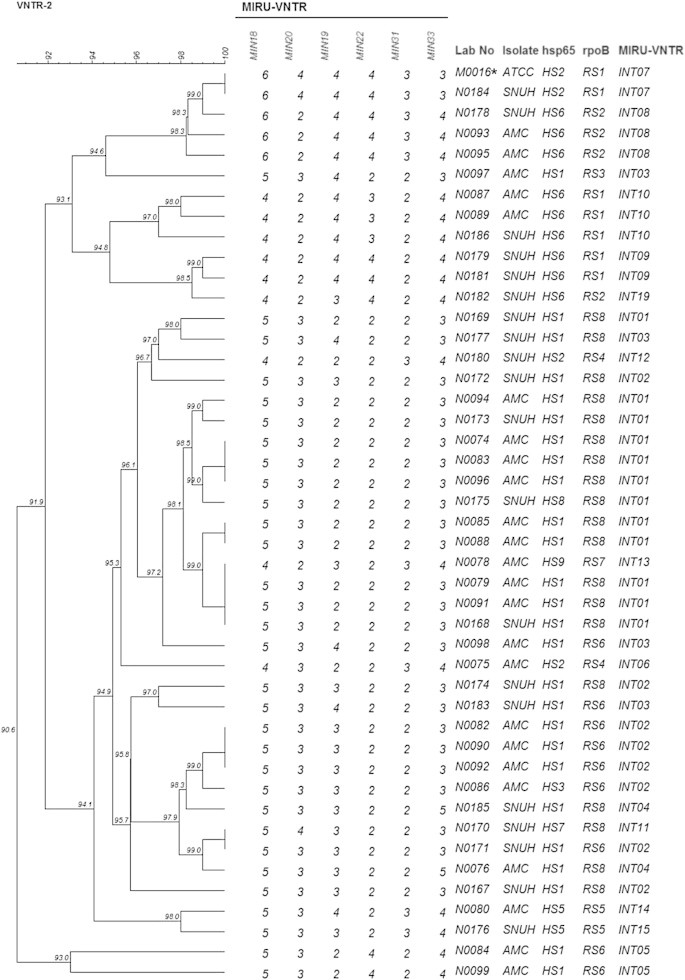
Figure & Data
References
Citations
- Differential Genotyping of Mycobacterium avium Complex and Its Implications in Clinical and Environmental Epidemiology
Jeong-Ih Shin, Sung Jae Shin, Min-Kyoung Shin
Microorganisms.2020; 8(1): 98. CrossRef - A strategy based on Amplified Fragment Length Polymorphism (AFLP) for routine genotyping of nontuberculous mycobacteria at the clinical laboratory
Sara Blanco-Conde, Carolina González-Cortés, Ramiro López-Medrano, Juan José Palacios-Gutiérrez, Cristina Diez-Tascón, Teresa Nebreda-Mayoral, María Josefa Sierra-García, Octavio Miguel Rivero-Lezcano
Molecular Biology Reports.2020; 47(5): 3397. CrossRef - Comparative Evaluation of Band-Based Genotyping Methods for Mycobacterium intracellulare and Its Application for Epidemiological Analysis
Jeong-Ih Shin, Jong-Hun Ha, Dong-Hae Lee, Jeong-Gyu Choi, Kyu-Min Kim, Seung Jun Lee, Yi Yeong Jeong, Jong Deog Lee, Myunghwan Jung, Seung-Chul Baik, Woo Kon Lee, Hyung-Lyun Kang, Min-Kyoung Shin, Jung-Wan Yoo
Microorganisms.2020; 8(9): 1315. CrossRef - Pulsed Field Gel Electrophoresis: Past, present, and future
Lilia Lopez-Canovas, Maximo B. Martinez Benitez, Jose A. Herrera Isidron, Eduardo Flores Soto
Analytical Biochemistry.2019; 573: 17. CrossRef - Molecular typing of Mycobacterium kansasii using pulsed-field gel electrophoresis and a newly designed variable-number tandem repeat analysis
Zofia Bakuła, Anna Brzostek, Paulina Borówka, Anna Żaczek, Izabela Szulc-Kiełbik, Agata Podpora, Paweł Parniewski, Dominik Strapagiel, Jarosław Dziadek, Małgorzata Proboszcz, Jacek Bielecki, Jakko van Ingen, Tomasz Jagielski
Scientific Reports.2018;[Epub] CrossRef -
Mycobacterium paraintracellulare sp. nov., for the genotype INT-1 of Mycobacterium intracellulare
So-Young Lee, Byoung-Jun Kim, Hong Kim, Yu-Seop Won, Che Ok Jeon, Joseph Jeong, Seon Ho Lee, Ji-Hun Lim, Seung-Heon Lee, Chang Ki Kim, Yoon-Hoh Kook, Bum-Joon Kim
International Journal of Systematic and Evolution.2016; 66(8): 3132. CrossRef - Methodological and Clinical Aspects of the Molecular Epidemiology of Mycobacterium tuberculosis and Other Mycobacteria
Tomasz Jagielski, Alina Minias, Jakko van Ingen, Nalin Rastogi, Anna Brzostek, Anna Żaczek, Jarosław Dziadek
Clinical Microbiology Reviews.2016; 29(2): 239. CrossRef - Genetic diversity of clinical Mycobacterium avium subsp. hominissuis and Mycobacterium intracellulare isolates causing pulmonary diseases recovered from different geographical regions
Kazuya Ichikawa, Jakko van Ingen, Won-Jung Koh, Dirk Wagner, Max Salfinger, Takayuki Inagaki, Kei-ichi Uchiya, Taku Nakagawa, Kenji Ogawa, Kiyofumi Yamada, Tetsuya Yagi
Infection, Genetics and Evolution.2015; 36: 250. CrossRef
 PubReader
 Cite
Cite


