
Articles
- Page Path
- HOME > Osong Public Health Res Perspect > Volume 7(3); 2016 > Article
-
Original Article
Association between Pollen Risk Indexes, Air Pollutants, and Allergic Diseases in Korea - Hoseob Kima, Yoonhyung Parka, Kwanjun Parkb, Byoungin Yooa
-
Osong Public Health and Research Perspectives 2016;7(3):172-179.
DOI: https://doi.org/10.1016/j.phrp.2016.04.003
Published online: May 26, 2016
aDepartment of Preventive Medicine, Soonchunhyang University, Cheonan, Korea
bEwha Institute of convergence Medicine, Ewha Womans University Mokdong Hospital, Korea
- ∗Corresponding author.
• Received: March 14, 2016 • Revised: April 18, 2016 • Accepted: April 20, 2016
Copyright © 2016 Korea Centers for Disease Control and Prevention. Published by Elsevier Korea LLC.
This is an open access article under the CC BY-NC-ND license (http://creativecommons.org/licenses/by-nc-nd/4.0/).
Abstract
-
Objectives
- This study, different from the past researches, has been conducted in all age groups to understand the association between air pollutants, pollen risk indexes, and outpatients with allergic rhinitis (AR), asthma, and atopic dermatitis (AD).
-
Methods
- Data on air pollutants, pollen risk indexes, and outpatients with each disease were collected from 2003 through 2011 to verify the association between them. All data are time-series materials that have been observed by time (day) and region, and are in a nonlinear shape. In particular, the total number of outpatients per day is a count data that had a Poisson distribution as the response variable. SAS 9.3 was used to make a statistical model, generalized additive model, with lag effects for the analysis.
-
Results
- For allergic diseases during spring (April–May) and fall (September-October), a significant association was shown between the variables of air pollutants, pollens, and the number of outpatients. Especially, the estimates of NO2 [AR (43.00967 ± 0.11284), asthma (52.01837 ± 0.06452), AD (52.01837 ± 0.06452), p < 0.001] in spring and SO2 [AR (43.00967 ± 0.11284), asthma (52.01837 ± 0.06452), AD (52.01837 ± 0.06452), p < 0.001] in fall were highly significant and showed a positive association with all diseases.
-
Conclusion
- Domestically and even internationally, various studies on the allergic diseases are being conducted. However, not many studies related to similar studies. In the need of creating grounds to back up these efforts, additional studies on allergic diseases, as well as researches utilizing pollen data, air pollution data, and claims data provided by the Health Insurance Corporation that has no problem in the representativeness of the data that have close relationships to the allergic disease will be needed.
- Global warming following climate change has been causing direct effects such as natural disasters including drought and flood, as well as indirect effects such as an increase in the number of air pollutants as well as expansion of allergens [1]. With the initiation of the Climate Change Regime enacted in the year 2015 in the Paris Convention on Climate Change, the importance of climate change has come to the fore once again [2].
- With the rise in the annual mean temperature, the blossoming season picked up its speed, resulting in an increase in both the amount of pollen being created and the number of people being exposed to them. Accordingly, the prevalence rates of allergic diseases, including allergic rhinitis (AR), asthma, atopic dermatitis (AD), and allergic conjunctivitis, are increasing 3, 4.
- It is very likely that if symptoms of AD develops at infancy, it may lead to AR and asthma during adulthood [5]; allergic disease may vary with people’s growth processes.
- One of the main reasons for the development of these allergic diseases is pollen, and according to a domestic study conducted in 2010–2011 involving respiratory allergic patients’ skin, 34.14% showed a positive reaction to tree pollen and 28.65% to weed pollen [6]. Other studies including allergic skin tests have also been conducted domestically and internationally 7, 8, 9.
- Air pollutants that have been formed due to climate change may deform epidermis, affecting the immune reaction, and by mixing with pollen, may increase the chances of allergic diseases such as asthma, AR, and allergic conjunctivitis 10, 11, 12, 13, 14. Moreover, it is reported that they may lead to skin problems such as AD [15].
- A lot of research works on allergic diseases and air pollution have been conducted. Out of these, several studies were conducted in children and adolescents, and the main finding was that there is a significant correlation between allergic diseases, such as AR and asthma, air pollutants, such as fine dust (PM10) and sulfur dioxide (SO2) 16, 17, 18.
- Domestically, the Korean Academy of Pediatric Allergy and Respiratory Disease and the National Institute of Meteorological Sciences have made efforts to prevent these diseases, and succeeded in inventing a model for predicting pollen concentration in the atmosphere by utilizing meteorological elements such as precipitation and temperature. Moreover, regional forecast is provided by calculating the pollen risk index. Pollen observation is done throughout the year, from February to November, excluding January and December. By months, tree pollen is closely examined during March–May, whereas grass pollen is examined in May–September and weed pollen in August–October [19].
- Most of the existing researches in infants and teenagers have analyzed the association by utilizing data on allergic diseases, weather, or air pollution. This study has been conducted for all age groups with an aim to understand the association between the number of outpatients with allergic diseases, air pollutants by pollen types, and pollen risk indexes by analyzing their interconnectivity, with the help of additional data on pollen risk index.
Introduction
- 2.1 Meteorological data
- Korea’s modern weather observation initiated in the year 1904 by observing the temperature, precipitation, and atmospheric pressure, and in the year 2000, Automated Synoptic Observation System was brought about, automating weather observation by improving aspects that required examining with the human eyes. The Meteorological Administration is operating the Regional Meteorological Office as well as the Meteorological Station, and is automatically observing 11 factors regionally, including atmospheric pressure, temperature, wind direction, wind speed, humidity, precipitation, likeliness of rainfall, insolation, sunshine duration, surface temperature, and grass temperature, as well as manually observing five factors, including visual range, cloud cover, cloud formation, evaporation loss, and earth temperature.
- Meteorological data were provided by the Meteorological Administration, and meteorological factors observed by cities from the year 2003 to 2011 were processed and utilized.
- 2.2 National Health Insurance Service data
- National Health Insurance Service data can largely be divided into the claims data related to the claims of the care facility, and medical expenses aid for the medical service recipients and its qualification data. Here, claims data are related to the care facility’s claim on medical services, and have information on each claim’s moment of treatment as well as respective disease information.
- In order to proceed toward the analysis of climate change and the effects of allergens on allergic diseases, this study utilized National Health Insurance Service’s health insurance claims data and qualification data, accumulated from the year 2003 through 2011, regarding several allergic diseases including AR (J30), asthma (J45), and AD (L20). For the variables, factors needed to process the data, such as personal ID, area of residence, start date of treatment, classification code, type of treatment, major/minor diseases, and the days of hospitalization, were used.
- 2.3 Air pollution data
- For the air pollution data, the National Institute of Environmental Research is operating 233 Air Pollution Monitoring Networks (as of 2008) in 71 cities in order to figure out the mean air concentration level of air pollutants in the city areas. Twenty-seven networks are operated in Seoul, 17 in Busan, 11 in Daegu, 15 in Incheon, seven in Gwangju, seven in Daejeon, 14 in Ulsan, 64 in Gyeonggi, seven in Kangwon, seven in Chungbuk, seven in Chungnam, 10 in Jeonbuk, 12 in Jeonnam, 11 in Gyeongbuk, 15 in Gyeongnam, and three in Jeju. Measurement items in relation to the atmospheric environmental standards include SO2, carbon monoxide (CO), nitrogen dioxide (NO2), fine dust (PM10), and ozone (O3), which are measured once every hour.
- In this study, in order to evaluate the effect of each region’s daily air pollution concentration level on people’s health, daily midvalue was selected using hourly observation values and 24 observation values of each observation spot. Seoul calculated its hourly midvalue by averaging the hourly observation value collected from 27 networks, and utilized 24 midvalues per day in this study. For example, for the daily midvalue, ozone concentration was calculated using the maximum value of all moving average values collected every 8 hours.
- 2.4 Pollen risk index data
- Data related to pollen were provided by the National Institute of Meteorological Research. Pollen is thought to be the main cause of allergic diseases including asthma, rhinitis, and conjunctivitis. Pollen can be classified into the following major types: tree pollen, weed pollen, and grass pollen; they reach their peak two times a year (March–May and September–October). Normally, tree pollen occurs during spring, followed by grass pollen during summer and weed pollen during fall.
- Developed countries are already providing regional pollen maps and pollen calendars, and are also engaging in pollen forecast during the pollen peak seasons. Likewise, within the seven regions in Korea (Seoul, Gyeonggi-do, Kangwon-do, Jeollanam-do, Jeollabuk-do, Gyeongsangbuk-do, Gyeongsangnam-do, Chungcheongnam-do, Chungchengbuk-do, and Jeju-do), pollen is observed in a total of 12 places. The Meteorological Administration estimates pollen allergic risk indexes by putting the observed pollen values into the self-developed forecast equation diversified by pollen types. The pollen risk index has four stages: the first stage is weak, followed by caution, dangerous, and very dangerous stages. In this study, analysis of data was carried out utilizing tree and weed pollen risk indexes.
- 2.5 Statistical analysis
- The data related to air pollutants, pollen risk indexes, and outpatients with allergic diseases were analyzed with descriptive statistics and a statistical model. In particular, the number of average outpatients per day as the response variable followed the Poisson distribution so that the generalized additive model (GAM) was used with lag effects for this analysis.
- The GAM is an extension of the generalized linear model that could be used for nonlinear regression between dependent and independent variables in time-series data. The basic GAM model can be in a nonlinear form:where
Materials and methods
- 3.1 Descriptive statistics of allergic diseases, level of pollen, and air pollutants
- In the seven cities in Korea, we analyzed the number of average daily outpatients for gender and age groups for each disease, such as AR, asthma, and AD.
- Table 1 shows the descriptive statistics of some demographics in Korea from 2003 through 2011. The number of average daily outpatients with AR for gender and age groups during spring was generally smaller than that during fall. Whereas the number of outpatients older than 65 years of age in spring was higher than those in fall (25.0 ± 37.2 compared with 23.4 ± 35.5). The number of outpatients for age group in spring and fall season was gradually decreased until 13–18 years.
- With regard to gender, the number of average daily female outpatients tended to be higher than their male counterparts in two seasons (125.1 ± 162.2 and 105.4 ± 135.5, and 151.0 ± 200.2 and 128.8 ± 168.0, respectively).
- On comparing the data for asthma during spring and fall, the number of average daily outpatients in spring tended to be higher than that in fall (966.5.1 ± 1,124.9 and 959.2.4 ± 1,127.1, respectively). With respect to gender, the number of average daily male outpatients with asthma was higher in fall (465.6 people) that that in spring (453.9 people). Unlike the case of male patients, the number of average daily female outpatients with asthma in spring was higher than that in fall. Regarding age groups, except for 1–6-year and 7–12-year groups, the number of average daily outpatients with asthma in each group is more during spring compared with the number during spring.
- The analysis for AD during 2003–2011, there were no variables that appeared in more than average daily 2 outpatients.
- The measures of PM10, NO2, SO2, O3, and CO in spring during 2003–2011 were 63.2802, 0.0228, 0.0045, 0.0491, and 0.4495, respectively, whereas the amount of air pollutants in fall tends to be lower than that in spring. Except for daily average concentration of PM10, the others are similar during the two periods. The concentration of PM10 is higher during spring than that during fall (Table 2). The reason can be found in the influence of dust comes off from the Chinese.
- Figure 1 shows the trends of average daily outpatients with allergic diseases with respect to tree and weed observation risk indexes from 2003 to 2011. The number of average daily outpatients with AR increased to almost 180 (146%) between 2003 and 2011, and the number of those with asthma also increased to 180 (24%) during the same years. Conversely, the number of average daily outpatients with AD decreased to 130 (39%) during the same period.
- In comparison with the observation risk, trees observation risk index trend went up and down. Especially, the tree index decreased for all diseases such as AR (1.64–1.09), asthma (1.69–1.11), and AD (1.64–1.09) until 2006. After 2006, those indexes increased to 2.20 for AR until 2008, to 2.28 for asthma until 2009, and to 2.22 for AD until 2008. After each points maximized rising up, that’ indexes decreased to 1.61 for AR, 1.66 for asthma, and 1.62 for AD until 2011. Similar to the trend of tree observation risk index, the weed observation risk index also showed the trend of increasing and decreasing during 2003–2011. That’s index increased 1.23 to 1.07 until 2005. After 2005, that index went up and down until 2011 and finally stabilized at 1.41 for all diseases such as AR, asthma, and AD in 2011.
- To estimate the influence of air pollutants on outpatients with AR, asthma, and AD, we conducted statistical analysis with GAM (Table 3). During spring (April–May), there was a highly significant positive association of NO2 (43.00967 ± 0.11284), CO (0.59680 ± 0.00426), and tree observation risk (0.05864 ± 0.00102) with AR. Whereas there was a significant negative association of PM10 (–0.00096 ± 0.00003), SO2 (–41.84247 ± 0.76006), and O3 (–8.08943 ± 0.09434) with AR. PM10 (0.00003 ± 0.00001), NO2 (52.01837 ± 0.06452), and CO (0.28861 ± 0.00246) had a highly significant positive correlation with asthma, whereas SO2 (–29.85902 ± 0.41395) and O3(–8.00023 ± 0.05729) had a significant negative correlation. Lastly, AD was shown to have a highly significant positive correlation with PM10 (0.00009 ± 0.00002) and NO2 (59.34203 ± 0.09460), and highly significant negative correlations with SO2 (–63.48328 ± 0.63210), O3 (–5.48426 ± 0.07969), CO (–0.09750 ± 0.00342), and tree observation risk (–0.00793 ± 0.00088).
- Relationship between air pollutants and diseases during fall (September–October), AR was found to have a significant positive association with NO2 (63.18331 ± 0.15300), SO2 (79.40926 ± 1.26465), O3 (0.40493 ± 0.10363), weed observation risk (0.07412 ± 0.00160), and the number of outpatients with AR, but a significant negative association with PM10 (–0.01405 ± 0.00007) and CO (–0.14895 ± 0.00512). There was a significant positive association between asthma and NO2 (56.20960 ± 0.08115), SO2 (79.96389 ± 0.63530), weed observation risk (0.03753 ± 0.00088), and a significant negative association between asthma and PM10 (–0.01243 ± 0.00004), O3 (–3.44282 ± 0.05736), and CO (–0.19205 ± 0.00250). Finally, AD was shown to have a significantly positive association with NO2 (60.15389 ± 0.13209), SO2 (67.80260 ± 1.04455), and weed observation risk (0.06938 ± 0.00147), and a significant negative association with PM10 (–0.01496 ± 0.00007), O3 (–4.33264 ± 0.09274), and CO (–0.50693 ± 0.00380).
- Especially, the estimates of NO2 [AR (43.00967 ± 0.11284), asthma (52.01837 ± 0.06452), AD (52.01837 ± 0.06452), p < 0.001] in spring were highly statistically significant and showed a positive association with all diseases.
- SO2 also showed a highly significant and positive association with all diseases [AR (43.00967 ± 0.11284), asthma (52.01837 ± 0.06452), AD (52.01837 ± 0.06452), p < 0.001] was in fall.
Results
- We collected data from the National Health Insurance Service’s disease data, Meteorological Administration’s meteorological data, National Institute of Meteorological Research’s pollen risk index data, and National Institute of Environmental Research’s air pollution data, and analyzed the trends of the collecting data using statistical methods.
- From the statistical outputs, there are some significant results among allergic diseases, pollen risk index, and air pollutants with outpatients.
- AR was shown to have a highly significantly association with PM10, NO2, SO2, O3, CO, tree observation risk, and weed observation risk during spring and fall. It was proved that there is a significant association between the emergence of AR patients and the concentration levels of air pollutants such as pollen, SO2, CO, NO2, and PM10 20, 21, 22.
- Asthma showed a highly significant association with PM10, NO2, SO2, O3, CO, and weed observation risk during fall. However, during spring, there was a highly significant association between asthma and PM10, NO2, SO2, O3, and CO, except for tree observation risk. In accordance with other studies conducted on the association between air pollutants and pollen, setting the number of emergency room visits and emergency room phone calls due to aggravation of asthma as variables, it could be concluded that the number of emergency room visits due to asthma has a correlation with the concentration levels of pollen, ozone, PM10, NO2, SO2, O3, and CO 23, 24, 25, 26.
- Lastly, AD was shown to have a significant association with PM10, NO2, SO2, O3, CO, and weed observation risk during spring and fall. According to a study done on climate change and AD, there is a correlation between the concentration levels of SO2, O3, CO, and NO2, and the occurrence of AD 27, 28.
- Actually, other studies have shown that the effects of air pollutants and pollen on other diseases multiply. Kampa and Castanas [29] and Künzli et al [30] stated that air pollutants such as PM10, NO2, SO2, O3, and CO contribute to acute and chronic effects on human health and have an effect on increased mortality and morbidity. Therefore, these pollutants affect many different systems and organs, causing minor upper respiratory irritation to chronic respiratory and acute respiratory infections in children and chronic bronchitis in adults, aggravating pre-existing heart and lung disease or asthmatic attacks. Nonetheless, another study states that in regions severely contaminated with SO2, the rate of allergic diseases decreases [31]. Kim [14] explained the mechanism of how climate change increases and aggravates AD, but stated that there are no epidemiologic data to support the relationship between climate change and AD [26]. There are also studies stating that there is no correlation between air pollutants and allergic diseases, different from the idea denoted in this study [32].
- This study has several limitations. First of all, within the analysis of the inpatients by disease type, there were no pollen or air pollutants that had statistically approvable correlations. This is assumed to be the result of having only a few patients being hospitalized for allergic diseases.
- Second is that the study did not use PM2.5 as an air pollutant. In a lot of dissertations, PM2.5 was used as a variable. As the effect of PM2.5 on the human mechanism is being stressed more than before, analysis of this variable is of concern.
- The third aspect is that the number of allergic disease patients counted using the claims data of the National Health Insurance Service could have been underestimated, as patients suffering from allergic diseases are not classified as allergic disease patients if not officially treated in a hospital.
- Lastly, the study failed to take into consideration the individual level of exposure to air pollutants, and pollen level by smaller regions. For the air pollutant, the individual levels of exposure were not considered, and also for the pollen risk index, it was calculated as the same risk index if a particular region was classified as the same city or province.
- Domestically and even internationally, various studies on allergic diseases are being conducted. However, not many studies related to similar studies. In the need of creating grounds to back up these efforts, additional studies on allergic diseases, as well as researches utilizing pollen data, air pollution data, and the claims data provided by the Health Insurance Corporation that has no problem in the representativeness of the data that have close relationships to the allergic disease, will be needed.
Discussion
- The authors have no conflicts of interest associated with the materials presented in this paper.
Conflicts of interest
-
Acknowledgements
- This study was supported by the “Development of Climate-Change Health Impact Assessment and Adaptation Technologies” project (No. 412-111-002), which is granted by Korea Environmental Industry & Technology Institute and the Ministry of the Environment as an Eco-Innovation Project.
Acknowledgments
- 1. McMichael A.J., Woodruff R.E., Hales S.. Climate change and human health: present and future risks. Lancet 367(9513). 2006 Mar;859−869. PMID: 16530580.ArticlePubMed
- 2. Robbins A.. How to understand the results of the climate change summit: Conference of Parties 21 (COP21) Paris 2015. J Pub Health Policy 37:2016;129−132. PMID: 26738430.Article
- 3. Yun J.I.. Climate change impact on the flowering season of Japanese cherry (Prunus serrulata var. spontanea) in Korea during 1941–2100. Korean J Agric For Meteorol 8(2). 2006;68−76.
- 4. Wayne P., Foster S., Connolly J.. Production of allergenic pollen by ragweed (Ambrosia artemisiifolia L.) is increased in CO2-enriched atmospheres. Ann Allergy Asthma Immunol 88(3). 2002 Mar;279−282. PMID: 11926621.ArticlePubMed
- 5. Spergel J.M.. From atopic dermatitis to asthma: the atopic march. Ann Allergy Asthma Immunol 105(2). 2010 Aug;99−106. PMID: 20674819.ArticlePubMed
- 6. Park H.J., Lim H.S., Park K.H.. Changes in allergen sensitization over the last 30 years in Korea respiratory allergic patients: a single-center. Allergy Asthma Immunol Res 6(5). 2014 Sep;434−443. PMID: 25229001.ArticlePubMed
- 7. Laurent J., Lafay M., Lattanzi B.. Evidence for chestnut pollinosis in Paris. Clin Exp Allergy 23(1). 1993 Jan;39−43. PMID: 8439819.ArticlePubMed
- 8. Katial R.K., Lin F.L., Stafford W.W.. Mugwort and sage (Artemisia) pollen cross-reactivity: ELISA inhibition and immunoblot evaluation. Ann Allergy Asthma Immunol 79(4). 1997 Oct;340−346. PMID: 9357380.ArticlePubMed
- 9. Bousquet P.J., Chinn S., Janson C.. Geographical variation in the prevalence of positive skin tests to environmental aeroallergens in the European Community Respiratory Health Survey I. Allergy 62(3). 2007 Mar;301−309. PMID: 17298348.ArticlePubMed
- 10. Mohan J.E., Ziska L.H., Schlesinger W.H.. Biomass and toxicity responses of poison ivy (Toxicodendron radicans) to elevated atmospheric CO2. Proc Natl Acad Sci U S A 103(24). 2006 Jun;9086−9089. PMID: 16754866.ArticlePubMed
- 11. Noyes P.D., McElwee M.K., Miller H.D.. The toxicology of climate change: environmental contaminants in a warming world. Environ Int 35(6). 2009 Aug;971−986. PMID: 19375165.ArticlePubMed
- 12. Reid C.E., Gamble J.L.. Aeroallergens, allergic disease, and climate change: impacts and adaptation. EcoHealth 6(3). 2009 Sep;458−470. PMID: 19908096.ArticlePubMed
- 13. Rusznak C., Devalia J.L., Davies R.J.. The impact of pollution on allergic disease. Allergy 49(18 Suppl). 1994;21−27. PMID: 8053537.ArticlePubMed
- 14. Kim K.H.. Climate change and atopic dermatitis. J Korean Med Assoc 54(2). 2011 Feb;169−174.Article
- 15. Oh Y.C., Kim H.A., Kang I.J.. Evaluation of the relationship between pollen count and the outbreak of allergic diseases. Pediatr Allergy Respir Dis 19(4). 2009 Dec;354−364.
- 16. Oh S.K., Seong H.U., Lim D.H.. Relationship between air pollutants and prevalence of allergic disease/pulmonary function in students in Incheon. Pediatr Allergy Respir Dis 20(4). 2010 Dec;264−276.
- 17. Oh I.B., Lee J.H., Sim C.S.. An association between air pollution and the prevalence of allergic rhinitis in the Ulsan Metropolitan Region. Korean J Environ Health Sci 36(6). 2010 Dec;465−471.Article
- 18. Bae H.J., Kim M.H., Lee A.K.. Acute effects of PM 10 on asthma hospitalization among children and benefit analysis at four major cities in Korea. Korean J Environ Health Sci 35(1). 2009 Feb;1−10.Article
- 19. Oh J.W.. Development of pollen concentration prediction models. J Korean Med Assoc 52(6). 2009 Jun;579−591.Article
- 20. Hwang B.F., Jaakkola J., Lee Y.L.. Relation between air pollution and allergic rhinitis in Taiwanese schoolchildren. Respir Res 7(1). 2006 Feb;23PMID: 16469096.ArticlePubMed
- 21. Zhang F., Krafft T., Zhang D.. The association between daily outpatient visits for allergic rhinitis and pollen levels in Beijing. Sci Total Environ 417–18:2012 Feb;39−44.Article
- 22. Wang K.Y., Chau T.T.. An association between air pollution and daily outpatient visits for respiratory disease in a heavy industry area. PloS One 8(10). 2013;e75220PMID: 24204573.ArticlePubMedPMC
- 23. Gleason J.A., Bielory L., Fagliano J.A.. Associations between ozone, PM 2.5, and four pollen types on emergency department pediatric asthma events during the warm season in New Jersey: a case-crossover study. Environ Res 132:2014 Jul;421−429. PMID: 24858282.ArticlePubMed
- 24. Ruffoni S., Passalacqua G., Ricciardolo F.. A 10-year survey on asthma exacerbations: relationships among emergency medicine calls, pollens, weather, and air pollution. Rev Fr Allergol 53(7). 2013 Nov;569−575.Article
- 25. Gauderman W.J., Avol E., Lurmann F.. Childhood asthma and exposure to traffic and nitrogen dioxide. Epidemiology 16(6). 2005 Nov;737−743. PMID: 16222162.ArticlePubMed
- 26. Rosas I., McCartney H., Payne R.. Analysis of the relationships between environmental factors (aeroallergens, air pollution, and weather) and asthma emergency admissions to a hospital in Mexico City. Allergy 53(4). 1998 Apr;394−401. PMID: 9574882.ArticlePubMed
- 27. Solé D., Camelo-Nunes I., Wandalsen G.. Prevalence of symptoms of asthma, rhinitis, and atopic eczema in Brazilian adolescents related to exposure to gaseous air pollutants and socioeconomic status. J Investig Allergol Clin Immunol 17(1). 2007;6−13.PubMed
- 28. Pénard-Morand C., Charpin D., Raherison C.. Long-term exposure to background air pollution related to respiratory and allergic health in schoolchildren. Clin Exp Allergy 35(10). 2005 Oct;1279−1287. PMID: 16238786.ArticlePubMed
- 29. Kampa M., Castanas E.. Human health effects of air pollution. Environ Pollut 151(2). 2008 Jan;362−367. PMID: 17646040.ArticlePubMed
- 30. Künzli N., Kaiser R., Medina S.. Public-health impact of outdoor and traffic-related air pollution: a European assessment. Lancet 356(9232). 2000 Sep;795−801. PMID: 11022926.ArticlePubMed
- 31. Behrendt H., Becker W.M.. Localization, release and bioavailability of pollen allergens: the influence of environmental factors. Curr Opin Immunol 13(6). 2001 Dec;709−715. PMID: 11677094.ArticlePubMed
- 32. Gruzieva O., Gehring U., Aalberse R.. Meta-analysis of air pollution exposure association with allergic sensitization in European birth cohorts. J Allergy Clin Immunol 133(3). 2014 Mar;767–76.e7.Article
References
Figure 1Trends for the number of average daily outpatients with allergic diseases, tree observation risk, and weed observation risk during 2003–2011. (A) Allergic rhinitis, (B) asthma, and (C) atopic dermatitis.
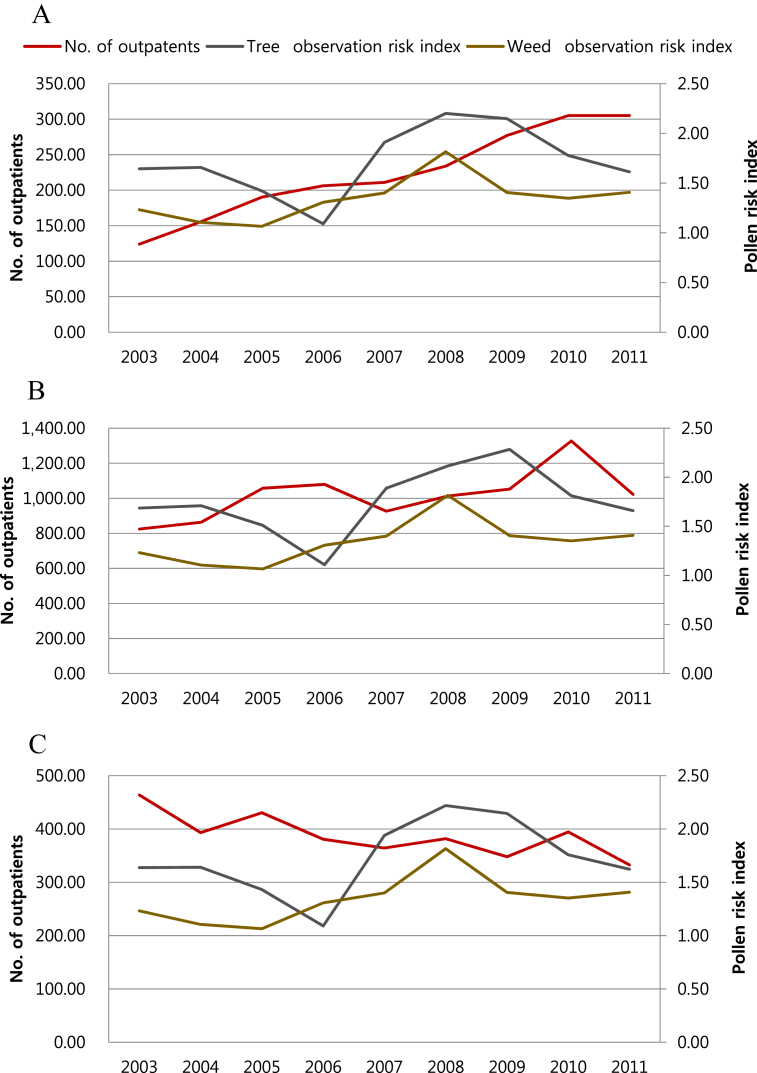
Table 1Descriptive statistics of AR, asthma, AD.
Table 2Descriptive statistics for air pollutants during 2003–2011.
Table 3Generalized additive model analysis of allergic diseases, air pollutants, and pollen risk indexes.
Figure & Data
References
Citations
Citations to this article as recorded by 
- Relationship between periodontal disease and dizziness in Taiwanese adults: A nationwide population-based cohort study
Fu-Mei Huang, Ci-Wen Luo, Shiuan-Shinn Lee, Yung-Chuan Ho, Yi-Ching Li, Yu-Chao Chang, Yu-Hsiang Kuan
Medicine.2023; 102(8): e32961. CrossRef - Air pollution and global healthcare use for atopic dermatitis: A systematic review
R. P. Fadadu, E. Chee, A. Jung, J. Y. Chen, K. Abuabara, M. L. Wei
Journal of the European Academy of Dermatology and.2023; 37(10): 1958. CrossRef - Associations of particulate matter with atopic dermatitis and chronic inflammatory skin diseases in South Korea
T. H. Park, S. Park, M. K. Cho, S. Kim
Clinical and Experimental Dermatology.2022; 47(2): 325. CrossRef - Association between Concentration of Air Pollutants and Prevalence of Inflammatory Sinonasal Diseases: A Nationwide Cross-sectional Study
Munsoo Han, Soo Jeong Choi, Yujin Jeong, Kijeong Lee, Tae Hoon Lee, Sang Hag Lee, Tae Hoon Kim
American Journal of Rhinology & Allergy.2022; 36(5): 649. CrossRef - Outdoor Air Pollution and Indoor Window Condensation Associated with Childhood Symptoms of Allergic Rhinitis to Pollen
Yingjie Liu, Chan Lu, Yuguo Li, Dan Norbäck, Qihong Deng
International Journal of Environmental Research an.2022; 19(13): 8071. CrossRef - Influence of environmental drivers on allergy to pollen grains in a case study in Spain (Madrid): meteorological factors, pollutants, and airborne concentration of aeroallergens
Martha Cabrera, Javier Subiza, Enrique Fernández-Caldas, Belén Garzón García, Stella Moreno-Grau, José Luis Subiza
Environmental Science and Pollution Research.2021; 28(38): 53614. CrossRef - Short term physician visits and medication prescriptions for allergic disease associated with seasonal tree, grass, and weed pollen exposure across the United States
Shubhayu Saha, Ambarish Vaidyanathan, Fiona Lo, Claudia Brown, Jeremy J. Hess
Environmental Health.2021;[Epub] CrossRef - Interactions Between Air Pollution and Pollen Season for Rhinitis Using Mobile Technology: A MASK-POLLAR Study
Annabelle Bédard, Mikhail Sofiev, Sylvie Arnavielhe, Josep M. Antó, Judith Garcia-Aymerich, Michel Thibaudon, Karl Christian Bergmann, Ruta Dubakiene, Anna Bedbrook, Gabrielle L. Onorato, Isabella Annesi-Maesano, Jean-Louis Pépin, Daniel Laune, Stéphane Z
The Journal of Allergy and Clinical Immunology: In.2020; 8(3): 1063. CrossRef - Atmospheric pollutants and their association with olive and grass aeroallergen concentrations in Córdoba (Spain)
Maria Pilar Plaza, Purificación Alcázar, José Oteros, Carmen Galán
Environmental Science and Pollution Research.2020; 27(36): 45447. CrossRef - The assessment of atmospheric conditions and constituents on allergenic pollen loads in Lithuania
I. Sauliene, L. Sukiene, V. Kazlauskiene
Journal of Environmental Management.2019; 250: 109469. CrossRef - Luftverschmutzung und atopisches Ekzem
Ursula Krämer, Heidrun Behrendt
Der Hautarzt.2019; 70(3): 169. CrossRef - Nasal epithelial barrier disruption by particulate matter ≤2.5 μm via tight junction protein degradation
Renwu Zhao, Zhiqiang Guo, Ruxin Zhang, Congrui Deng, Jian Xu, Weiyang Dong, Zhicong Hong, Hongzhi Yu, Huiru Situ, Chunhui Liu, Guoshun Zhuang
Journal of Applied Toxicology.2018; 38(5): 678. CrossRef - The economics of urban afforestation: Insights from an integrated bioeconomic-health model
Benjamin A. Jones, Shana M. McDermott
Journal of Environmental Economics and Management.2018; 89: 116. CrossRef - Urban Trees and Water Use in Arid Climates: Insights from an Integrated Bioeconomic-Health Model
Benjamin A. Jones, John Fleck
Water Economics and Policy.2018; 04(04): 1850022. CrossRef - Prevalence of pollen‐induced allergic rhinitis with high pollen exposure in grasslands of northern China
X.‐Y. Wang, T.‐T. Ma, X.‐Y. Wang, Y. Zhuang, X.‐D. Wang, H.‐Y. Ning, H.‐Y. Shi, R.‐L. Yu, D. Yan, H.‐D. Huang, Y.‐F. Bai, G.‐L. Shan, B. Zhang, Q.‐K. Song, Y.‐F. Zhang, T.‐J. Zhang, D.‐Z. Jia, X.‐L. Liu, Z.‐X. Kang, W.‐J. Yan, B.‐T. Yang, X.‐Z. Bao, S.‐H.
Allergy.2018; 73(6): 1232. CrossRef - Decomposition Analysis of the Factors that Influence Energy Related Air Pollutant Emission Changes in China Using the SDA Method
Shichun Xu, Wenwen Zhang, Qinbin Li, Bin Zhao, Shuxiao Wang, Ruyin Long
Sustainability.2017; 9(10): 1742. CrossRef
 PubReader
 Cite
Cite
