
Articles
- Page Path
- HOME > Osong Public Health Res Perspect > Volume 8(5); 2017 > Article
-
Original Article
Factors Related to Healthcare Service Quality in Long-term Care Hospitals in South Korea: A Mixed-methods Study - Minsung Sohna, Mankyu Choia,b
-
Osong Public Health and Research Perspectives 2017;8(5):332-341.
DOI: https://doi.org/10.24171/j.phrp.2017.8.5.07
Published online: October 31, 2017
aBK21 Plus Program in Public Health Science, Department of Health Science, Graduate School, Korea University, Seoul, Korea
bSchool of Health Policy and Management, College of Public Health Science, Korea University, Seoul, Korea
- Corresponding author: Mankyu Choi, E-mail: mkchoi@korea.ac.kr
• Received: June 7, 2017 • Revised: September 13, 2017 • Accepted: September 29, 2017
Copyright ©2017, Korea Centers for Disease Control and Prevention
This is an open access article under the CC BY-NC-ND license (http://creativecommons.org/licenses/by-nc-nd/4.0/).
Abstract
-
Objectives
- The environment of long-term care hospitals (LTCHs) is critical to the management of the quality of their services and to patient safety, as highlighted by international studies. However, there is a lack of evidence on this topic in South Korea. This study aimed to examine the factors affecting healthcare quality in LTCHs and to explore the effectiveness of their quality management.
-
Methods
- This study used a mixed methods approach with quantitative data collected in a national survey and qualitative data from semi-structured interviews with practice-based managers. The samples included 725 nationally representative LTCHs in South Korea for the quantitative analysis and 15 administrators for the in-depth interviews.
-
Results
- A higher installation rate of patient-safety and hygiene-related facilities and staff with longer-tenures, especially nurses, were more likely to have better healthcare quality and education for both employees and patients.
-
Conclusion
- The need for patient-safety- and hygiene-related facilities in LTCHs that serve older adults reflects their vulnerability to certain adverse events (e.g., infections). Consistent and skillful nursing care to improve the quality of LTCHs can be achieved by developing relevant educational programs for staff and patients, thereby strengthening the relationships between them.
- South Korea is an aging society; adults ≥ 65 years accounted for 12.8% of the total population in 2015, and it is expected to increase to 20% in 2026, 30% in 2037, and 40% in 2058 [1]. Therefore, the need for long-term care for older adults will increase. The number of long-term care hospitals (LTCHs) in Korea increased from 800 in 2010 to 1,339 in 2015, and, total expenditures for long-term care increased from 1.735 trillion won in 2010 to 3.748 trillion won in 2014, including an 18.4% increase in the past year [2]. However, hospital bankruptcies and medical accidents have increased yearly [1], forcing LTCHs to maximize their service, efficiency, and quality.
- Since 2008, the fixed-sum medical fee per day in the LTCH payment system has applied different daily medical insurance fees per hospital, depending on the disease and functional status of the inpatients. This approach has led to insufficient healthcare services and difficulty tracking the actual services provided; thus, simplifying the billing process is needed [3]. An examination of the current healthcare quality of LTCHs and proposals to develop effective management of service quality are also needed in South Korea.
- Previous research on healthcare quality has been conducted mainly in Western nations [4–6]. Smaller institutions were perceived as easier to manage, whereas larger institutions seemed to devote inadequate attention to quality management [7]. Teamwork and a safe environment were predictors of better quality of care [8].
- In a study on the factors related to quality of care, the most influential variable was human resources [9]. Other investigations revealed that the skills and experience of the workforce was a crucial factor in improving the quality of healthcare services [10,11]. When nursing staff had more time to attend to their patients, quality improvement was better [12,13]. The authors, who concluded that allocating sufficient time for patient care prevented infections, recommended it as a way to reduce patients’ length of hospitalization. Furthermore, high staff turnover negatively affected quality of care and patient outcomes [7,13].
- Previous studies on this topic have several limitations. First, their sample sizes make it difficult to generalize the results. Thus, we used a mixed-methods (quantitative and qualitative) approach to address multiple research questions sensitively and comprehensively, which is considered an effective strategy for investigating complex situations (e.g., healthcare industry) [14,15]. Second, research on the service quality of LTCHs for older adults has been conducted mainly in Western nations, making it necessary to determine whether Western hypotheses are applicable to the healthcare industry in East Asian countries, such as South Korea. In these countries, the older population is growing, healthcare expenditures for them are increasing, and competition between LTCHs is high; thus, the status of LTCHs is a serious concern compared to that of their Western counterparts.
- Stage I Quantitative analysis
- The first objective of this study was to measure LTCH quality-efficiency scores using data envelopment analysis (DEA) models and to identify the factors related to quality of care by conducting Tobit regression analysis.
- Stage II Qualitative analysis
- The second objective was to explore hospital administrators’ perspectives on quality care using semi-structured interviews to formulate policies and plans to improve the quality of medical services.
INTRODUCTION
- 1. Study design
- The study used a mixed-methods design consisting of the analysis of national survey data to examine the factors affecting the health-care quality in LTCHs, and semi-structured interviews to explore the effectiveness of quality management (Figure 1).
- 2. Data collection methods
- The “2012 Propriety Assessment of Long-term Care,” conducted by the Health Insurance Review and Assessment Service (HIRA), was the major source of data for the quantitative analysis. The survey assesses the level of structure and medical services of LTCHs in South Korea in one- and two-year intervals [16]; the data generated provide quality assessment information [16]. It consists of assessments of medical personnel and the necessary manpower in the structure section, and the following areas in the medical services section: physical, cognitive, urination, skin, diseases, and nutrition management. It is designed to improve the service quality of LTCHs through feedback and to help consumers make informed choices of hospitals.
- Semi-structured interviews were conducted to examine three topics: (a) the present situation, (b) related factors, and (c) management plans for quality improvement in LTCHs. Data were collected through interviews that lasted 40 to 60 minutes, and were conducted and recorded with 15 administrators from 12 LTCHs. Two interviewers transcribed them within 6 weeks of completing the survey (from September 7 to October 18, 2015). The researchers explained the procedures and the topics to be covered to the interviewees by phone before visiting each hospital.
- 3. Settings and samples
- This survey included all LTCHs operating in South Korea before January 2012 and through March 2012 (n = 937). Of these, 163 were excluded because they did not respond to the “2012 Propriety Assessment of Long-term Care Hospitals”; 49 were excluded because of missing values or responses. The final sample consisted of 725 LTCHs (Figure 2).
- Random sampling was used to select 15 practice-based managers for interviews from 12 hospitals in Seoul and Gyeonggi, where most of the LTCHs are located.
- 4. Ethical considerations
- Approval to conduct the qualitative study was obtained from the institutional review board of Korea University (No. 1040548-KU-IRB-15-139-A-1). All participants were informed of the purposes and procedures of this study and that there were no disadvantages to participating in it. They signed informed consent forms prior to the study’s commencement. The study was conducted in accordance with the Ethical Principles for Medical Research Involving Human Subjects outlined in the Helsinki Declaration of 1975 (revised in 2008).
- 5. Measurements
- The DEA method provides a scalar measure of the efficiency of each participating unit for objectively determining weights by reference to the observational data using the multiple outputs and inputs [17]. An efficiency score is generated using information about the various input and output variables, which allows comparisons between efficient and inefficient organizations. It also provides benchmarking information for inefficient organizations and benchmarks for role models that are appropriate for each organization [18]. Therefore, an efficiency analysis using DEA is suitable for developing improvement plans and establishing systematic management strategies.
- The DEA is suitable for use if the sum of the input and output variables is three times less than the number of decision-making units (DMUs) [19]. We satisfied this condition, because the study consisted of nine input variables and five output variables.
- The output variable, healthcare service quality was defined by constructs measuring process and outcome quality [20].
- Process quality was assessed using the patients’ completion rates on two examinations: the rate of patients ≥ 65 years of age who completed the mini-mental state examination (MMSE) and the rate of diabetic patients whose level of glycated hemoglobin A1c (HbA1c) were tested. The MMSE is a widely-used measure of cognitive impairment [21] and the HbA1c is the average plasma glucose concentration over a 3-month period [22].
- Outcome quality was assessed in three areas: the percentage of patients with a decline in activities of daily living (ADL), pressure ulcers, and frequent urinary incontinence were used to assess outcome quality. “Increased rate of patients with ADL limitations” was defined as a higher proportion of hospitalized patients with declining ADL compared to the previous month (face washing, bathing, toileting, dressing, getting up after falling, transfers, going out of the bedroom, eating, brushing teeth, and getting up from a chair). “Increased rate of patients with pressure ulcers” was defined as the proportion of patients with pressure sores that appeared new or had worsened during the previous month. “Rate of patients with urinary incontinence” was defined as the proportion of patients with urinary incontinence. Quality was measured using a 5-point Likert-type scale, we coded it in reverse for the convenience of interpretation, with higher scores indicating better quality of care.
- Hospitals’ facilities/environment were assessed using the total number of beds, number of pieces of medical equipment per 100 beds, rate of hospital rooms with a bathroom, rate of installed amenities, and rate of patient-safety- and hygiene-related facilities. “The number of pieces of medical equipment per 100 beds” consisted of the number of oxygen-therapy machines, aspirators, electrocardiogram monitors, and pulse oximeters per 100 beds. “The rate of installed amenities” included the installation of safe bathrooms, which required a yes (1) or no (0) response; amenities in the cafeteria/lounge required one of three possible responses: both (cafeteria and lounge) (2), one of the two (1), and neither (0). “The rate of installed patient-safety- and hygiene-related facilities” included six items: removal of floor obstacles, installation of anti-slip floors, safety levers, an emergency call system, and infection control and fire inspection activities. The responses were grouped into three categories: total (2), partial (1), and none (0), except for fire inspection, which required a yes (1) or no (0) answer.
- Human resources were assessed using four variables: the number of patients per doctor, the number of patients per nursing staff member (registered nurses [RNs] and nurses’ aides [NAs]), the rate of nursing staff turnover, and the rate of average working days of medical aid personnel. “The number of patients per doctor or nursing staff member” was obtained by dividing the number of doctors or nursing staff by the average number of patients. “The rate of nursing staff turnover” was the number of nursing staff members who left during the survey period divided by the average number of nursing staff members during the same period. “The rate of days of medical aid personnel” (e.g., pharmacists, radiological technologists, medical technologists, social workers, and medical records administrators) was measured as the number of days of medical aid personnel divided by the total number of days during the survey period.
- Tobit regression analysis is a method proposed by Tobin. Tobit regression analysis is used when there is a lower bound on the dependent variable, and the value below the lower limit is truncated [23]. If the value is greater than 0, it is predicted by y, but if it is less than 0, it is predicted as 0. In this study, the dependent variable is the quality-efficiency score calculated by DEA, and the independent variables are the nine input variables used in DEA. Thus, Tobit regression analysis was used because the dependent variable had a value of zero or more as an efficiency score.
- 6. Data analysis
- Descriptive statistics for the sample characteristics (frequencies, means, standard deviations, and ranges) were calculated. The LTCH quality-efficiency scores were obtained through DEA using Efficiency Measurement System (EMS) version 1.3 software. Tobit regression analysis was performed to identify the factors related to quality of care. All statistical analyses were conducted using STATA v.13 (Stata Co., College Station, TX, USA), except for the quality-efficiency scores.
- Semi-structured interviews were conducted with practice-based team leaders. We coded the qualitative data using an iterative method based on the grounded theory approach to data analysis [24].
MATERIALS AND METHODS
1) Stage I: Quantitative analysis
2) Stage II: Qualitative analysis
1) Stage I: Quantitative analysis
2) Stage II: Qualitative analysis
1) Data envelopment analysis (DEA)
(1) Output variables
(2) Input variables
2) Tobit regression
1) Stage I: Quantitative analysis
2) Stage II: Qualitative analysis
- 1. General sample characteristics
- Table 1 presents the LTCHs’ characteristics. The highest percentage of hospitals (21.2%) were in Gyeonggi, followed by Busan (13.8%), Seoul (8.7%), and the other regions. A total of 27.7% of LTCHs had 101 to 150 beds. The quality-evaluation scores indicated that level 3 quality was provided by 28.2% of LTCHs, followed by level 4, provided by 25.5%, level 2 by 20.3%, level 1 by 13.8%, and level 5 by 12.2% (with a higher level indicating better quality).
- 2. Sample characteristics for the input and output variables
- Descriptive statistics for the input and output variables of the LTCHs are presented in Table 2. For the input variables, the average number of beds was 160.46 ± 82.44; the average number of pieces of medical equipment per 100 beds was 14.67 ± 10.95; and the average number of patients per doctor and per nurse were 31.21 ± 4.96 and 4.49 ± 0.65, respectively. The rate of nursing staff turnover was 24.89% ± 22.16.
- For the output variables, the rates of patients who completed the MMSE among those ≥ 65 years of age and the HbA1c among diabetic patients were 88.71% ± 21.19 and 87.87% ± 22.10, respectively. The percentages of patients with ADL limitations, pressure ulcers, and urinary incontinence were 93.50% ± 5.98, 82.11% ± 14.93, and 99.42% ± 1.45, respectively.
- 3. Factors related to LTCH quality-efficiency
- The Tobit regression analysis revealed that the LTCHs with more beds (B = 0.047), and medical equipment (B = 0.348), higher rates of hospital rooms with bathrooms (B = 0.133), and installed patient-safety- and hygiene-related facilities (B = 3.047) were significantly more likely to have better quality of care (Table 3).
- The LTCHs with more nursing staff (RNs and NAs) (B = −8.075) with longer tenure (B = −0.170) were significantly more likely to provide better quality of care. However, the relationship between the number of doctors and the quality of care was not statistically significant.
- 4. Interviews with LTCH personnel and their perceptions of problems with management of healthcare services
- The participants who were interviewed opined that humans are the most important resource for improving the quality of medical services. To them, appropriate patient-to-medical personnel ratios are required to provide high-quality services, but the case-payment system prevented them from ensuring high quality because of the low payment rates. According to one quality team leader, “LTCHs are under a fixed-sum medical fee per day, like a Diagnosis Related Group, and their primary goal can only be cost minimization in such a fixed-profit structure.” A nurse manager explained, “The turnover rate of nursing staff is a serious problem. Many nurses look for positions in LTCHs with a relatively low intensity of work, so as to work more comfortably. These nurses change jobs easily, which is a problem.”
- 5. Factors related to healthcare service quality in LTCHs
- The major elements that determine the quality of a hospital’s facilities/environment were identified as its hospitals’ scale, accessibility, medical equipment, patient safety, and hygiene management. Safety and hygiene management (cleanliness and patient safety), were emphasized because older adults are vulnerable to infections. According to a nurse, “Cleanness must be emphasized—especially for older adults because they are more vulnerable to infectious diseases, such as pneumonia. We can prevent infectious diseases by keeping our hands clean and by complying with the standard rules for disinfection.”
- Humans were identified as the most important resource by participants. Thus, human resources included the numbers of medical personnel, turnover rates, and job skills. A manager said, “In the case of LTCHs, nurses and nurse assistants play major roles because more emphasis is put on care than on treatment.” Another administrator explained, “I think that the decisive elements are medical personnel’s job competencies, career, and the like. Low turnover implies not only improved job skills, but also a consistent and high level of job performance.” Whether or not an activity for quality improvement can be sustained depends on how managers play their roles as leaders. Good teamwork developed through effective leadership will prevent adverse medical events and other problems.
- 6. Management plan for improving healthcare service quality in LTCHs
- Education not only helps employees improve their clinical skills, but also enhances their understanding of quality improvement and motivates them. For example, one manager said, “…, we essentially need education for them (employees) and knowledge-sharing among them. Once all employees have shared knowledge—knowledge of why they have to make an effort to improve quality and what such effort entails—then, they can take the next step to practice what they share.” Another interviewer explained, “We have a 15-minute meeting every morning to promote cooperation between employees and to deal quickly with problems. We make an effort to resolve problems immediately by quickly recognizing accidents—such as falls, adverse medical events, and infection—and sharing patients’ complaints. As a result, many issues have been corrected, and, in particular, there has been much improvement in communication between employees.”
- Sharing ideas and opinions with patients was considered a more efficient way of managing medical service quality. According to one manager, “We are making efforts to improve service quality by conducting surveys with patients on their satisfaction with it. It is more important to reflect patients’ and caregivers’ opinions and improve whatever we can accordingly, than to make decisions on actions only at the employee level.” Another leader said, “We use a ‘Customer Voice Box’ to collect patients’ and caregivers’ complaints so that we can make improvements. The complaints collected during rounds are sent to relevant departments so that appropriate employees can personally meet with the patients and caregivers who made them. For example, when a patient made a complaint about the food, we requested a nutritionist to meet and talk with the patient and the patient’s caregivers.”
RESULTS
1) Facilities/environment
2) Human resources
1) Employee education and efforts to promote communication
2) Reflecting the opinions of patients and caregivers
- This study identified factors related to quality of care and plans for improving the management of health-care services in LTCHs. We used secondary data from the “2012 Propriety Assessment of Long-term Care” provided by the HIRA. The relative quality-efficiency scores of the LTCHs were obtained using DEA, and the factors affecting quality were obtained using Tobit regression analysis. Interviews were conducted with LTCH personnel to assess the status of LTCHs and gather opinions about the future direction of policies for efficient quality management.
- The most frequently mentioned difficulty by LTCH personnel was that they could barely provide high-quality medical services since the fixed-sum medical fee per day payment system was implemented in 2008. This system’s requirement to minimize the number of healthcare personnel has led to an increase in the delivery of inadequate services. This trend is consistent with the results of a study in which a nationwide survey of 104 chief executive officers from LTCHs revealed problems involving changes in LTCH fee systems; they suggested solutions for this problem [3]. Furthermore, managing the payment system in a balanced manner by introducing a merit fee-for-service system or differentiated compensation to the LTCHs is necessary to prevent the delivery of poor quality services.
- The factors affecting LTCHs’ healthcare service quality included facilities/environment and human resources. The quantitative analysis showed that the LTCHs’ quality of health care improved as the number of beds and pieces of medical equipment and the rates of the hospital rooms with bathrooms and patient-safety- and hygiene-related facilities increased. This result is consistent with a study that reported more systematic quality management in larger LTCHs [7] and another study that examined the severity of hospital-acquired infections in LTCHs [25]. They are also consistent with the findings of a study that examined the safety of environments of LTCHs’ [8]. Infection control and the installation of safety facilities are especially important in LTCHs because older adults are vulnerable to infectious diseases (pneumonia) and accidents (falls), and they comprise the majority of patients. Management strategies to promote patient safety and hygiene should help prevent hospital-acquired infections and other adverse events.
- This study showed that the level of medical service quality was higher in LTCHs with a lower ratio of patients to nurses and a lower turnover rate of nursing personnel. The participants who were interviewed identified medical personnel as the most important resource for improving healthcare quality. In particular, nurses and nurses’ assistants were considered vital to providing high-quality care. This finding is similar to those reported in research on the importance of nursing staff in LTCHs [7,10,11,26], and they are supported by another study that found that medical personnel had the greatest effect on healthcare quality [9]. Nursing personnel typically spend more time with patients than other personnel do because LTCHs generally operate for the purpose of providing care rather than treatment [13,27]. Low turnover was an important factor in providing better healthcare quality management, which was likely due to the provision of more consistent treatment and effective communication [13,26]. Thus, ongoing personnel management by hospitals should contribute to improving healthcare quality. Providing employees with incentives for positive outcomes (e.g., decreases in pressure ulcers) and making efforts to increase their satisfaction and decrease turnover rates should be considered by LTCH managers who wish to improve healthcare quality [28,29].
- In the interviews, participants cited employee and patient education as the main solutions for improving healthcare quality to promote a climate of collaborative learning [8,26,30]. A study on collaboration found staff cohesion, communication, coordination, and conflict management were more likely to be associated with positive patient outcomes, such as reductions in pressure ulcers and incontinence [31]. Employee education, including professional conferences and meetings, provide opportunities for knowledge acquisition and communication with colleagues, thereby, promoting clinicians’ interest in applying up-to-date knowledge and skills to their clinical practice and increasing their job satisfaction. The interviewed participants also emphasized the importance of education for patients. A study using focus-group interviews with nurses reported that a patient-centered culture was important to improving the quality of nursing care [26]. The empowerment of families and nursing staff in decision making had positive effects on their perceptions of service quality in nursing homes [32]. A Korean study also reported that active social engagement of LTCH patients alleviated cognitive impairment, declines in ADLs, and depression [33]. Accordingly, the development of programs in which participation is encouraged should improve service quality and patient satisfaction. Given that patients of LTCHs are long-term residents, their active participation in hospital programs should have positive effects on their health through their positive exchanges with others.
- The limitations of this research are as follows. First, this is a cross-sectional study based on data concerning events that occurred during a fixed period, and were measured at a fixed point in time. Second, this research utilizes secondary data provided by the HIRA, which might be limited in the diversity of factors related to the service quality of LTCHs. Additional semi-structured interviews with relevant medical personnel who can suggest realistic political methods for managing healthcare quality should be conducted to complement the secondary data.
- This study found that LTCHs with a higher installation rate of patient-safety- and hygiene-related facilities and longer-tenured staff members, especially nurses, were more likely to have better quality of care. The capacity of nurses working in LTCHs needs to be developed through “collaborative learning” in a learning environment that increases their responsibility for and decisions about patient safety. Thus, health-care quality can be improved through the enhancement of job skills of medical personnel through clinical education and patient-education programs that value patients’ participation, and the establishment of positive relationships between nursing staff and patients given the long-term residency of LTCH patients. Further research using longitudinal data on the healthcare industry’s services for older adults is needed. There is also a need to develop structured interviews to assess various health-care quality factors to improve the reliability and validity of such metrics.
DISCUSSION
-
Acknowledgements
- This study was supported by the Health Fellowship Foundation in 2013.
ACKNOWLEDGMENTS
-
CONFLICTS OF INTEREST
No potential conflict of interest relevant to this article was reported.
Article information
- 1. Korea Statistical Information Service (KOSIS). Estimated future population: 2015–2065. Daejeon: KOSIS; 2016.
- 2. Health Insurance Review and Assessment Service (HIRA). 2014 National Health Insurance Statistical Yearbook. Wonju: HIRA, National Health Insurance Service; 2015.
- 3. Kim YB. A study on evaluation and improvement of long-term care hospitals for chaning long-term care hospital fee system. Korean J Health Serv Manag 2011;5:105−17. https://doi.org/10.12811/kshsm.2011.5.2.105. PMID: 10.12811/kshsm.2011.5.2.105.Article
- 4. DeLellis NO, Ozcan YA. Quality outcomes among efficient and inefficient nursing homes: a national study. Health Care Manage Rev 2013;38:156−65. https://doi.org/.1097/HMR.0b013e31824bec38. PMID: 10.1097/HMR.0b013e31824bec38. PMID: 22395294.ArticlePubMed
- 5. Garavaglia G, Lettieri E, Agasisti T, et al. Efficiency and quality of care in nursing homes: an Italian case study. Health Care Manag Sci 2011;14:22−35. https://doi.org/10.1007/s10729-010-9139-2. PMID: 10.1007/s10729-010-9139-2. PMID: 20922483.ArticlePubMed
- 6. Nayar P, Ozcan YA, Yu F, et al. Benchmarking urban acute care hospitals: efficiency and quality perspectives. Health Care Manage Rev 2013;38:137−45. https://doi.org/10.1097/HMR.0b013e3182527a4c. PMID: 10.1097/HMR.0b013e3182527a4c. PMID: 22469911.ArticlePubMed
- 7. Berta W, Laporte A, Kachan N. Unpacking the relationship between operational efficiency and quality of care in Ontario long-term care homes. Can J Aging 2010;29:543−56. https://doi.org/10.1017/S0714980810000553. PMID: 10.1017/S0714980810000553. PMID: 21134304.ArticlePubMed
- 8. Zúñiga F, Ausserhofer D, Hamers JP, et al. Are staffing, work environment, work stressors, and rationing of care related to care workers’ perception of quality of care? A cross-sectional study. J Am Med Dir Assoc 2015;16:860−6. https://doi.org/10.1016/j.jamda.2015.04.012. PMID: 10.1016/j.jamda.2015.04.012. PMID: 26027721.ArticlePubMed
- 9. Shimshak DG, Lenard ML, Klimberg RK. Incorporating quality into data envelopment analysis of nursing home performance: a case study. Omega 2009;37:672−85. https://doi.org/10.1016/j.omega.2008.05.004. PMID: 10.1016/j.omega.2008.05.004. PMID: 20161166.ArticlePubMedPMC
- 10. Flynn L, Liang Y, Dickson GL, et al. Effects of nursing practice environments on quality outcomes in nursing homes. J Am Geriatr Soc 2010;58:2401−6. https://doi.org/10.1111/j.1532-5415.2010.03162.x. PMID: 10.1111/j.1532-5415.2010.03162.x. PMID: 21054327.ArticlePubMedPMC
- 11. Keays S, Wister AV, Gutman GM. Administrators and quality of care in long-term care facilities. J Hous Elderly 2009;23:243−60. https://doi.org/10.1080/02763890903035621. PMID: 10.1080/02763890903035621.Article
- 12. Needleman J, Buerhaus P, Mattke S, et al. Nurse-staffing levels and the quality of care in hospitals. N Engl J Med 2002;346:1715−22. https://doi.org/10.1056/NEJMsa012247. PMID: 10.1056/NEJMsa012247. PMID: 12037152.ArticlePubMed
- 13. Shin JH, Hyun TK. Nurse staffing and quality of care of nursing home residents in Korea. J Nurs Scholarsh 2015;47:555−64. https://doi.org/10.1111/jnu. PMID: 10.1111/jnu.12166. PMID: 26467903.ArticlePubMed
- 14. Doyle L. Mixed methods. Edited by Henly SJ: Routledge international handbook of advanced quantitative methods in nursing research. London: Routledge; 2015. pp 411−22.
- 15. Reed FM, Fitzgerald L, Rae M. Mixing methodology, nursing theory and research design for a practice model of district nursing advocacy. Nurse Res 2016;23:37−41. https://doi.org/10.7748/nr.23.3.37.s8. PMID: 10.7748/nr.23.3.37.s8. PMID: 26793986.Article
- 16. Health Insurance Review and Assessment Service (HIRA). 2012 propriety assessment of long term care. Wonju: HIRA; 2013.
- 17. Charnes A, Cooper WW, Rhodes E. Measuring the efficiency of decision making units. Eur J Oper Res 1978;2:429−44. https://doi.org/10.1016/0377-2217(78)90138-8. PMID: 10.1016/0377-2217(78)90138-8.Article
- 18. Duffy JAM, Fitzsimmons JA, Jain N. Identifying and studying “best-performing” services: an application of DEA to long-term care. Benchmark Int J 2006;13:232−51. https://doi.org/10.1108/14635770610668767. PMID: 10.1108/14635770610668767.Article
- 19. Cooper WW, Seiford LM, Zhu J. Data envelopment analysis: history, models, and interpretations. Edited by Cooper WW, Seiford LM, Zhu J: Handbook on data envelopment analysis. 2nd ed. Boston: Springer; 2011. pp 1−40.Article
- 20. Donabedian A. Quality assessment and assurance: unity of purpose, diversity of means. Inquiry 1988;25:173−92. PMID: 2966122.PubMed
- 21. Pangman VC, Sloan J, Guse L. An examination of psychometric properties of the mini-mental state examination and the standardized mini-mental state examination: implications for clinical practice. Appl Nurs Res 2000;13:209−13. https://doi.org/10.1053/apnr.2000.9231. PMID: 10.1053/apnr.2000.9231. PMID: 11078787.ArticlePubMed
- 22. Miedema K. Standardization of HbA1c and optimal range of monitoring. Scand J Clin Lab Invest Suppl 2005;240:61−72. https://doi.org/10.1080/00365510500236143. PMID: 10.1080/00365510500236143. PMID: 16112961.ArticlePubMed
- 23. Amemiya T. Tobit models: a survey. J Econom 1984;24:3−61. https://doi.org/10.1016/0304-4076(84)90074-5. PMID: 10.1016/0304-4076(84)90074-5.Article
- 24. Srivastava P, Hopwood N. A practical iterative framework for qualitative data analysis. Int J Qual Methods 2009;8:76−84. https://doi.org/10.1177/160940690900800107. PMID: 10.1177/160940690900800107.Article
- 25. Hutt E, Reznickova N, Morgenstern N, et al. Improving care for nursing home-acquired pneumonia in a managed care environment. Am J Manag Care 2004;10:681−6. PMID: 15521159.PubMed
- 26. Kieft RA, de Brouwer BB, Francke AL, et al. How nurses and their work environment affect patient experiences of the quality of care: a qualitative study. BMC Health Serv Res 2014;14:249https://doi.org/10.1186/1472-6963-14-249. PMID: 10.1186/1472-6963-14-249. PMID: 24923663.ArticlePubMedPMC
- 27. Hurtado DA, Berkman LF, Buxton OM, et al. Schedule control and nursing home quality: exploratory evidence of a psychosocial predictor of resident care. J Appl Gerontol 2016;35:244−53. https://doi.org/10.1177/0733464814546895. PMID: 10.1177/0733464814546895. PMID: 25186313.ArticlePubMed
- 28. Bishop CE. High-performance workplace practices in nursing homes: an economic perspective. Gerontologist 2014;54( Suppl 1). S46−52. https://doi.org/10.1093/geront/gnt163. PMID: 10.1093/geront/gnt163. PMID: 24443605.ArticlePubMed
- 29. Foster AD, Lee YS. Staffing subsidies and the quality of care in nursing homes. J Health Econ 2015;41:133−47. https://doi.org/10.1016/j.jhealeco.2015.02.002. PMID: 10.1016/j.jhealeco.2015.02.002. PMID: 25814437.ArticlePubMedPMC
- 30. Enquist B. Management lessons from mayo clinic. J Serv Manag 2009;20:246−8. https://doi.org/10.1108/09564230910952807. PMID: 10.1108/09564230910952807.Article
- 31. Temkin-Greener H, Cai S, Zheng NT, et al. Nursing home work environment and the risk of pressure ulcers and incontinence. Health Serv Res 2012;47:1179−200. https://doi.org/10.1111/j.1475-6773.2011.01353.x. PMID: 10.1111/j.1475-6773.2011.01353.x. PMID: 22098384.ArticlePubMed
- 32. Hamann DJ. Does empowering resident families or nursing home employees in decision making improve service quality? J Appl Gerontol 2014;33:603−23. https://doi.org/10.1177/0733464813508650. PMID: 10.1177/0733464813508650. PMID: 24652909.ArticlePubMed
- 33. Kang H. Correlates of social engagement in nursing home residents with dementia. Asian Nurs Res (Korean Soc Nurs Sci) 2012;6:75−81. https://doi.org/10.1016/j.anr.2012.05.006. PMID: 10.1016/j.anr.2012.05.006. PMID: 25030831.ArticlePubMed
REFERENCES
Figure 1
The research model.
DEA, data envelopment analysis; MMSE, Mini-Mental State Examination; HbA1c, glycated hemoglobin A1c; ADL, activities of daily living.
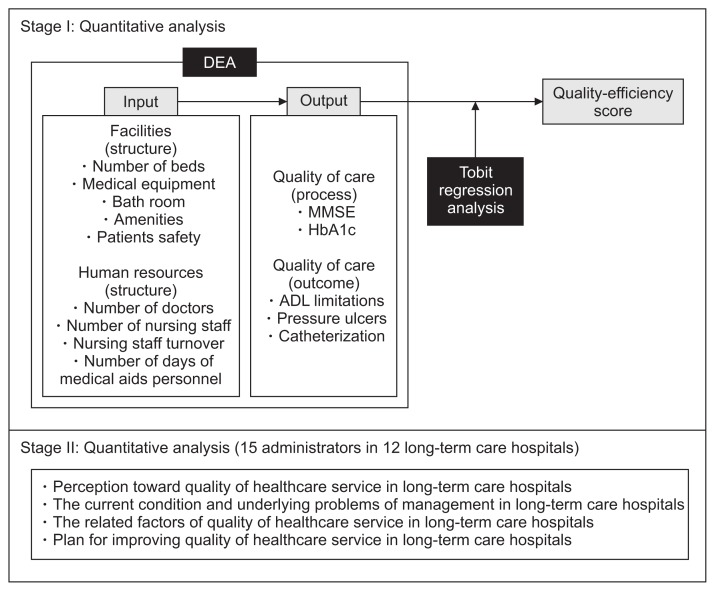
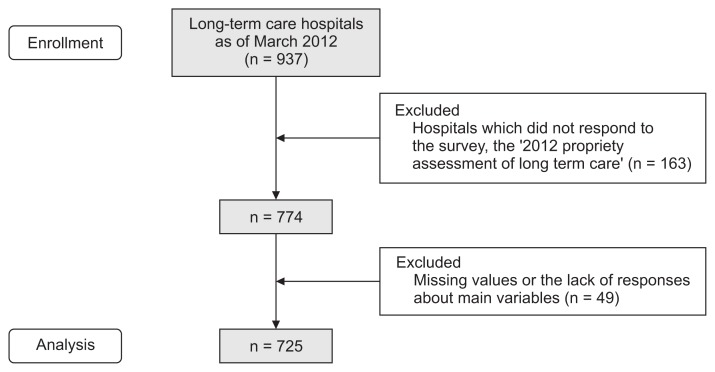
Table 1Characteristics of the long-term care hospitals (LTCHs) (n = 725)
Table 2The input and output variables in the data envelopment analysis (n = 725)
Table 3Factors related to the quality-efficiency scores of the long-term care hospitals (n = 725)
Figure & Data
References
Citations
Citations to this article as recorded by 
- Improving Preparedness for and Response to Coronavirus Disease 19 (COVID-19) in Long-Term Care Hospitals in Korea
Tark Kim
Infection & Chemotherapy.2020; 52(2): 133. CrossRef - Identifying Potentially Avoidable Emergency Department Visits of Long-Term Care Hospital Residents in Korea: A Multicenter Retrospective Cohort Study
Keon Kim, Dong Hoon Lee, Ho Young Yune, Jung Hee Wee, Duk Ho Kim, Eui Chung Kim, Jee Yong Lim, Seung Pil Choi
BioMed Research International.2019; 2019: 1. CrossRef
 PubReader
 Cite
Cite

