Articles
- Page Path
- HOME > Osong Public Health Res Perspect > Volume 13(6); 2022 > Article
-
Original Article
Time-series comparison of COVID-19 case fatality rates across 21 countries with adjustment for multiple covariates -
Yongmoon Kim
 , Bryan Inho Kim, Sangwoo Tak
 -
Osong Public Health and Research Perspectives 2022;13(6):424-434.
DOI: https://doi.org/10.24171/j.phrp.2022.0212
Published online: November 28, 2022
Division of Risk Assessment, Bureau of Public Health Emergency Preparedness, Korea Disease Control and Prevention Agency, Cheongju, Korea
- Corresponding author: Yongmoon Kim Division of Risk Assessment, Bureau of Public Health Emergency Preparedness, Korea Disease Control and Prevention Agency, 187 Osongsaengmyeong 2-ro, Osong-eup, Heungdeok-gu, Cheongju 28159, Korea E-mail: diget0329@korea.kr
© 2022 Korea Disease Control and Prevention Agency.
This is an open access article under the CC BY-NC-ND license (http://creativecommons.org/licenses/by-nc-nd/4.0/).
Abstract
-
Objectives
- Although it is widely used as a measure for mortality, the case fatality rate (CFR) of coronavirus disease 2019 (COVID-19) can vary over time and fluctuate for many reasons other than viral characteristics. To compare the CFRs of different countries in equal measure, we estimated comparable CFRs after adjusting for multiple covariates and examined the main factors that contributed to variability in the CFRs among 21 countries.
-
Methods
- For statistical analysis, time-series cross-sectional data were collected from Our World in Data, CoVariants.org, and GISAID. Biweekly CFRs of COVID-19 were estimated by pooled generalized linear squares regression models for the panel data. Covariates included the predominant virus variant, reproduction rate, vaccination, national economic status, hospital beds, diabetes prevalence, and population share of individuals older than age 65. In total, 21 countries were eligible for analysis.
-
Results
- Adjustment for covariates reduced variation in the CFRs of COVID-19 across countries and over time. Regression results showed that the dominant spread of the Omicron variant, reproduction rate, and vaccination were associated with lower country-level CFRs, whereas age, the extreme poverty rate, and diabetes prevalence were associated with higher country-level CFRs.
-
Conclusion
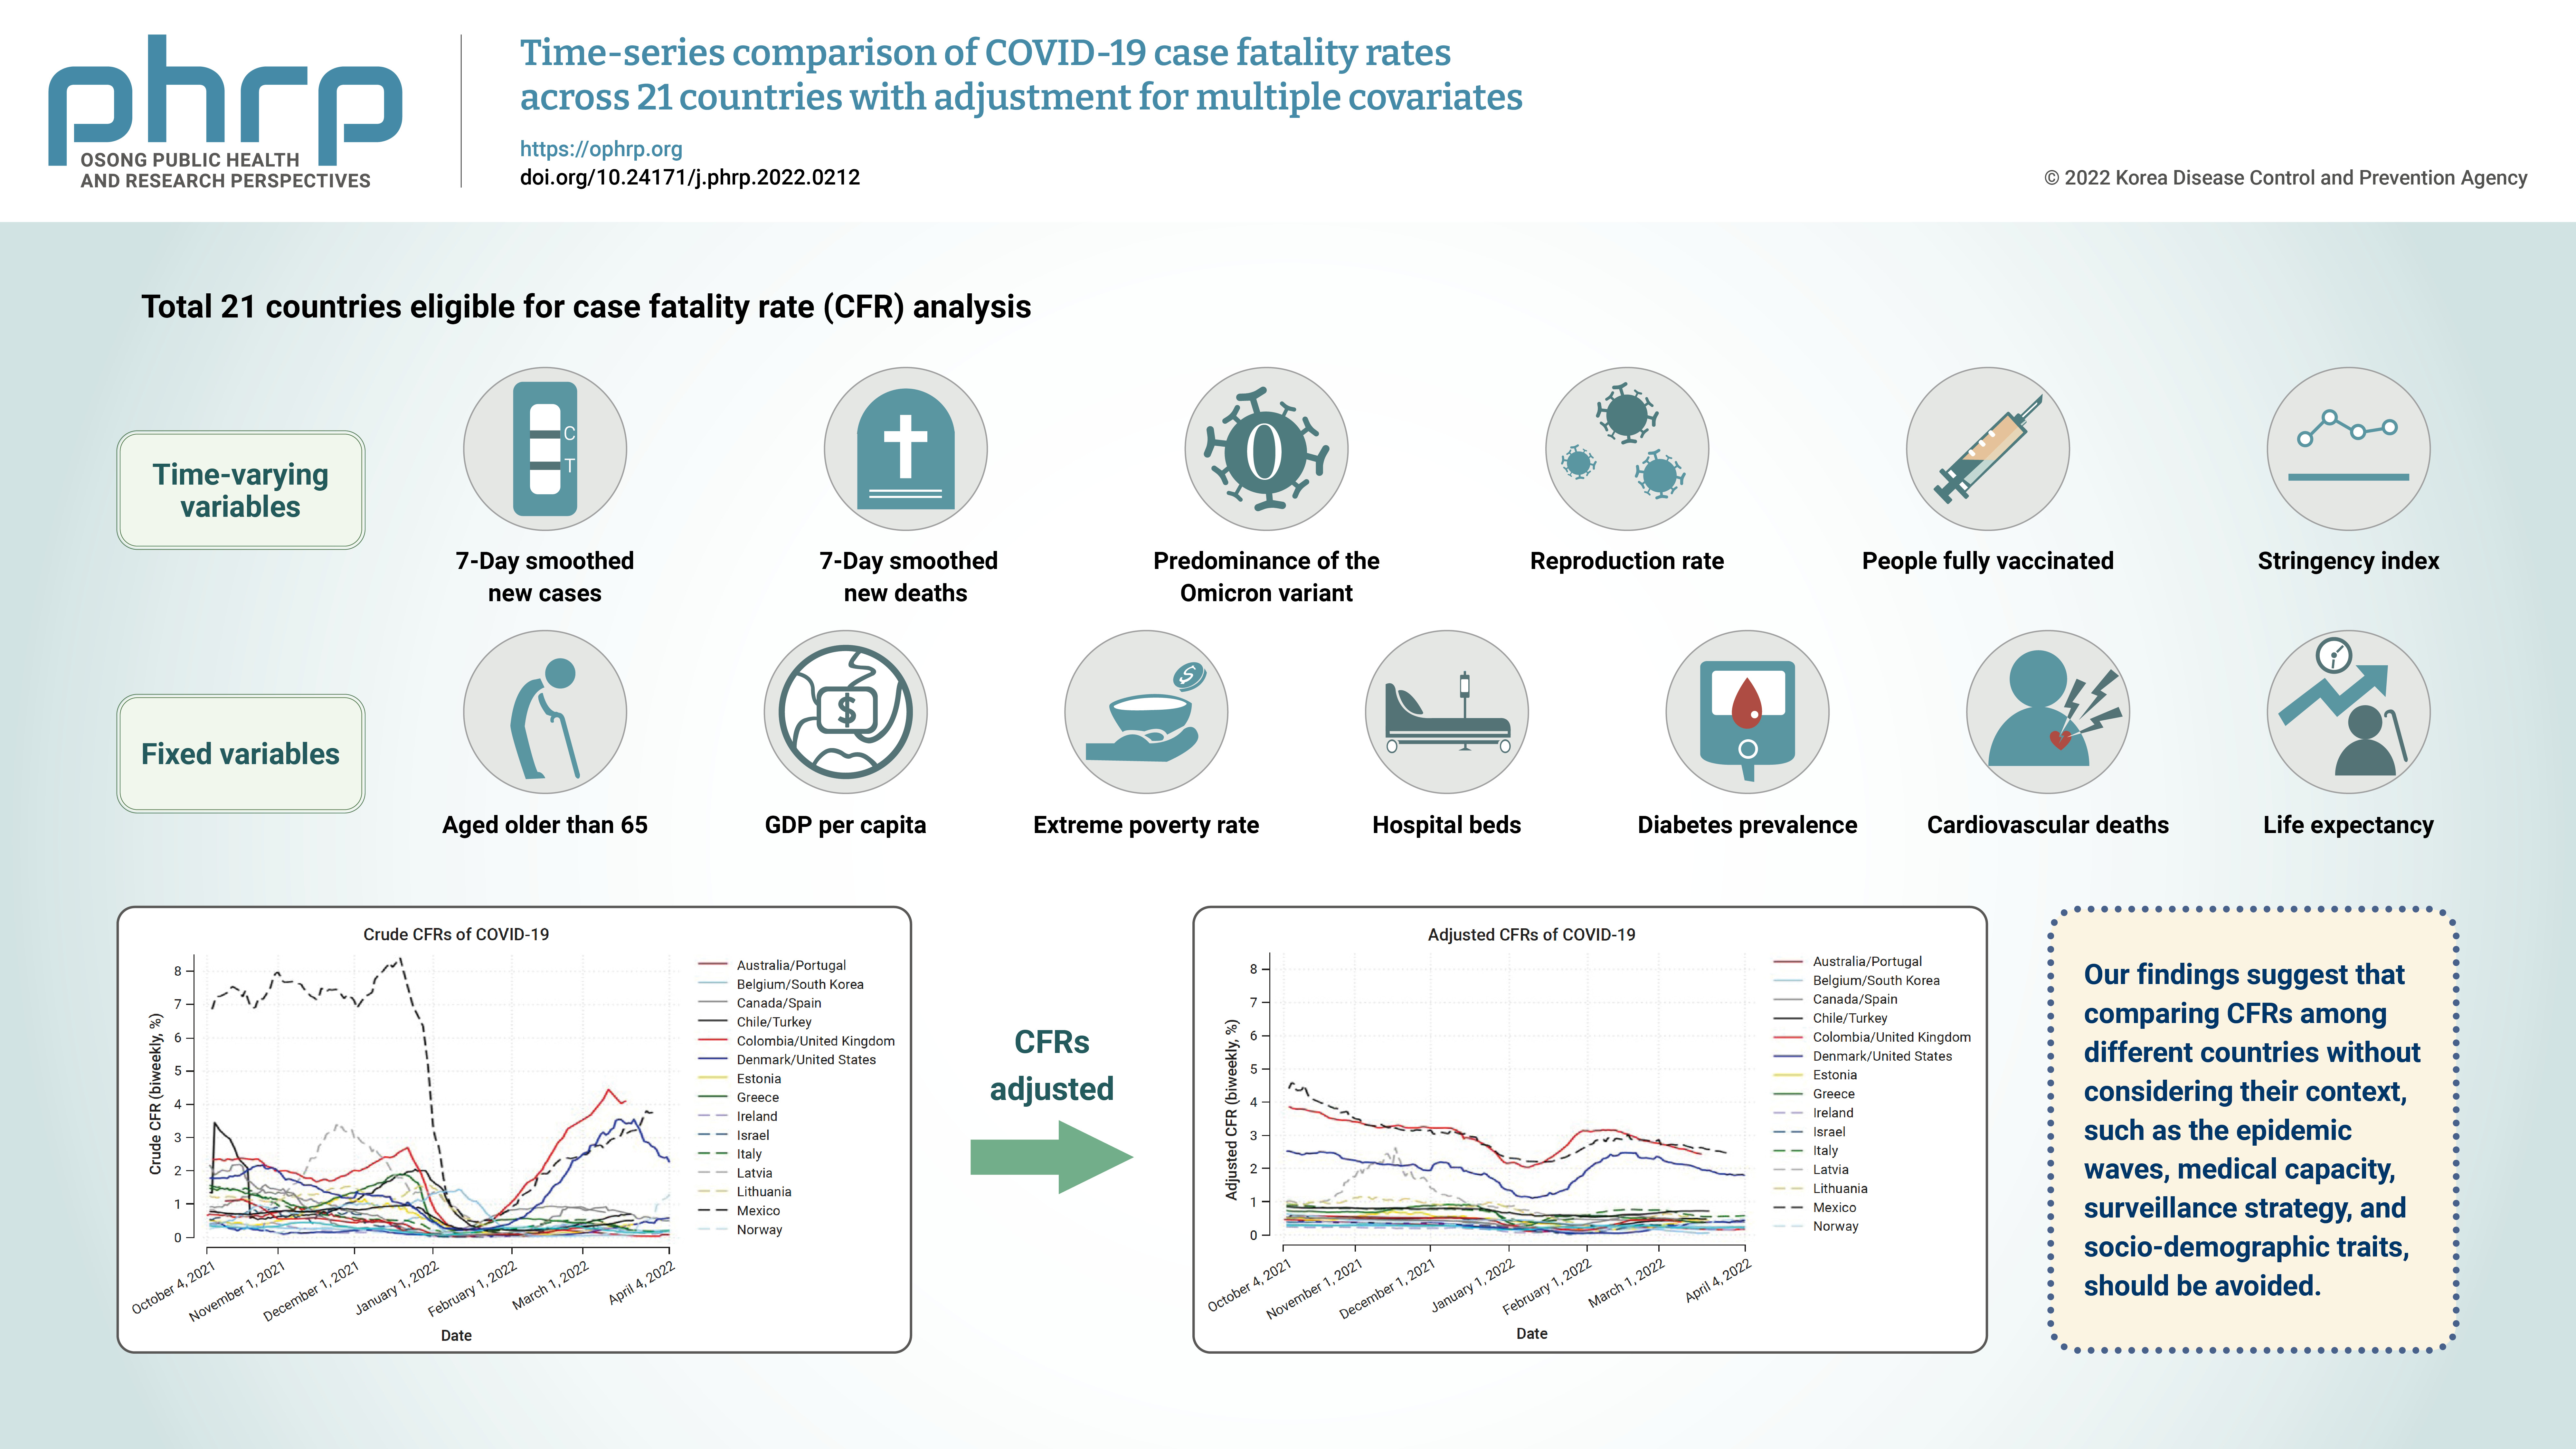
- A direct comparison of crude CFRs among countries may be fallacious, especially in a cross-sectional analysis. Our study presents an adjusted comparison of CFRs over time for a more proper comparison. In addition, our findings suggest that comparing CFRs among different countries without considering their context, such as the epidemic phase, medical capacity, surveillance strategy, and socio-demographic traits, should be avoided.
- Since the pandemic of coronavirus disease 2019 (COVID-19) started in December 2019, mortality due to severe acute respiratory syndrome coronavirus 2 (SARS-CoV-2), the viral agent that causes COVID-19, has been a matter of concern. In the early days of the pandemic, questions were raised regarding the severity of COVID-19 infection and whether COVID-19 is more severe than other existing respiratory ailments, such as seasonal influenza, SARS or Middle East respiratory syndrome (MERS), in terms of mortality [1].
- The case fatality rate (CFR) is one of the main measures used to calculate the mortality risk of COVID-19. The estimated CFR of COVID-19 is reported lower than those of Ebola, SARS, and MERS, but still reportedhigher than that of the seasonal flu [2–4].
- However, it has been pointed out that the CFR does not fully reflect the risk of dying from COVID-19 [5]. This is because the CFR changes not only due to biological characteristics of the virus, but also due to particular aspects of the context, such as environmental, social, and individual risk factors, as well as potential biases related to the surveillance strategy.
- The confounding issues of the CFR become even more critical when comparing CFRs among different countries. In many cases, CFRs are not compared in equal measure considering multiple covariates; these misleading results could lead to a faulty risk assessment and scientifically unsupported decisions by public health agencies in urgent public health emergencies. Therefore, when comparing CFRs among different countries, it is important to take multiple covariates into account to examine whether differences in CFRs among countries simply reflect a probabilistic phenomenon caused by chance or are a consequence of different levels of underlying conditions or response capabilities across countries.
- Some prior studies have compared CFRs with adjustments for well-known covariates. The most common method of estimating the CFR has been through meta-analyses pooling various individual studies to estimate the CFR [6–9]. Although this approach succeeded in identifying some possible confounding factors, it could not take into account multiple covariates at the same time.
- To complement the limitations of meta-analyses, several studies have estimated the CFR using a regression model to consider multiple risk factors and confounders. However, these studies were conducted using cross-sectional data [10] or for intra-country comparisons rather than inter-country comparisons [11]. Other research using time-series cross-sectional data appears to have underestimated the impact of autocorrelation and heteroscedasticity [12,13] or could not control for the effect of SARS-CoV-2 variants, especially during the emergence of the Delta and Omicron variants [14].
- Based on prior studies, this study conducted a panel data analysis using time-series cross-sectional data to address 2 main objectives: (1) to estimate comparable CFRs adjusted for country-level multiple covariates, and (2) to examine potential factors that cause variation in the CFR among countries after adjustment for multiple covariates.
Introduction
- Data Collection
- COVID-19-related data were collected from the Our World in Data, an open-source resource on COVID-19 data [15]. This database provides overall information on COVID-19 in each country, including the number of daily cases and deaths, the percentage of vaccinated people, the number of tests, and several characteristics of each country, including the gross domestic product (GDP) per capita, median age, extreme poverty, and number of hospital beds. Among all available countries in the database, we selected 38 countries in the Organisation for Economic Co-operation and Development (OECD) because they had more available data than non-OECD countries. In addition, by focusing on OECD countries, we aimed to compare countries with similar socio-economic conditions.
- To examine the effect of SARS-CoV-2 variants on the CFR, the proportion of the Delta and Omicron variants for each country was collected. We collected this data from CoVariants.org, whose original data were derived from GISAID [16,17]. This provided proportions of each variant at 2-week intervals at the country level. Among all time periods since the emergence of COVID-19, we only selected data for the 28 weeks between September 20, 2021 and April 4, 2022 in order to measure the effect of COVID-19 variants on the CFR. The selected time period was a transition period from the predominance of the Delta variant to the predominance of the Omicron variant (BA.1 and BA.2), enabling an analysis of the effects of COVID-19 variants on the CFR.
- For statistical analysis, data from Our World in Data and data from CoVariants.org were merged. After the exclusion of some countries due to missing values, 21 of the 38 OECD countries were selected for the final analysis: Australia, Belgium, Canada, Chile, Colombia, Denmark, Estonia, Greece, Ireland, Israel, Italy, Latvia, Lithuania, Mexico, Norway, Portugal, South Korea, Spain, Turkey, United Kingdom, and the United States. While most countries included in the final analysis had 196 days of observations (from September 20, 2021 to April 4, 2022), some countries had fewer than 196 days of observations due to missing data.
- This study did not need approval from the Institutional Review Board or an informed consent procedure because we used country-level open-source data without any individual information.
- Statistical Analysis
- As the dataset was in a time-series cross-sectional format, we applied panel data regression to estimate the CFRs. The natural logarithm of the biweekly CFR was used as the response (dependent) variable. The biweekly CFR was calculated by dividing the sum of new deaths in the preceding 2 weeks by the sum of new cases in the preceding 2 weeks. There were 2 reasons to use the biweekly CFR as a response variable instead of the daily CFR. First, smoothing the daily CFR across 14 days can provide more information about overall trends in the CFR by reducing daily variance due to differences in the number of tests between weekdays and weekends. Second, the biweekly CFR can reflect the time lag between infection and death by COVID-19, unlike the daily CFR. In the final regression model, we used the natural logarithm of the biweekly CFR to address the problem of distribution.
- Country-level variables known to be associated with the CFR were included in the final regression model, including the predominance of the Omicron variant, population share of vaccinated people, population share of individuals older than age 65, diabetes prevalence, and cardiovascular deaths. These variables were measured at the country level and retained in our final regression model [18–27]. Additional variables included 7-day smoothed numbers of newly confirmed cases and deaths per million, the reproduction rate, the stringency index, natural logarithm of GDP per capita, the extreme poverty rate, hospital beds per thousand, and life expectancy [28–31].
- The predominance of the Omicron variant was included after creating a dummy variable for the share of the Omicron variant as 0 or 1, based on the proportion of the variants. If the Delta variant proportion was greater than 50%, the dummy variable was 0. If the Omicron variant proportion was higher than 50%, the dummy variable was 1.
- Fixed- or random-effects models are commonly used for panel data regression because of the permanent error term induced by unobserved characteristics of the panel group. Fixed- and random-effects models can be effective estimators only when there is no autocorrelation in the error term. However, the Wooldridge test [32] detected first-order autocorrelation in the error term. In addition, when first-order autocorrelation was considered in the regression model, there was no need to consider the permanent error term induced by unobserved characteristics of the country. Additionally, the modified Wald test detected group-wise heteroscedasticity in the regression model. Therefore, we used a pooled feasible generalized least squares (GLS) model that assumed heteroscedasticity and first-order autocorrelation of the error term instead of fixed- and random-effects models.
- We formulated 4 regression models. Model 1 was a baseline model including all research variables except 7-day smoothed cases and deaths per million. Models 2 and 3 were mediation models to measure the mediation effects of cases and deaths on the CFR. In model 2, we added 7-day smoothed new cases per million as a mediation variable to model 1, and in model 3, we added 7-day smoothed new deaths per million to model 1. Lastly, model 4 was a full model with the simultaneous addition of both 7-day smoothed new cases per million and 7-day smoothed new deaths per million added to model 1 at the same time. All panel analysis was conducted using Stata ver. 16.1 SE (StataCorp LLC, College Station, TX, USA).
Materials and Methods
- Descriptive Statistics
- Table 1 shows descriptive statistics for all variables included in the final regression models. The variables can be categorized as time-varying and fixed variables. The time-varying variables included the biweekly CFR, 7-day smoothed new cases and deaths, share of the Omicron variant, reproduction rate, percentage of fully vaccinated people, and stringency index over time.
- The mean of the biweekly CFR was 0.79, and the median was 0.42. The biweekly CFR of all countries showed a right-skewed distribution with large variance, ranging from 0.01 to 8.41. The average number of new cases and the number of new deaths per million were smoothed over 7 days. New deaths refer to the number of deaths attributed to COVID-19. The variables for cases and deaths showed a right-skewed distribution with large maximum values compared to their means.
- The mean proportion of the Omicron variant was 52%, since the study period reflected the transition period from the Delta variant to the Omicron variant. Full vaccination was defined as having received all recommended doses were received (usually 3 times). The mean proportion of fully vaccinated people over the study period was 70.9%. The proportion of fully vaccinated people steadily increased and exceeded 60% in all countries in the middle of February 2022.
- The stringency index referred to the COVID-19 response stringency of each country based on 9 indicators including school closures, workplace closures, and travel bans. The scores were transformed and rescaled from 0 to 100; a closer score to 100 indicated a more stringent response [33].
- Unlike time-varying variables, fixed variables had constant values throughout the entire research period. GDP per capita before transformation to its natural logarithm ranged from 13,254 to 67,335 in constant 2011 international dollars. The extreme poverty rate was defined as share of the population living in extreme poverty (less than 10% of the national average income per person) in the most recent year available since 2010. Diabetes prevalence was the percentage of people diagnosed with diabetes among all aged 20 to 79, and cardiovascular deaths referred to the annual number of deaths by cardiovascular disease per 100,000 people in 2017, which was the most recent data available. Life expectancy was the expected lifespan at birth in 2019.
- Adjusted CFRs for Each Country
- Table 2 shows the mean of the crude biweekly CFRs and adjusted CFRs for individual countries. The adjusted CFRs were computed from regression model 4 (Table 3), which included all possible covariates in this study. The overall CFR, along with each country's CFR, is reported as a percentage and listed in descending order of the adjusted CFRs.
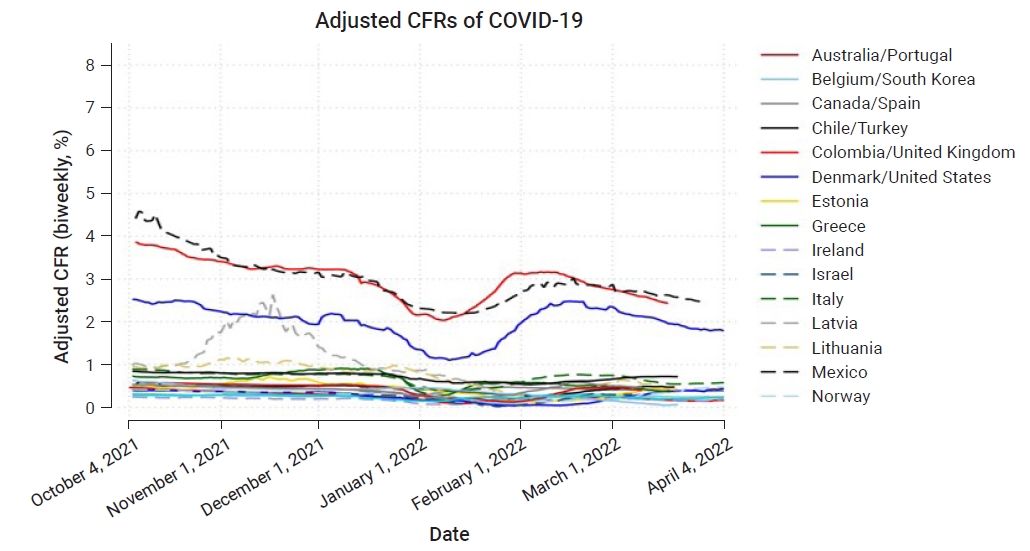
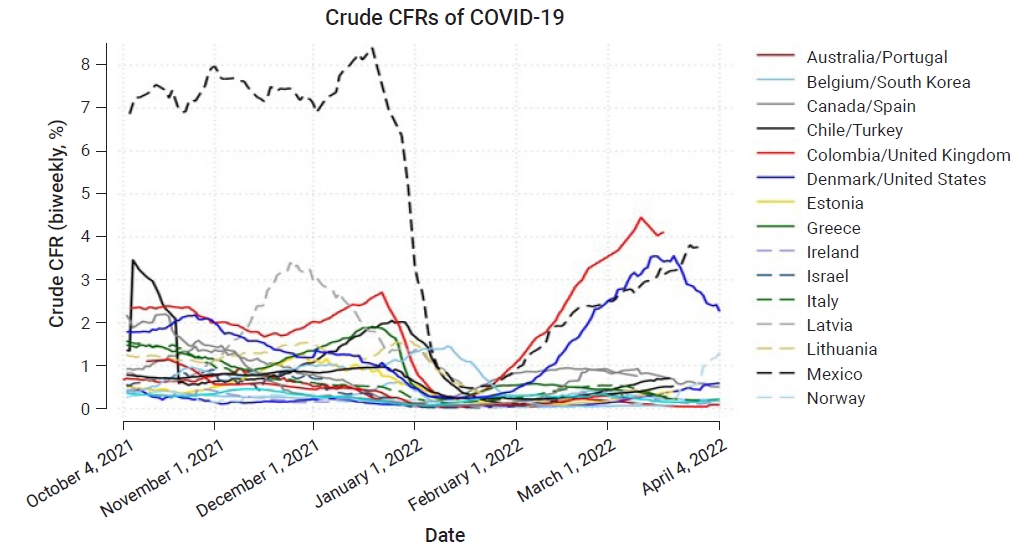
- Compared to crude CFRs, the variance of the adjusted CFRs was much smaller. The range between minimum and maximum values decreased from 8.40 to 4.58 after adjustment. The variance of the CFRs of individual countries also decreased after adjustment. The overall decreases in the variance and daily fluctuations after adjustment can be seen in Figures 1 and 2.
- The variance in CFRs among countries was reduced, as shown by comparing a graph of the adjusted CFRs to the crude CFRs. Fluctuations in the adjusted CFRs throughout the entire time period in individual countries are much smaller compared to crude CFRs. As a result, compared to the graph of crude CFRs in Figure 1, the lines of the adjusted CFRs in Figure 2 are more smoothed.
- The adjusted CFRs of most countries were below 1%, except for the top 3 ranked countries: Colombia, Mexico, and the United States (Table 2; Figure 2). These 3 countries showed higher CFRs than the other countries during the entire study period. Thus, the overall high CFRs of 3 countries may have been mainly due to the baseline effects of fixed variables (i.e., the country’s characteristics).
- Latvia was ranked fourth place in the average adjusted CFR, but demonstrated a different pattern over time compared to Colombia, Mexico, and the United States (Table 2; Figure 2). Whereas the adjusted CFRs of Colombia, Mexico, and the United States were already high in October 2021, and maintained their high levels through April 2022, Latvia (represented as a gray dashed line in Figure 2) started with an estimated CFR of about 1%. Latvia’s adjusted CFR soared to about 2.5% until mid-November 2021, and then decreased to below 1% around January 2022. Therefore, compared to Colombia, Mexico, and the United States, this fluctuation in the adjusted CFR over time in Latvia could have mainly been driven by time-varying variables, not by Latvia’s specific characteristics.
- Effects of Factors on Differences in the Estimated CFRs
- Table 3 shows the results of the pooled GLS analysis of our panel data. Marginal changes in the biweekly CFR (converted from a natural logarithm by exponential transformation) in percentages by single-unit increases in independent variables are reported in the right column of coefficients in model 4 (Table 3). As time-varying variables, the predominance of the Omicron variant (>50% of the total variant share), reproduction rate, and proportion of fully vaccinated people significantly lowered the biweekly CFR (p<0.001).
- In model 2, the coefficients of the predominance of the Omicron variant and reproduction rate were reduced compared to model 1 once the variable for 7-day smoothed new cases per million was added. The mediation effect of 7-day smoothed new deaths per million was much smaller in model 3 than for the corresponding variable in model 2. Given the meaning of the reproduction rate and the high transmission of the Omicron variant, these results suggest that the predominance of the Omicron variant and a high reproduction rate reduced the CFR by increasing the number of new cases. Meanwhile, the proportion of fully vaccinated people significantly reduced the CFR in all models, with statistical significance (p<0.05), as has been observed in previous studies [34–37].
- Among the fixed variables, only 4 variables demonstrated a significant effect at the p<0.05 level on the CFR: the proportion of individuals older than age 65, the share of the population living in extreme poverty, the number of hospital beds per thousand, and diabetes prevalence. These 4 factors were associated with an increased CFR, but the effect of the population share living in extreme poverty was particularly strong (a 173.15% increase in the CFR per unit increase of the proportion living in extreme poverty). Diabetes prevalence and age also contributed to the CFR. Single-unit increases in diabetes prevalence and the population share of people older than age 65 raised the CFR by 115.49% and 103.94%, respectively. In contrast, the effects of the stringency index, cardiovascular deaths, and life expectancy were not significantly associated with the CFR.
Results
- Previous studies have pointed out several factors associated with the CFR. First, the CFR could be distorted by selection biases. There is a high likelihood that mild and asymptomatic cases would not be counted as confirmed cases, resulting in an overestimation of the CFR by decreasing the denominator (number of cases), especially in some countries with low laboratory test access. The time lag between infection and confirmation, or between infection and death by COVID-19, could also influence the CFR. If infected cases are not counted as confirmed cases, this would overestimate the CFR [38]. In addition, the surveillance scheme of the country-wide reporting system, overall testing strategies, and an active screening program can cause biases in the CFR [39,40].
- Individual risk factors, such as comorbidities, or demographic factors, such as age, sex, and race within the study population, are known to affect the CFR [20,41–45]. Furthermore, national-level factors, such as preventive policies (including mask-wearing or quarantine measures), poverty, income, capacity for disease, and healthcare, could affect the CFR by altering the number of cases or number of deaths [9,11,29–31,46–48].
- In this analysis, we found that (1) CFRs adjusted by multiple covariates were less likely to vary over time and place, and (2) country-level CFRs were affected most by the following variables: the predominant variant at the time, the reproduction rate, vaccination, age, extreme poverty, and diabetes prevalence.
- The significant effects of the Omicron variant, reproduction rate, vaccination, and older age on the CFR reconfirmed previously reported results about COVID-19 [34–37,42,49–56]. It is thought that the prevalence of the Omicron variant and reproduction rate reduce the CFR by increasing the number of new cases. It is straightforward that a high reproduction rate lowers the CFR because more infections result in a larger denominator for the CFR. The Omicron variant (BA.1 and BA.2) is known to have higher transmissibility and has actually driven the global pandemic [52,53]. The inverse relationship of the reproduction rate and the Omicron variant with the CFR, since those factors increase the number of new cases, was identified by the mediation effect in model 1 and model 2 (Table 3). We found that the coefficient of the reproduction rate and the Omicron variant became much smaller after adding the variable for 7-day smoothed new cases per million in model 2.
- Older age has been repeatedly suggested as a factor that increases mortality from COVID-19 in most previous studies [8,23,42,56]. In that sense, our findings reconfirmed that a high proportion of elderly individuals is associated with an increased country-level CFR. We also found that vaccination robustly reduced the CFR. We hypothesize that vaccination affects the CFR by preventing severe cases and death, rather than by reducing new infections, because if the effect of vaccination on preventing new cases was much larger than its effects on preventing new deaths, the coefficient of vaccination would have been positive.
- Following our analysis of country-level characteristics that may affect the CFR, we found that the extreme poverty rate and diabetes prevalence remarkably increased CFR. The overall high CFR in the top 3 countries (Colombia, Mexico, United States) was primarily driven by high extreme poverty rates. The extreme poverty rates in the top 3 countries were in the 75th percentile or higher among all countries (4.5 in Colombia, 2.5 in Mexico, and 1.2 in United States, whereas the median extreme poverty rate among all analyzed countries was only 0.5).
- Although it is possible to overestimate the effect of extreme poverty due to its skewed distribution, the positive direction of the effect was robust in all regression models. Two hypotheses for why the extreme poverty rate has a positive effect on CFR can be suggested. First, it could be due to the differential inclusion of cases in the denominators. If individuals could not visit the hospital due to financial barriers, it would induce overestimation of the CFR because infections among the poor would not be counted as confirmed cases. Second, living in extreme poverty could raise the risk of death by COVID-19. For example, individuals living in extreme poverty might not be able to afford medical fees or might not be able to take sick leave from employment depending on their occupation. Comorbidities such as diabetes, possibly due to malnutrition or insufficient medical services, may also have played a role in this association.
- The baseline effect of diabetes prevalence on the CFR in Colombia, Mexico, and United States was significantly high. As with the extreme poverty rate, the diabetes prevalence in the top 3 countries was in the 75th percentile or above among all countries (7.44 in Colombia, 13.6 in Mexico, and 10.79 in the United States, whereas the median diabetes prevalence in all countries was 5.91). This finding is consistent with previous studies about the burden imposed by comorbidities in COVID-19 patients because diabetes has been repeatedly identified as a significant comorbidity that increases severity and mortality of COVID-19 [20,26,28,31,57].
- Meanwhile, it is notable that hospital beds per thousand showed a positive effect on the CFR. However, it would not be proper to interpret this result as meaning that more hospital beds for patients are “bad.” One possible explanation for this result could be selection bias, as more beds could enhance the detection of deaths at hospital beds. In the same way, it is not necessarily “good” that some variables reduced the CFR, because the CFR does not provide direct information about the biological characteristics of the virus.
- For example, as we have shown, the Omicron variant reduced the CFR because the growth rate of new cases caused by the Omicron variant was much higher than the growth rate of new deaths by the Omicron variant. However, it still needs to be carefully examined whether the lower CFR of the Omicron variant is a result of inflated new cases, or a signal that SARS-CoV-2 has changed into a less severe form of the virus that manifests fewer deaths for the same number of infections.
- Furthermore, as we noticed, it is very important to consider the theoretical path when interpreting the significance of the effects of included variables. Logically, given the definition of the CFR, there are only 2 possible paths to affect the CFR: through the number of cases or the number of deaths. A precise understanding of the effect of risk factors is only possible if we determine whether they affect the CFR through the number of cases or the number of deaths. For example, we have shown a mediation effect of cases in the relationship between the predominance of the Omicron variant and the CFR. However, this interpretation of the mediation effect is only possible if there are enough preceding studies and knowledge about the biological mechanisms underlying the path of the effect. Thus, one should take care not to interpret the mediation effect of fixed variables in Table 3 too impetuously.
- As we mentioned in the results, Latvia showed major fluctuations compared to countries such as Ireland, South Korea, Belgium, and Norway, where low CFRs were maintained steadily. The fluctuation in Latvia’s CFR was largely driven by the number of deaths in the preceding 2 weeks. Thus, more research is needed to clarify whether epidemic events, such as seasonal spread, mass gatherings, or spread in vulnerable facilities, affected the large increase in deaths by COVID-19 at a specific time point in Latvia.
- In conclusion, our findings suggested that the comparison of CFRs between multiple countries should consider the viral, immunological, medical, and social context of each country, as we observed significant effects of the predominant variant, reproduction rate, vaccination, age, poverty, and diabetes on the CFR. Therefore, when comparing CFRs of different countries, especially in contexts such as the epidemic phase, the medical capacity, surveillance strategy, and socio-demographic traits of the periods being compared should be considered, and one should be cautious when interpreting crude cross-sectional comparisons of CFRs.
- Two limitations of this study should be noted. First, there is a possibility of a false effect caused by unaccounted variables. Such variables could include environmental factors such as temperature, altitude, seasonality, and air pollution, or population-based factors such as population immunity, age-specific cases, and the proportion of people with health insurance [48]. Second, our study used only country-level data for analysis. To tease out a better estimate of country-level effects, a multi-level analysis with both individual and country-level data could be conducted. For example, it is well-known that comorbidities have a negative impact on an individual’s disease severity and risk of mortality by COVID-19. An analysis without individual-level data could mask the impact of disparities among subnational entities [47].
- Though our findings support a significant effect of some country-level variables on the CFR, further research is needed to examine whether these country-level characteristics, such as extreme poverty or medical capacity, may also affect the CFR by changing either the number of deaths or the number of cases. More covariates (e.g., seasonal and environmental factors) that might affect the CFR should be considered, and aggregating individual and country-level data would also be helpful for a multi-level analysis in the future.
Discussion
-
Ethics Approval
This study did not need approval from the Institutional Review Board or an informed consent procedure because we used country-level open-source data that did not include any individual information.
-
Conflicts of Interest
The authors have no conflicts of interest to declare.
-
Funding
None.
-
Availability of Data
The datasets generated and analyzed during the current study are available on the websites of Our World in Data (https://ourworldindata.org/coronavirus) and CoVariants.org (https://covariants.org).
-
Authors’ Contributions
Conceptualization: all authors; Data curation: YK; Formal analysis: YK; Investigation: YK; Methodology: all authors; Project administration: all authors; Supervision: BIK, ST; Visualization: YK; Writing–original draft: YK; Writing–review & editing: all authors.
Article information


| Country |
Crude CFRs (%) |
Adjusted CFRs (%)a) |
||||||
|---|---|---|---|---|---|---|---|---|
| Mean | Median | Minimum | Maximum | Mean | Median | Minimum | Maximum | |
| Colombia | 1.83 | 1.97 | 0.24 | 4.45 | 3.02 | 3.15 | 2.03 | 3.87 |
| Mexico | 4.35 | 3.27 | 0.47 | 8.41 | 2.96 | 2.87 | 2.19 | 4.59 |
| United States | 1.55 | 1.45 | 0.23 | 3.55 | 2.00 | 2.10 | 1.10 | 2.52 |
| Latvia | 1.56 | 1.36 | 0.27 | 3.40 | 1.23 | 1.01 | 0.38 | 2.63 |
| Lithuania | 0.91 | 1.15 | 0.16 | 1.57 | 0.75 | 0.85 | 0.26 | 1.16 |
| Turkey | 0.58 | 0.70 | 0.21 | 0.96 | 0.71 | 0.72 | 0.53 | 0.84 |
| Italy | 0.57 | 0.51 | 0.13 | 1.58 | 0.68 | 0.74 | 0.37 | 0.89 |
| Greece | 0.90 | 0.90 | 0.22 | 1.91 | 0.62 | 0.66 | 0.26 | 0.91 |
| Chile | 0.94 | 0.67 | 0.10 | 3.46 | 0.44 | 0.47 | 0.27 | 0.59 |
| Canada | 0.77 | 0.83 | 0.12 | 1.45 | 0.42 | 0.44 | 0.31 | 0.50 |
| Estonia | 0.49 | 0.41 | 0.06 | 1.26 | 0.42 | 0.46 | 0.11 | 0.72 |
| Spain | 0.68 | 0.36 | 0.06 | 2.20 | 0.42 | 0.44 | 0.20 | 0.58 |
| South Korea | 0.65 | 0.79 | 0.05 | 1.45 | 0.37 | 0.42 | 0.05 | 0.63 |
| Portugal | 0.25 | 0.22 | 0.06 | 1.14 | 0.36 | 0.40 | 0.13 | 0.58 |
| Norway | 0.21 | 0.17 | 0.02 | 1.30 | 0.30 | 0.33 | 0.12 | 0.48 |
| Israel | 0.37 | 0.32 | 0.01 | 0.91 | 0.26 | 0.30 | 0.01 | 0.40 |
| Australia | 0.34 | 0.22 | 0.03 | 0.94 | 0.26 | 0.25 | 0.08 | 0.46 |
| Denmark | 0.18 | 0.15 | 0.04 | 0.59 | 0.26 | 0.32 | 0.04 | 0.44 |
| Belgium | 0.28 | 0.27 | 0.05 | 0.63 | 0.26 | 0.27 | 0.09 | 0.36 |
| United Kingdom | 0.26 | 0.28 | 0.07 | 0.45 | 0.24 | 0.24 | 0.14 | 0.30 |
| Ireland | 0.21 | 0.21 | 0.02 | 0.47 | 0.18 | 0.19 | 0.06 | 0.24 |
Countries are arranged in descending order of mean of adjusted CFR.
CFR, case fatality rate; COVID-19, coronavirus disease 2019.
a) Adjusted for 7-day smoothed new cases (per million), 7-day smoothed new deaths (per million), the predominance of the Omicron variant, reproduction rate, people fully vaccinated (%), stringency index, people aged older than 65 (%), natural logarithm of gross domestic product per capita, extreme poverty rate (%), hospital beds (per thousand), diabetes prevalence (%), cardiovascular deaths (per 100,000), and life expectancy (years).
| Variable |
Model 1 |
Model 2 |
Model 3 |
Model 4 |
|
|---|---|---|---|---|---|
| Coef. | Coef. | Coef. | Coef. | Marginal effect (%)a) | |
| Time-varying variables | |||||
| 7-Day smoothed new cases (per million) | –0.0003*** | –0.0003*** | 99.97 | ||
| 7-Day smoothed new deaths (per million) | 0.0500*** | 0.0639*** | 106.60 | ||
| Predominance of the Omicron variant | –0.0737*** | –0.0596*** | –0.0703*** | –0.0532*** | 94.82 |
| Reproduction rate | –0.306*** | –0.256*** | –0.262*** | –0.186*** | 83.03 |
| People fully vaccinated (%) | –0.0182*** | –0.0096* | –0.0203*** | –0.0144** | 98.57 |
| Stringency index | 0.0001 | 0.0004 | –0.0002 | 0.0000 | 100.00 |
| Fixed variables | |||||
| People aged older than 65 (%) | 0.0307 | 0.0418* | 0.0338 | 0.0386* | 103.94 |
| Natural logarithm of GDP per capita | 0.282 | 0.552 | 0.412 | 0.506 | 165.86 |
| Extreme poverty rate (%) | 0.485*** | 0.565*** | 0.491*** | 0.549*** | 173.15 |
| Hospital beds (per thousands) | 0.0139 | 0.0593* | 0.0100 | 0.0567* | 105.83 |
| Diabetes prevalence (%) | 0.101** | 0.159*** | 0.110** | 0.144*** | 115.49 |
| Cardiovascular deaths (per 100,000) | 0.0024 | 0.0022 | 0.0006 | 0.0005 | 100.05 |
| Life expectancy (y) | –0.0503 | –0.0689 | –0.0704 | –0.0656 | 93.65 |
The dependent variable is the natural logarithm of the biweekly case fatality rate. Coefficients (coef.) are rounded up to the fourth digit after the decimal point.
GDP, gross domestic product.
a) Changes in the biweekly case fatality rate in percentage by single-unit increases in independent variables.
* p<0.05,
** p<0.01,
*** p<0.001.
- 1. Rajgor DD, Lee MH, Archuleta S, et al. The many estimates of the COVID-19 case fatality rate. Lancet Infect Dis 2020;20:776−7.ArticlePubMedPMC
- 2. Munster VJ, Koopmans M, van Doremalen N, et al. A novel coronavirus emerging in China: key questions for impact assessment. N Engl J Med 2020;382:692−4.ArticlePubMed
- 3. Centers for Disease Control and Prevention (CDC). Flu season: preliminary in-season burden estimates [Internet]. Atlanta: CDC; 2022 [cited 2022 May 11]. Available from: https://www.cdc.gov/flu/about/burden/preliminary-in-season-estimates.htm.
- 4. World Health Organization (WHO). Ebloa virus disease fact sheets [Internet]. Geneva: WHO; 2021 [cited 2022 May 11]. Available from: https://www.who.int/en/news-room/fact-sheets/detail/ebola-virus-disease.
- 5. Undela K, Gudi SK. Assumptions for disparities in case-fatality rates of coronavirus disease (COVID-19) across the globe. Eur Rev Med Pharmacol Sci 2020;24:5180−2.PubMed
- 6. Alimohamadi Y, Tola HH, Abbasi-Ghahramanloo A, et al. Case fatality rate of COVID-19: a systematic review and meta-analysis. J Prev Med Hyg 2021;62:E311−20.PubMedPMC
- 7. Karadag E. Increase in COVID-19 cases and case-fatality and case-recovery rates in Europe: a cross-temporal meta-analysis. J Med Virol 2020;92:1511−7.ArticlePubMedPMCPDF
- 8. Levin AT, Hanage WP, Owusu-Boaitey N, et al. Assessing the age specificity of infection fatality rates for COVID-19: systematic review, meta-analysis, and public policy implications. Eur J Epidemiol 2020;35:1123−38.ArticlePubMedPMCPDF
- 9. Velayati A, Dahale D, Dahlin A, et al. Understanding the differences in COVID-19 case fatality rates observed across Alabama counties. J Public Health Manag Pract 2021;27:305−9.ArticlePubMed
- 10. Peker EK, Bektemur G, Baydili KN, et al. Comparison of COVID-19 case-fatality-rates by socio-demographic factors. J Acad Res Med 2020;10:246−51.Article
- 11. Ahmed R, Williamson M, Hamid MA, et al. United States county-level COVID-19 death rates and case fatality rates vary by region and urban status. Healthcare (Basel) 2020;8:330. ArticlePubMedPMC
- 12. Terriau A, Albertini J, Montassier E, et al. Estimating the impact of virus testing strategies on the COVID-19 case fatality rate using fixed-effects models. Sci Rep 2021;11:21650. ArticlePubMedPMCPDF
- 13. Perone G. The determinants of COVID-19 case fatality rate (CFR) in the Italian regions and provinces: an analysis of environmental, demographic, and healthcare factors. Sci Total Environ 2021;755(Pt 1). 142523. ArticlePubMed
- 14. Sorci G, Faivre B, Morand S. Explaining among-country variation in COVID-19 case fatality rate. Sci Rep 2020;10:18909. ArticlePubMedPMCPDF
- 15. Our World in Data. Data on COVID-19 (coronavirus) by Our World in Data [Internet]. Our World in Data 2022 [cited 2022 May 11]. Available from: https://github.com/owid/covid-19-data/tree/master/public/data.
- 16. Emma B. Hodcroft CoVariants: SARS-CoV-2 Mutations and Variants of Interest; 2021 https://covariants.org/.
- 17. Khare S, et al. GISAID’s Role in Pandemic Response. China CDC Weekly 3:1049−1051.PubMedPMC
- 18. Fagard K, Gielen E, Deschodt M, et al. Risk factors for severe COVID-19 disease and death in patients aged 70 and over: a retrospective observational cohort study. Acta Clin Belg 2022;77:487−94.ArticlePubMed
- 19. Marschner IC. Estimating age-specific COVID-19 fatality risk and time to death by comparing population diagnosis and death patterns: Australian data. BMC Med Res Methodol 2021;21:126. ArticlePubMedPMCPDF
- 20. Ortega E, Corcoy R, Gratacos M, et al. Risk factors for severe outcomes in people with diabetes hospitalised for COVID-19: a cross-sectional database study. BMJ Open 2021;11:e051237.ArticlePubMed
- 21. Piskac Zivkovic N, Lucijanic M, Busic N, et al. The associations of age, sex, and comorbidities with survival of hospitalized patients with coronavirus disease 2019: data from 4014 patients from a tertiary-center registry. Croat Med J 2022;63:36−43.ArticlePubMedPMC
- 22. Harwood R, Yan H, Talawila Da Camara N, et al. Which children and young people are at higher risk of severe disease and death after hospitalisation with SARS-CoV-2 infection in children and young people: a systematic review and individual patient meta-analysis. EClinicalMedicine 2022;44:101287. ArticlePubMedPMC
- 23. Hong D, Lee S, Choi YJ, et al. The age-standardized incidence, mortality, and case fatality rates of COVID-19 in 79 countries: a cross-sectional comparison and their correlations with associated factors. Epidemiol Health 2021;43:e2021061.ArticlePubMedPMC
- 24. Kabarriti R, Brodin NP, Maron MI, et al. Association of race and ethnicity with comorbidities and survival among patients with COVID-19 at an urban medical center in New York. JAMA Netw Open 2020;3:e2019795.ArticlePubMedPMC
- 25. Ward JL, Harwood R, Smith C, et al. Risk factors for PICU admission and death among children and young people hospitalized with COVID-19 and PIMS-TS in England during the first pandemic year. Nat Med 2022;28:193−200.ArticlePubMedPDF
- 26. Nguyen JL, Alfred T, Reimbaeva M, et al. Population attributable fractions of underlying medical conditions for coronavirus disease 2019 (COVID-19) diagnosis and COVID-19 hospitalizations, ventilations, and deaths among adults in the United States. Open Forum Infect Dis 2022;9:ofac099. ArticlePubMedPMCPDF
- 27. Harrison SL, Fazio-Eynullayeva E, Lane DA, et al. Comorbidities associated with mortality in 31,461 adults with COVID-19 in the United States: a federated electronic medical record analysis. PLoS Med 2020;17:e1003321.ArticlePubMedPMC
- 28. Gao YD, Ding M, Dong X, et al. Risk factors for severe and critically ill COVID-19 patients: a review. Allergy 2021;76:428−55.ArticlePubMedPDF
- 29. Talic S, Shah S, Wild H, et al. Effectiveness of public health measures in reducing the incidence of COVID-19, SARS-CoV-2 transmission, and covid-19 mortality: systematic review and meta-analysis. BMJ 2021;375:e068302.ArticlePubMed
- 30. Smith JP, Kressel AB, Grout RW, et al. Poverty, comorbidity, and ethnicity: COVID-19 outcomes in a safety net health system. Ethn Dis 2022;32:113−22.ArticlePubMedPMCPDF
- 31. Ioannou GN, Locke E, Green P, et al. Risk factors for hospitalization, mechanical ventilation, or death among 10 131 US Veterans with SARS-CoV-2 infection. JAMA Netw Open 2020;3:e2022310.ArticlePubMedPMC
- 32. Wooldridge JM. Econometric analysis of cross section and panel data. Cambridge: MIT Press; 2002.
- 33. Hale T, Angrist N, Goldszmidt R, et al. A global panel database of pandemic policies (Oxford COVID-19 Government Response Tracker). Nat Hum Behav 2021;5:529−38.ArticlePubMedPDF
- 34. Bartsch SM, O’Shea KJ, Ferguson MC, et al. Vaccine efficacy needed for a COVID-19 coronavirus vaccine to prevent or stop an epidemic as the sole intervention. Am J Prev Med 2020;59:493−503.ArticlePubMedPMC
- 35. Mohamed K, Rzymski P, Islam MS, et al. COVID-19 vaccinations: the unknowns, challenges, and hopes. J Med Virol 2022;94:1336−49.ArticlePubMedPDF
- 36. Lin DY, Zeng D, Gilbert PB. Evaluating the long-term efficacy of coronavirus disease 2019 (COVID-19) vaccines. Clin Infect Dis 2021;73:1927−39.Article
- 37. Thomas SJ, Moreira ED Jr, Kitchin N, et al. Safety and efficacy of the BNT162b2 mRNA COVID-19 vaccine through 6 months. N Engl J Med 2021;385:1761−73.ArticlePubMed
- 38. Wilson N, Kvalsvig A, Barnard LT, et al. Case-fatality risk estimates for COVID-19 calculated by using a lag time for fatality. Emerg Infect Dis 2020;26:1339−441.ArticlePubMedPMC
- 39. Azizi H, Esmaeili ED, Fakhari A. Challenges and accurate estimates of mortality and case-fatality rates due to COVID-19. New Microbes New Infect 2020;38:100775. ArticlePubMedPMC
- 40. V MS, A CM, A BG, et al. Analysis of case fatality rate of SARS-CoV-2 infection in the Spanish Autonomous Communities between March and May 2020. PLoS One 2021;16:e0260769.ArticlePubMedPMC
- 41. Aguiar M, Stollenwerk N. Condition-specific mortality risk can explain differences in COVID-19 case fatality ratios around the globe. Public Health 2020;188:18−20.ArticlePubMed
- 42. Dudel C, Riffe T, Acosta E, et al. Monitoring trends and differences in COVID-19 case-fatality rates using decomposition methods: contributions of age structure and age-specific fatality. PLoS One 2020;15:e0238904.ArticlePubMedPMC
- 43. Acosta AM, Garg S, Pham H, et al. Racial and ethnic disparities in rates of COVID-19-associated hospitalization, intensive care unit admission, and in-hospital death in the United States from March 2020 to February 2021. JAMA Netw Open 2021;4:e2130479.ArticlePubMedPMC
- 44. Khanijahani A, Iezadi S, Gholipour K, et al. A systematic review of racial/ethnic and socioeconomic disparities in COVID-19. Int J Equity Health 2021;20:248. ArticlePubMedPMCPDF
- 45. Schafer E, Scheer C, Salje K, et al. Course of disease and risk factors for hospitalization in outpatients with a SARS-CoV-2 infection. Sci Rep 2022;12:7249. ArticlePubMedPMCPDF
- 46. Iezadi S, Gholipour K, Azami-Aghdash S, et al. Effectiveness of non-pharmaceutical public health interventions against COVID-19: a systematic review and meta-analysis. PLoS One 2021;16:e0260371.ArticlePubMedPMC
- 47. Cao Y, Hiyoshi A, Montgomery S. COVID-19 case-fatality rate and demographic and socioeconomic influencers: worldwide spatial regression analysis based on country-level data. BMJ Open 2020;10:e043560.ArticlePubMedPMC
- 48. COVID-19 National Preparedness Collaborators. Pandemic preparedness and COVID-19: an exploratory analysis of infection and fatality rates, and contextual factors associated with preparedness in 177 countries, from Jan 1, 2020, to Sept 30, 2021. Lancet 2022;399:1489−512.PubMedPMC
- 49. Chen J, Wang R, Gilby NB, et al. Omicron variant (B.1.1.529): infectivity, vaccine breakthrough, and antibody resistance. J Chem Inf Model 2022;62:412−22.ArticlePubMedPMC
- 50. Meo SA, Meo AS, Al-Jassir FF, et al. Omicron SARS-CoV-2 new variant: global prevalence and biological and clinical characteristics. Eur Rev Med Pharmacol Sci 2021;25:8012−8.PubMed
- 51. Yamasoba D, Kimura I, Nasser H, et al. Virological characteristics of the SARS-CoV-2 Omicron BA.2 spike. Cell 2022;185:2103−15.PubMedPMC
- 52. Ren SY, Wang WB, Gao RD, et al. Omicron variant (B.1.1.529) of SARS-CoV-2: mutation, infectivity, transmission, and vaccine resistance. World J Clin Cases 2022;10:1−11.ArticlePubMedPMC
- 53. Uraki R, Kiso M, Iida S, et al. Characterization and antiviral susceptibility of SARS-CoV-2 Omicron BA.2. Nature 2022;607:119−27.PubMedPMC
- 54. Polack FP, Thomas SJ, Kitchin N, et al. Safety and efficacy of the BNT162b2 mRNA COVID-19 vaccine. N Engl J Med 2020;383:2603−15.ArticlePubMed
- 55. Chenchula S, Karunakaran P, Sharma S, et al. Current evidence on efficacy of COVID-19 booster dose vaccination against the Omicron variant: a systematic review. J Med Virol 2022;94:2969−76.ArticlePubMedPMCPDF
- 56. Green MS, Peer V, Schwartz N, et al. The confounded crude case-fatality rates (CFR) for COVID-19 hide more than they reveal: a comparison of age-specific and age-adjusted CFRs between seven countries. PLoS One 2020;15:e0241031.ArticlePubMedPMC
- 57. Pugliese G, Vitale M, Resi V, et al. Is diabetes mellitus a risk factor for coronavirus disease 19 (COVID-19)? Acta Diabetol 2020;57:1275−85.ArticlePubMedPMCPDF
References
Figure & Data
References
Citations
- Comments on the article "Time-series comparison of COVID-19 case fatality rates across 21 countries with adjustment for multiple covariates"
Gaetano Perone
Osong Public Health and Research Perspectives.2023; 14(2): 146. CrossRef
 Cite
Cite