Introduction
Metabolic syndrome (MetS) comprises a cluster of cardiometabolic abnormalities, including abdominal obesity, elevated blood pressure, dysglycemia, and dyslipidemia, that together increase the risks of cardiovascular disease, type 2 diabetes, and premature mortality. Standard definitions, such as the National Cholesterol Education Program Adult Treatment Panel III (NCEP-ATP III) criteria, define MetS as the presence of at least 3 of 5 component abnormalities [
1]. Beyond the composite diagnosis, each component is clinically relevant because its prevalence pattern may vary by age, sex, and calendar period [
2]. Accordingly, surveillance of individual MetS components may provide more actionable public health information than assessment of the overall prevalence of MetS alone.
In the Republic of Korea, the prevalence of MetS and related cardiometabolic risk factors has reportedly increased in association with dietary westernization, reduced physical activity, and population aging [
3]. However, much of the existing evidence focuses on adults and is based on cross-sectional snapshots or component distributions within restricted age ranges. Kim et al. [
4] reported an increase in MetS prevalence using data from the Korea National Health and Nutrition Examination Survey from 2008 to 2017; however, their analysis was restricted to adults aged 20–79 years, resulting in underrepresentation of adolescents and the oldest age groups. In addition, many studies have focused primarily on the overall prevalence of MetS, limiting insight into component-specific and age-specific patterns.
Recent Korean epidemiological studies and national fact sheets indicate that cardiometabolic risk remains a major public health concern. Analyses of Korea National Health and Nutrition Examination Survey data have documented changes in MetS and related cardiometabolic risk factors among Korean adults, particularly around the coronavirus disease 2019 pandemic [
5]. National diabetes and dyslipidemia fact sheets similarly indicate that diabetes and lipid disorders remain highly prevalent among Korean adults, with substantial variation by age, sex, obesity status, and comorbid conditions [
6,
7]. Collectively, these findings support continued surveillance of individual MetS components rather than reliance solely on the composite MetS diagnosis.
A life-course perspective can provide a useful framework for interpreting differences in cardiometabolic risk across age groups and social life stages. However, when aggregated repeated cross-sectional statistics are used, these patterns should be interpreted as population-level differences among age groups rather than as within-person life-course changes. Biological aging processes may contribute to the higher prevalence of elevated blood pressure and hyperglycemia in older age groups. Sex-specific biological and social factors may also contribute to differences in abdominal obesity, triglyceride levels, and high-density lipoprotein (HDL) cholesterol across age groups [
8]. Age-related increases in vascular stiffness and insulin resistance, together with declining pancreatic β-cell function, may differentially affect blood pressure and glucose regulation [
9]. Sex differences are also substantial: men often have higher levels of abdominal obesity and triglyceride-related risk, whereas women may experience accelerated cardiometabolic changes after menopause because of hormonal changes and reduced estrogen-related cardiovascular protection [
10,
11]. These differences may contribute to sex crossover patterns at older ages, in which prevalence among women exceeds that among men for specific indicators.
Accordingly, this study analyzed publicly available nationwide aggregated statistics from the National Health Insurance Service (NHIS) health screening statistical yearbook for 2014–2023 to: (1) describe annual trends in the prevalence of 5 MetS components; (2) summarize age-specific patterns using average annual prevalence by age group; and (3) examine sex-specific prevalence differences, endpoint changes, and descriptive sex-by-age crossover patterns.
Materials and Methods
Data Source and Study Design
A secondary descriptive epidemiological analysis was performed using publicly available aggregated data from the NHIS health screening statistical yearbook for 2014–2023 [
12]. The yearbooks are published by the NHIS and report distributions of major health screening indicators among participants in the national health screening program. Thedata were downloaded from the NHIS health screening statistical yearbook website on February 6 and April 3, 2026, and last accessed on June 8, 2026. The values analyzed were taken from the yearbook tables “Statistics on the Metabolic Risk Factors by Age and Gender” (Table VIII-6 in the 2014–2017 yearbooks; Table VII-6 in the 2018–2023 yearbooks) and are provided by year, sex, and age group in
Table S1. Because the dataset consists of aggregated repeated cross-sectional statistics, the unit of analysis was an aggregated prevalence estimate defined by year, sex, and age group rather than an individual participant.
The reported values were crude prevalence estimates derived from aggregated NHIS screening statistics. Overall annual prevalence was calculated as a sex-weighted estimate using sex-specific examinee counts as weights, with the total number of male and female examinees as the denominator. Age-specific and sex-specific prevalence estimates were calculated within the corresponding aggregated strata. Directly age- and sex-standardized prevalence was also calculated for each year using a fixed standard population, defined as the pooled number of examinees by sex and 15 five-year age bands across the analyzed years (
Table S2).
From 2018, the dyslipidemia panel (total, HDL, and low-density lipoprotein cholesterol and triglycerides) of the general health screening was provided at 4-year intervals to men aged ≥24 years and women aged ≥40 years, instead of at every biennial screening. As reflected in the 2018 yearbook [
12], the metabolic risk-factor tables for that year were compiled only for examinees who received this panel (5,000,434 examinees, consistent with the 5,002,693 lipid-tested examinees in the yearbook’s triglyceride distribution table [Table VI-22], compared with 13.1–17.5 million examinees in the other years), and almost no women younger than 40 years were included. From 2019 onward, the tables again used all examinees as the denominator, whereas abnormal triglyceride and HDL cholesterol levels could be identified only among examinees who received the lipid panel or reported dyslipidemia medication. Therefore, the 2018 estimates for all 5 components refer to a different, age- and sex-restricted population, and the lipid indicators from 2018 onward are not comparable with those for 2014–2017. Accordingly, 2018 was excluded from all analyses, and hypertriglyceridemia and low HDL cholesterol were analyzed for 2014–2017 only (
Table S1). The number of examinees aged 20–39 years also increased from 2019 (
Table S1).
The study was designed as a secondary descriptive epidemiological analysis of aggregated repeated cross-sectional national screening statistics. The unit of analysis was the aggregated prevalence estimate by year, age group, and sex rather than the individual participant. Accordingly, the findings describe population-level distributions and temporal patterns in screening statistics and should not be interpreted as within-person longitudinal changes or causal life-course trajectories.
Age Grouping for Descriptive Analysis
The yearbook reports age distributions in 15 five-year bands ranging from ≤19 to ≥85 years. For age-specific descriptive analyses, these categories were reclassified into 7 broader age groups: ≤19, 20–29, 30–39, 40–49, 50–59, 60–69, and ≥70 years. These categories were used to summarize population-level prevalence patterns across broad life stages rather than to infer individual life-course trajectories. Examinees aged ≤19 years are a small, selected subset of this age group (eligible individuals: 31,269 in 2014 and 14,008 in 2023; examinees: 10,655–28,843 per year), and examinees aged 20–29 years (1.2–1.9 million per year; eligible individuals: 1,375,413 in 2014 and 2,667,545 in 2023) also represent a restricted subset of the age group (yearbook Table I-3 [
12]). Estimates for these age groups are therefore not representative of the corresponding general population.
Measures: MetS Components
MetS components were used as defined in the yearbook guide for the tables “Statistics on the Metabolic Risk Factors by Age and Gender” (NCEP-ATP III criteria with Asian cutoffs) [13,14,17]. The original yearbook variable names are given in quotation marks. (1) Abdominal obesity (“Abdominal Obesity”): waist circumference ≥90 cm in men and ≥85 cm in women. (2) Hypertension (“High Blood Pressure”): systolic blood pressure ≥130 mmHg or diastolic blood pressure ≥85 mmHg, or current antihypertensive medication reported in the screening questionnaire. (3) Hyperglycemia (“High Blood Sugar”): fasting glucose ≥100 mg/dL or current antidiabetic medication reported in the questionnaire. (4) Hypertriglyceridemia (“Hypertriglyceridemia”): triglycerides ≥150 mg/dL or current dyslipidemia medication reported in the questionnaire. (5) Low HDL cholesterol (“Low HDL Cholesterolemia”): HDL cholesterol <40 mg/dL in men or <50 mg/dL in women, or current dyslipidemia medication reported in the questionnaire. The medication criteria are stated in the 2014 yearbook guide [
17]; later guides list only the laboratory thresholds, but the yearbook counts continued to exceed counts based on laboratory thresholds alone in the yearbook’s distribution tables (e.g., hyperglycemia in 2023, ratio 1.03), whereas counts for abdominal obesity, which has no medication criterion, matched exactly (ratio 1.00), indicating that medication-treated examinees continued to be counted
Table S3).
In this study, “hypertension” and “hyperglycemia” are used as variable labels consistent with the NHIS National Health Screening Statistical Yearbook and denote the component thresholds defined above rather than clinical diagnoses.
Statistical Analysis
Because this study used aggregated repeated cross-sectional statistics, the results reflect population-level prevalence distributions rather than within-person longitudinal trajectories. Accordingly, all analyses were ecological and descriptive in nature. Linear regression with year as a continuous predictor was used to summarize the direction and magnitude of observed temporal trends across the 9 analyzed annual observations (2014–2017 and 2019–2023) for abdominal obesity, hypertension, and hyperglycemia. To examine whether trends differed before and after 2018, a 2-segment (piecewise) linear model was also fitted: prevalence=b0+b1(year−2014)+b2D+b3D(year−2019), where D = 1 for 2019–2023; this yields period-specific annual changes for 2014–2017 and 2019–2023 and a test of the change in slope. Because only 4 comparable annual observations (2014–2017) were available for hypertriglyceridemia and low HDL cholesterol, no trend estimates were calculated for these indicators, and their values are reported descriptively. The regression coefficient (B) and coefficient of determination (R²) were used to summarize temporal patterns, whereas p-values were interpreted cautiously given the small number of annual observations and were not considered evidence of causal, predictive, or individual-level longitudinal change. Time-series autocorrelation was not formally assessed because of the limited number of annual data points; the lack of formal assessment was considered a methodological limitation. In addition, because many individuals undergo screening repeatedly across years, the annual estimates are not independent; ordinary least squares confidence intervals and p-values are therefore likely to be too narrow and are presented descriptively. Age- and sex-standardized prevalence was summarized in the same way.
Overall annual prevalence was calculated as a sex-weighted average using sex-specific examinee counts as weights. The denominator for overall prevalence was the total number of examinees in each year (men and women).
All analyses were performed using Python 3.13 (SciPy 1.18 and statsmodels 0.15; Python Software Foundation) and IBM SPSS ver. 28.0 (IBM Corp.), with 2-sided p<0.05 considered to indicate statistical significance. Insert new subsection at the end of Materials and Methods (journal instructions require AI use to be reported in a dedicated section of the Methods): Use of Generative Artificial Intelligence During the preparation of this manuscript, the authors used Claude (Anthropic) for English-language editing, reference checking, and figure editing. The authors reviewed and edited all outputs and take full responsibility for the content of the publication.
Results
Annual Prevalence Trends (2014–2023)
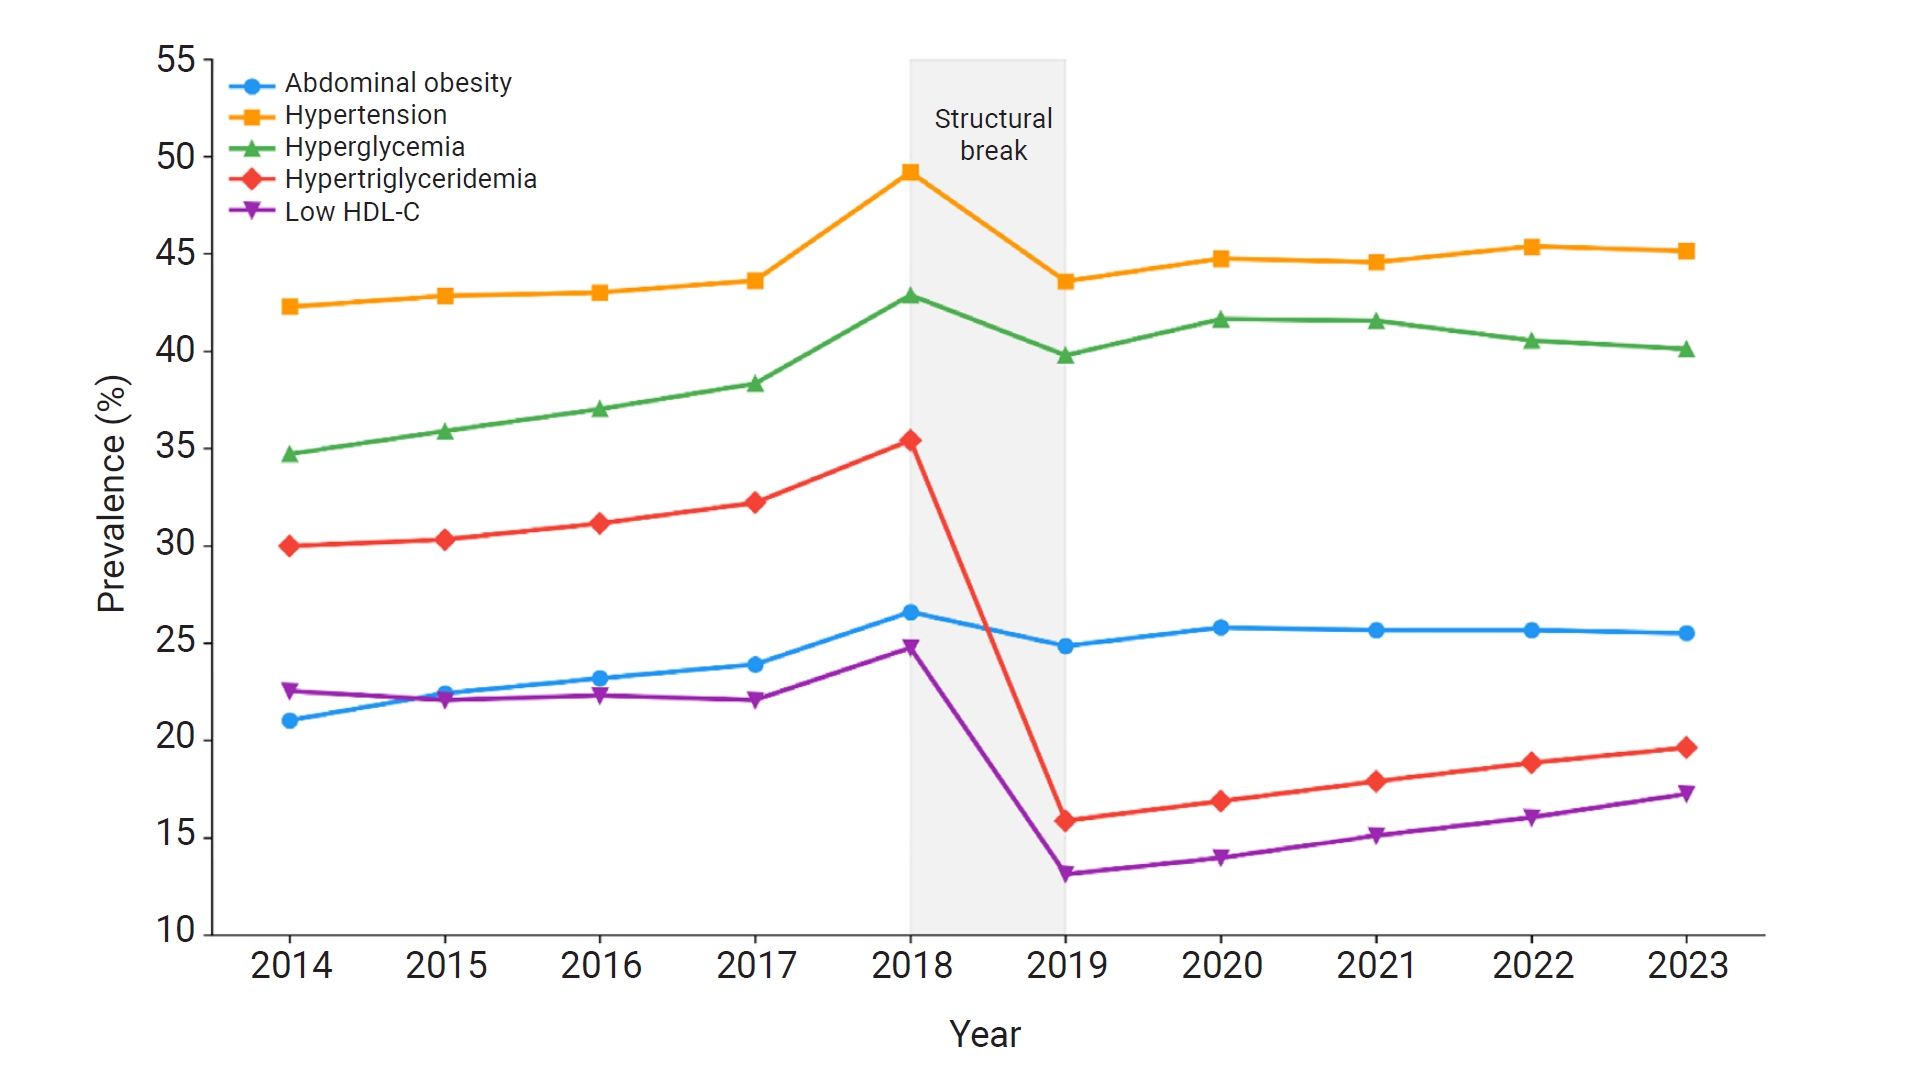
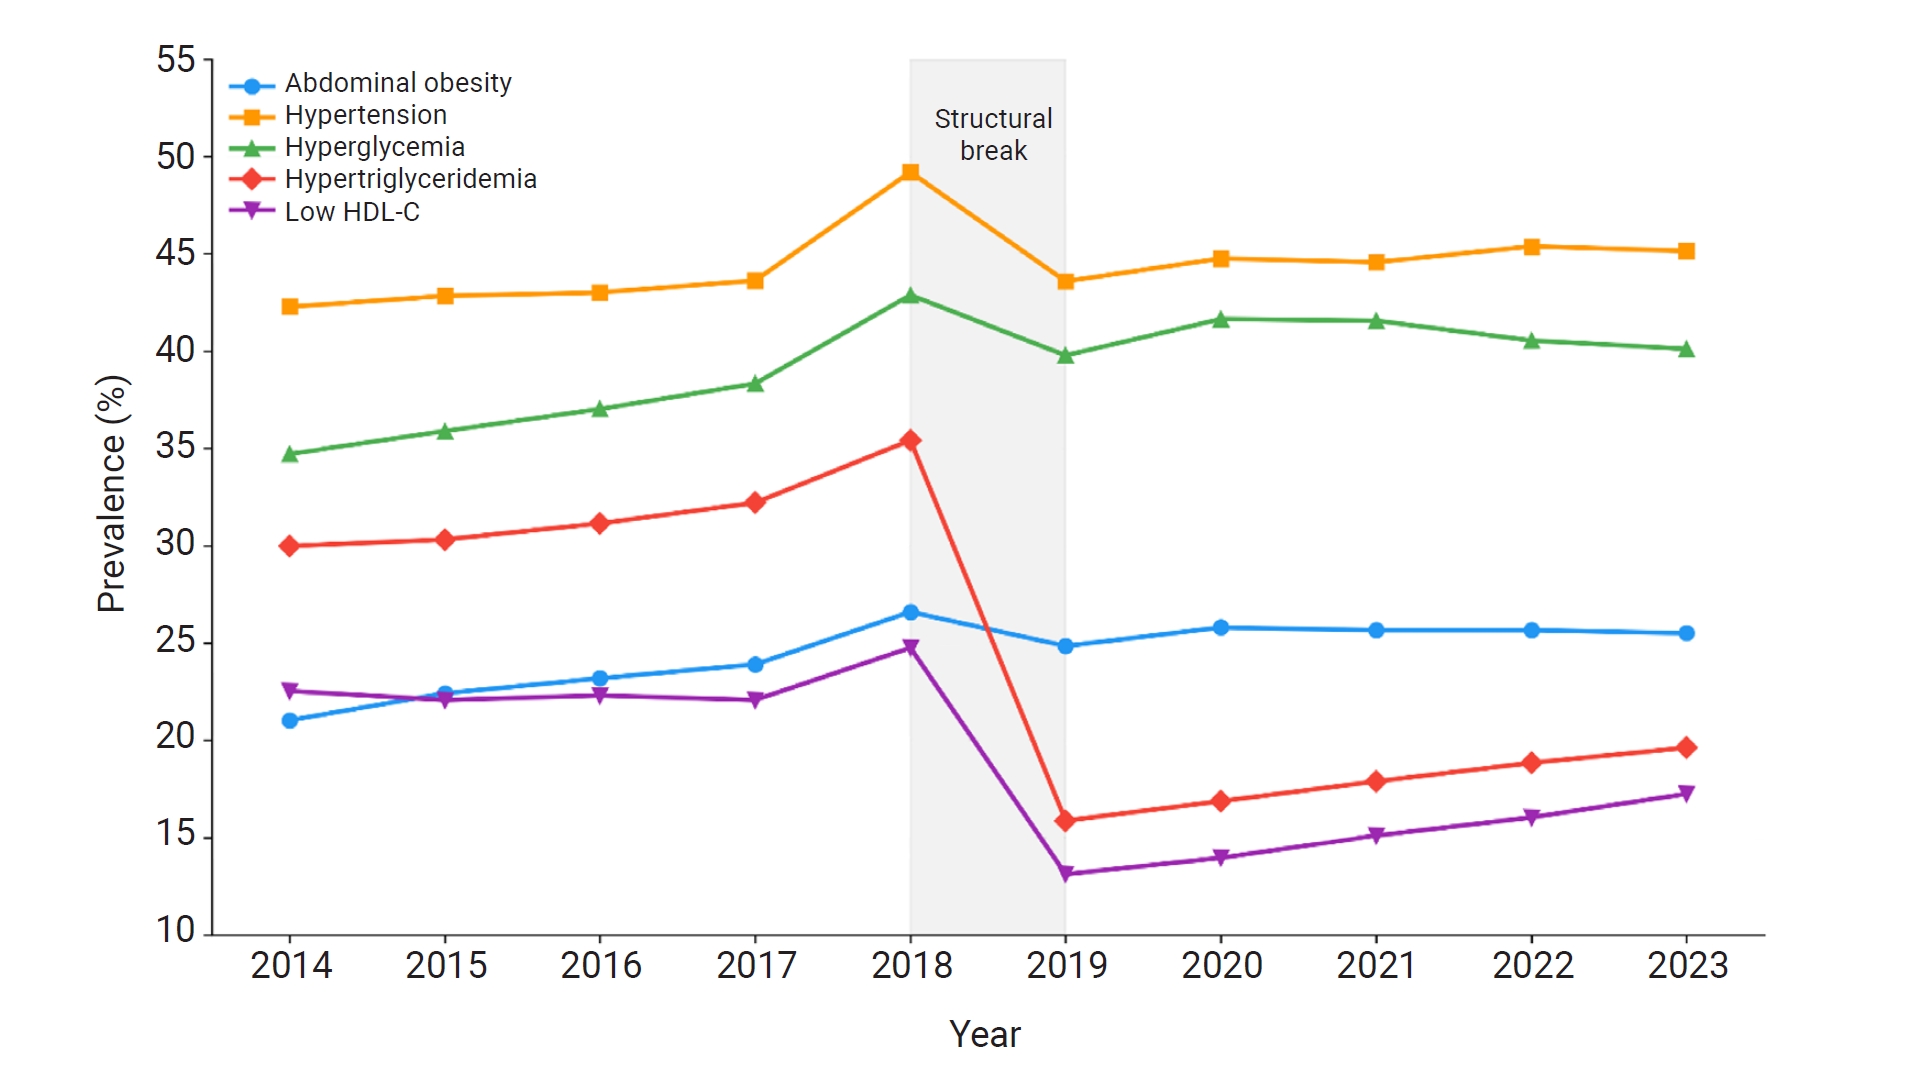
Abdominal obesity increased from 21.0% in 2014 to 25.5% in 2023 (+4.5 percentage points; B=+0.497 percentage points per year, R
2 = 0.87), hyperglycemia from 34.7% to 40.1% (+5.4 percentage points; B=+0.698, R
2=0.80), and hypertension from 42.3% to 45.1% (+2.9 percentage points; B=+0.332, R
2=0.94) (
Table 1;
Figure 1). Most of the increases in abdominal obesity and hyperglycemia occurred before 2019: in the 2-segment model, the annual change was larger in 2014–2017 (B=+0.938 and +1.198 percentage points per year, respectively) than in 2019–2023 (B=+0.118 and −0.043; p for slope change=0.007 and 0.030), whereas hypertension increased at a similar rate in both periods (B=+0.423 and +0.374; p=0.798). After direct age and sex standardization, the 2014–2023 increase was similar for abdominal obesity (+4.4 percentage points) and hyperglycemia (+4.8 percentage points) but smaller for hypertension (+1.8 percentage points) (
Table S1). Between 2014 and 2017, hypertriglyceridemia increased from 30.0% to 32.2% (+2.2 percentage points), whereas low HDL cholesterol changed little (22.5% to 22.1%; −0.5 percentage points).
Including the 2018 values, which refer only to the lipid-tested subgroup, changed the hypertension estimates substantially (B=+0.299, R2=0.21, p=0.181, vs. B=+0.332, R2=0.94 without 2018), showing that the trend estimates were sensitive to a single non-comparable observation; 2018 was therefore excluded from all analyses.
Age-Specific Prevalence Patterns Based on Average Annual Prevalence
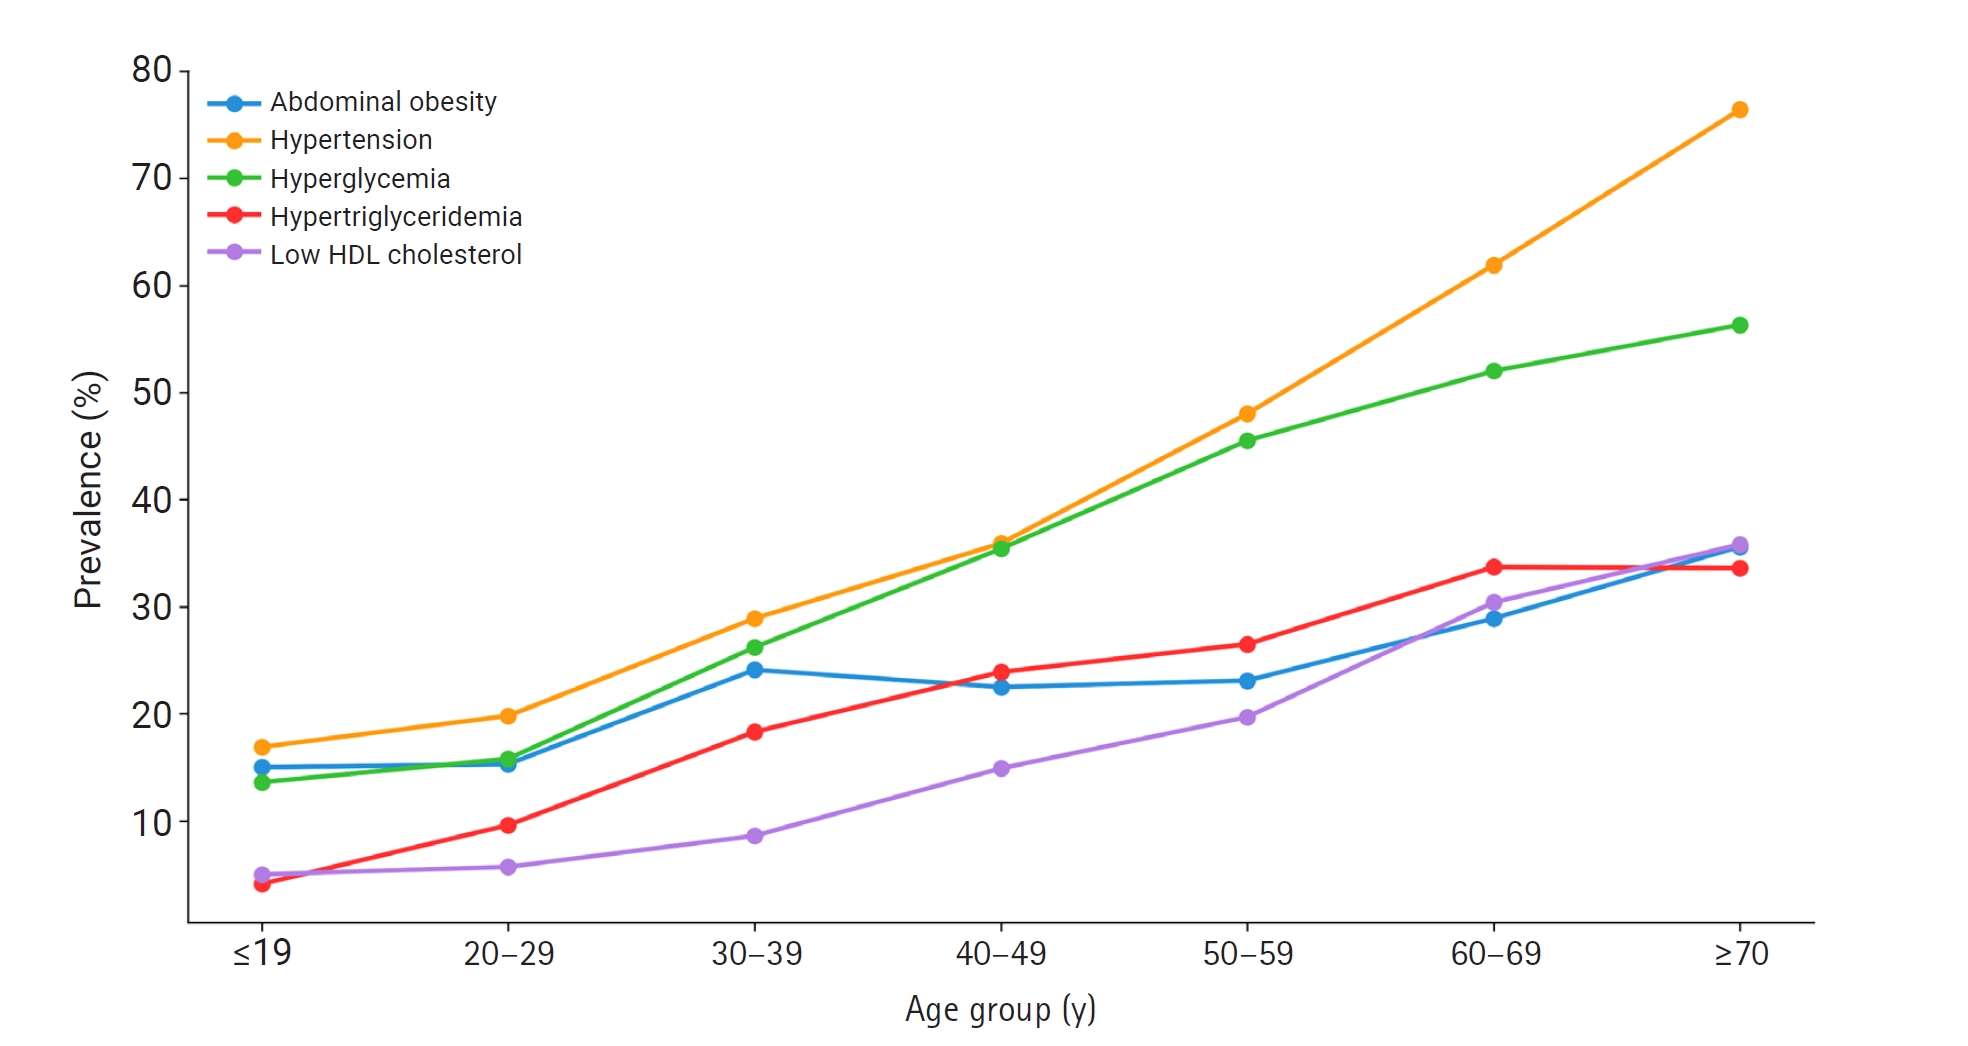
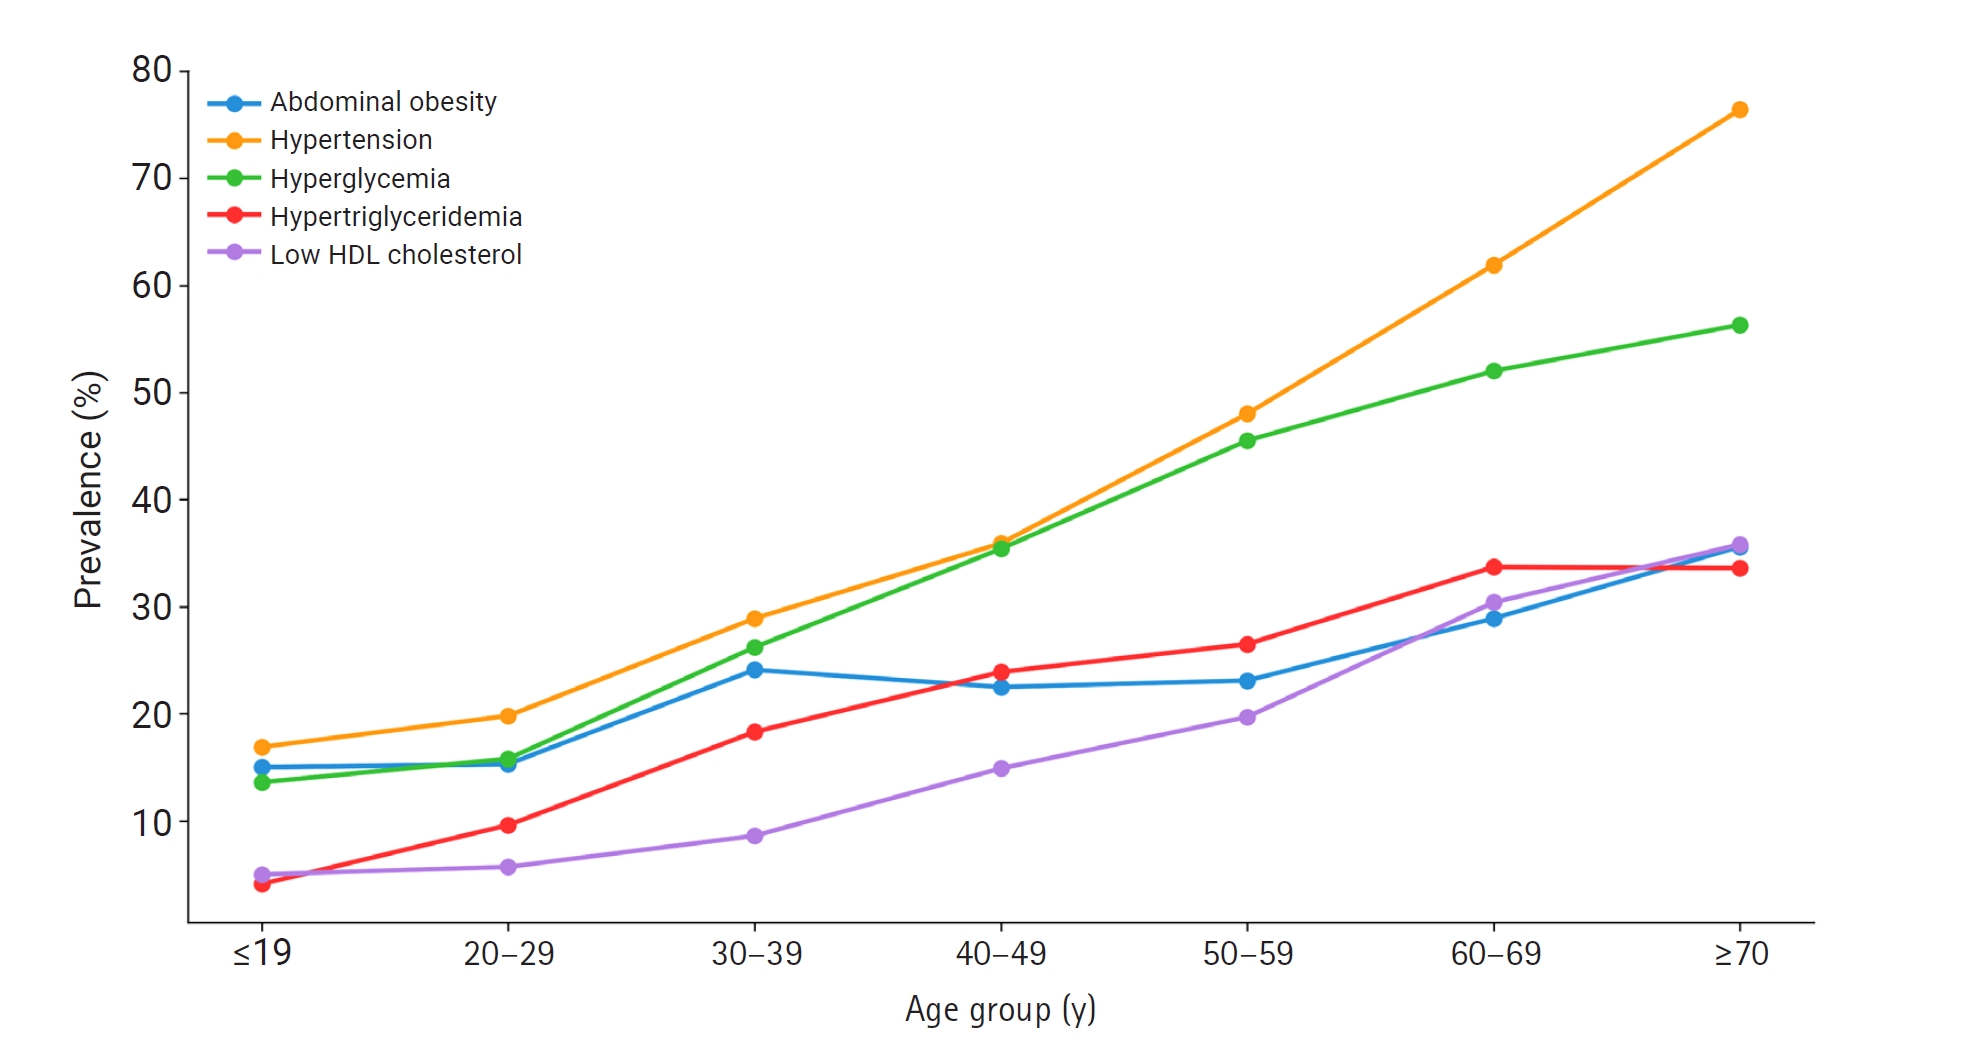
Average prevalence generally increased across older age groups, although the pattern was not strictly monotonic for all components. Abdominal obesity prevalence was 14.4% in the ≤19-year group and 35.5% in the ≥70-year group, although prevalence decreased slightly between the 30–39 and 40–49 age groups. Hypertension and hyperglycemia showed the clearest age-related gradients, increasing from 17.5% to 76.4% and from 14.6% to 56.4%, respectively, between the youngest and oldest age groups. Estimates for the ≤19- and 20–29-year groups are based on restricted subsets of these age groups. These findings demonstrate substantial differences in population-level prevalence across age groups rather than within-person changes over time (
Table 2;
Figure 2).
The age gradient was steepest for hypertension (17.5% in the ≤19-year group vs. 76.4% in the ≥70-year group), followed by hyperglycemia (14.6% vs. 56.4%). These gradients may be associated with age-related physiological changes in vascular and glycemic regulation.
Sex-Specific Average Prevalence and Endpoint Change
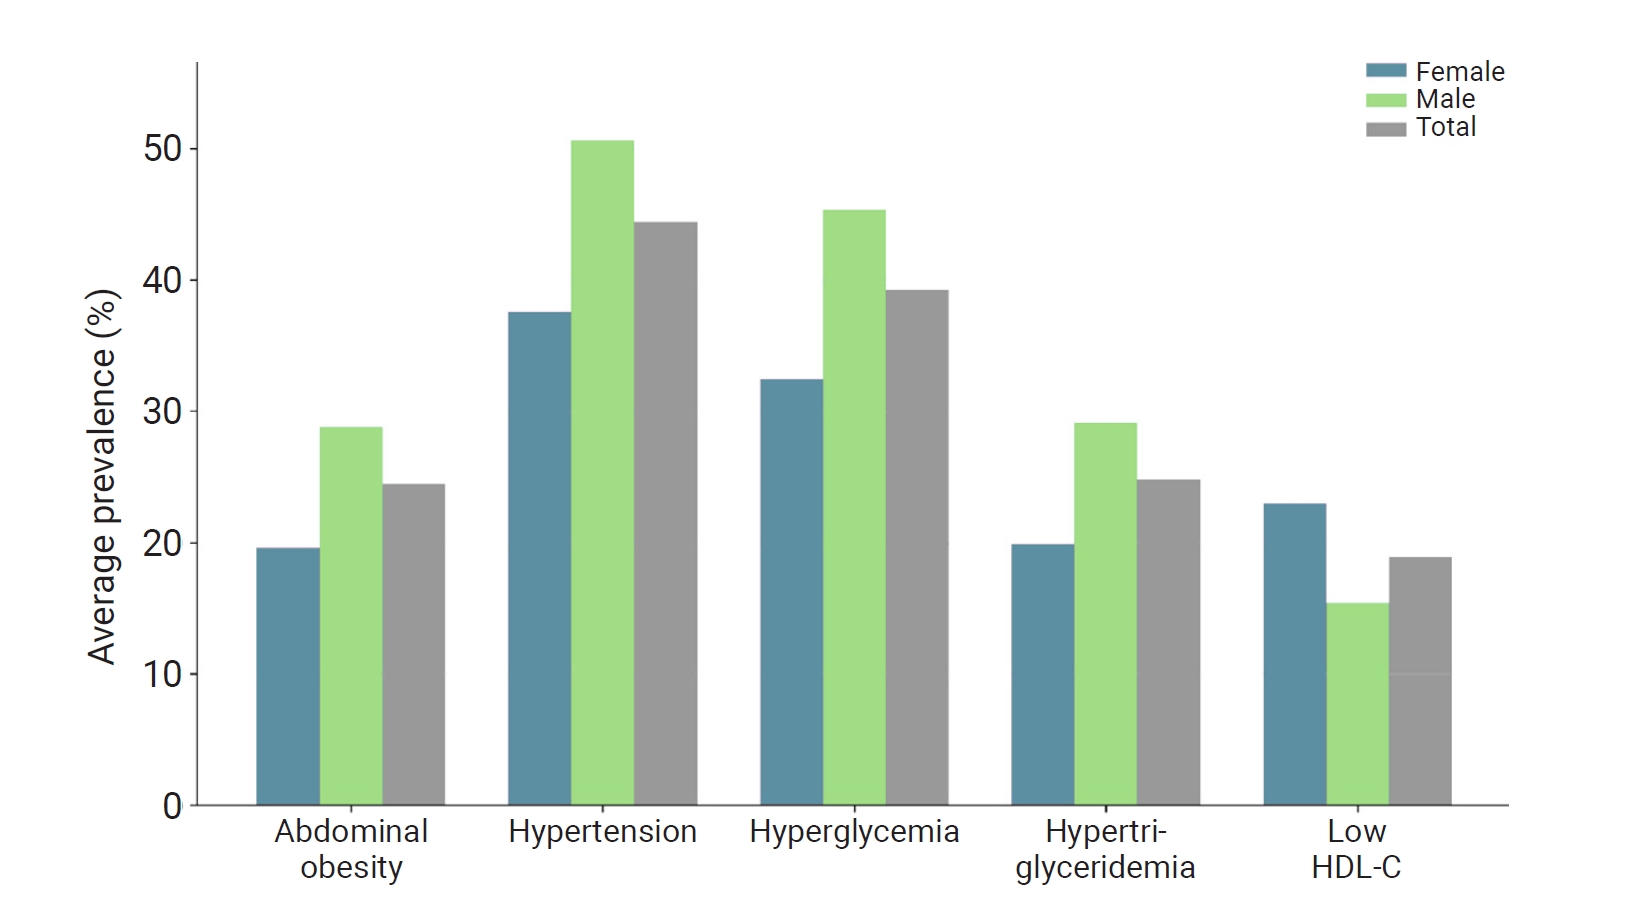
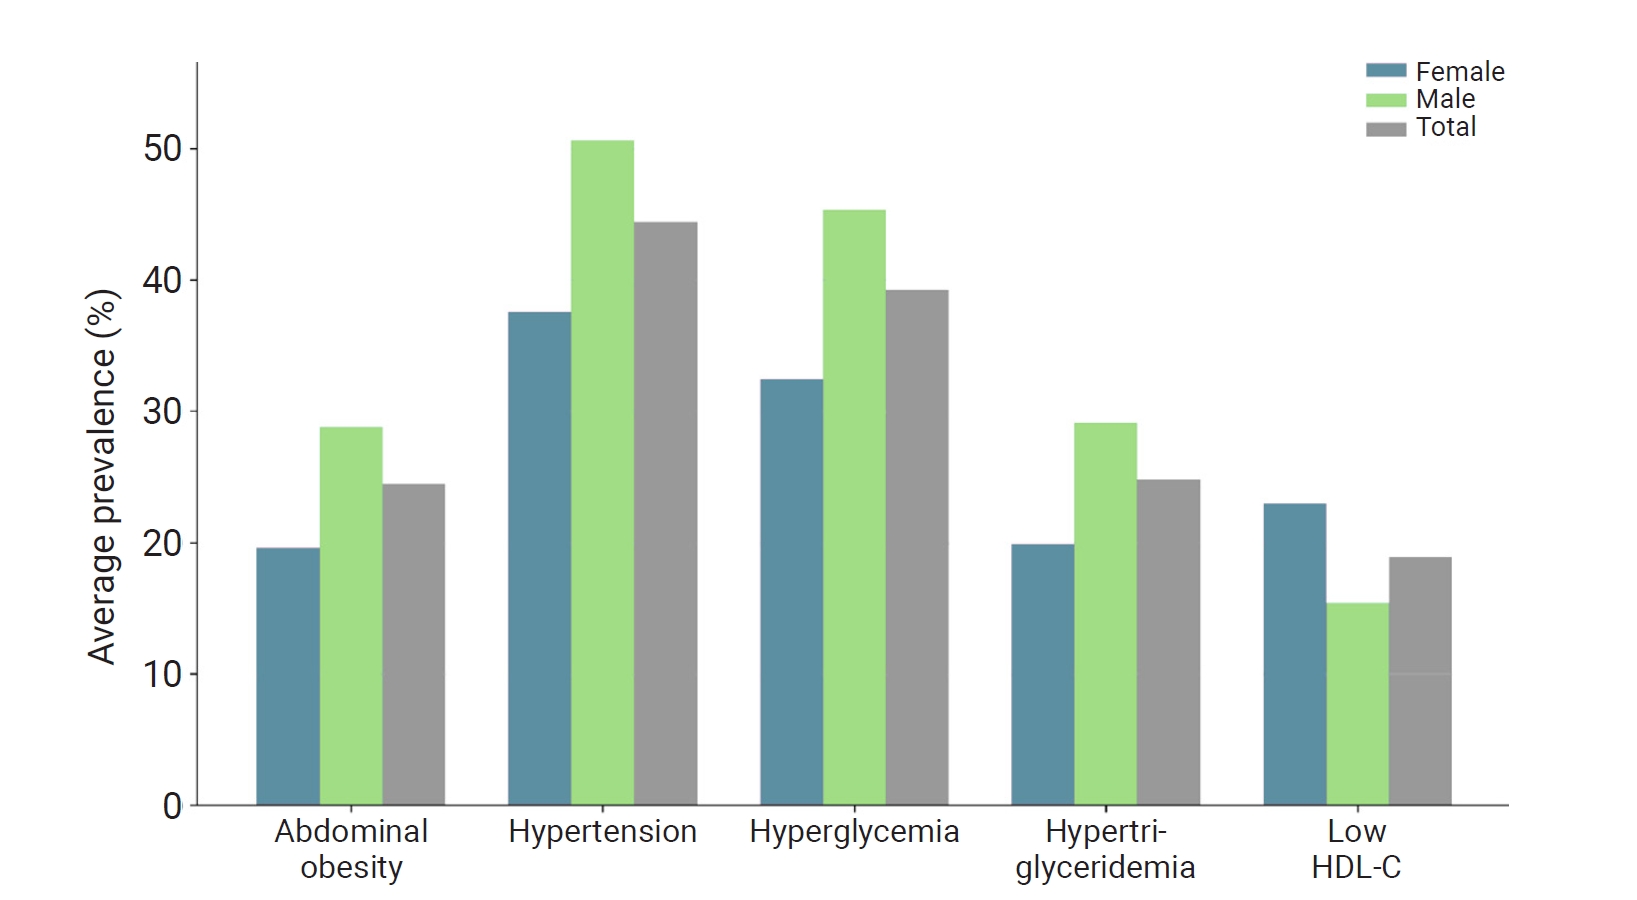
Men had a higher average prevalence of abdominal obesity (28.8% vs. 19.2%), hypertension (50.4% vs. 36.7%), hyperglycemia (45.1% vs. 31.9%), and hypertriglyceridemia (38.4% vs. 22.3%; 2014–2017), whereas women had a higher prevalence of low HDL cholesterol (27.8% vs. 17.5%; 2014–2017) (
Table 3;
Figure 3). The increase in abdominal obesity between 2014 and 2023 was substantially greater among men (23.6% to 31.8%; +8.1 percentage points) than among women (17.9% to 18.8%; +0.9 percentage points). Between 2014 and 2017, hypertriglyceridemia increased among both men (+2.3 percentage points) and women (+2.5 percentage points), whereas low HDL cholesterol changed little among men (+0.5 percentage points) and decreased among women (−1.8 percentage points).
Sex-by-Age Crossover Patterns in Older Ages
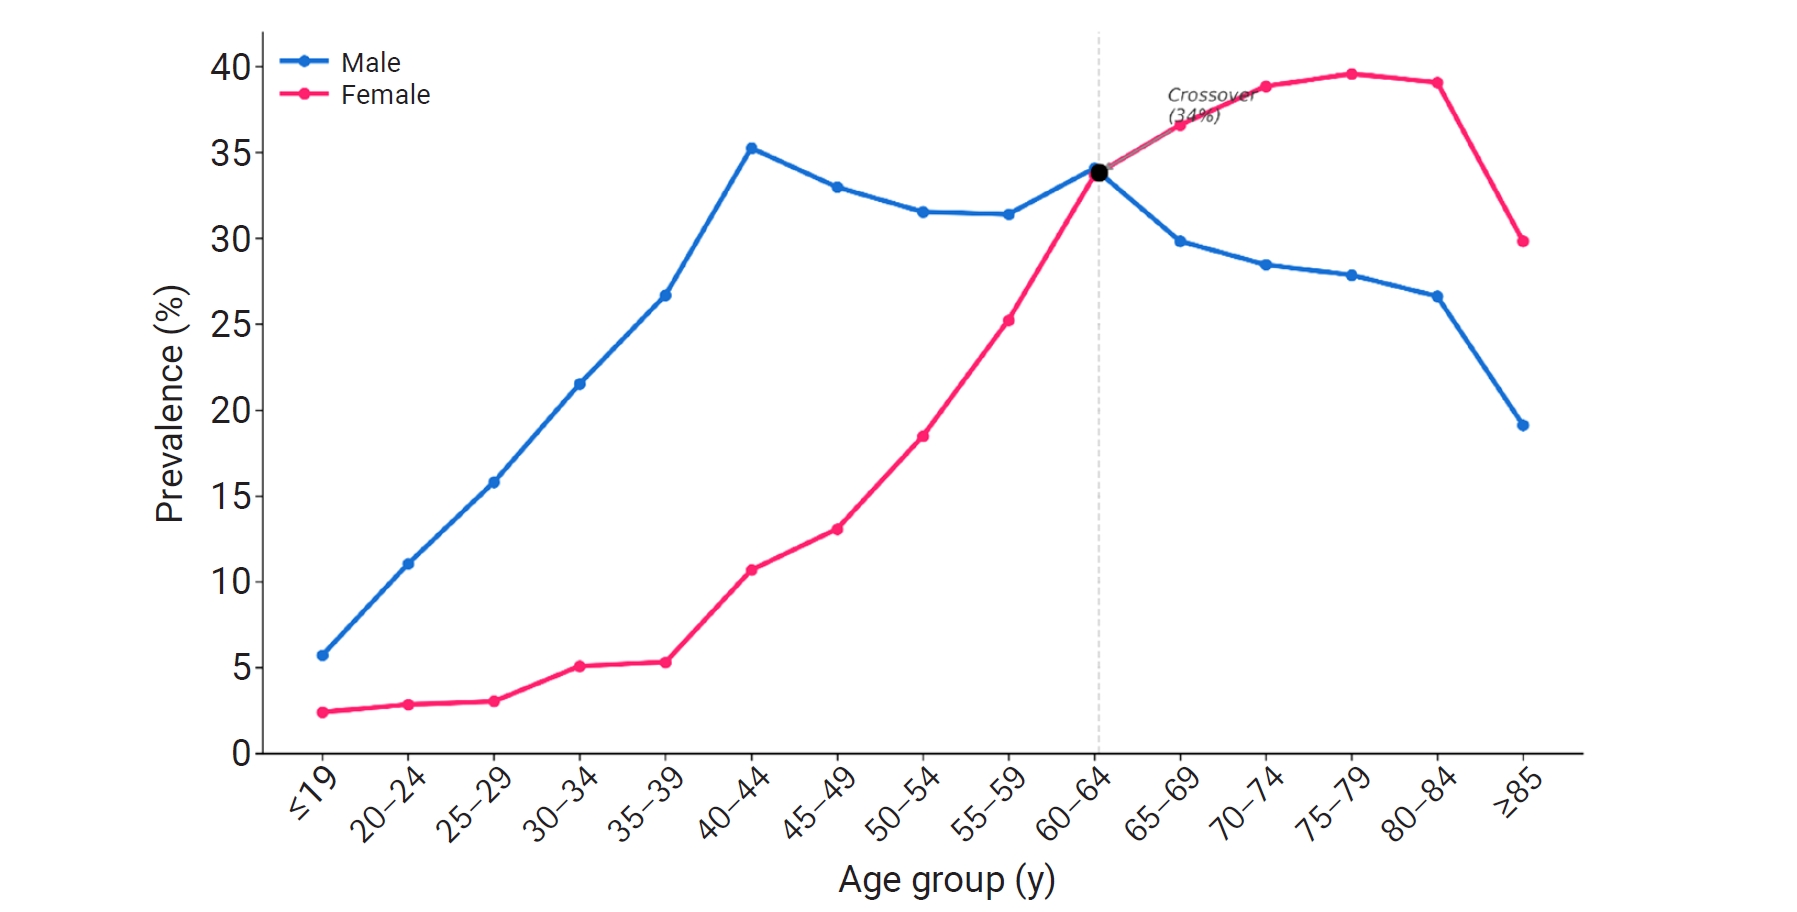
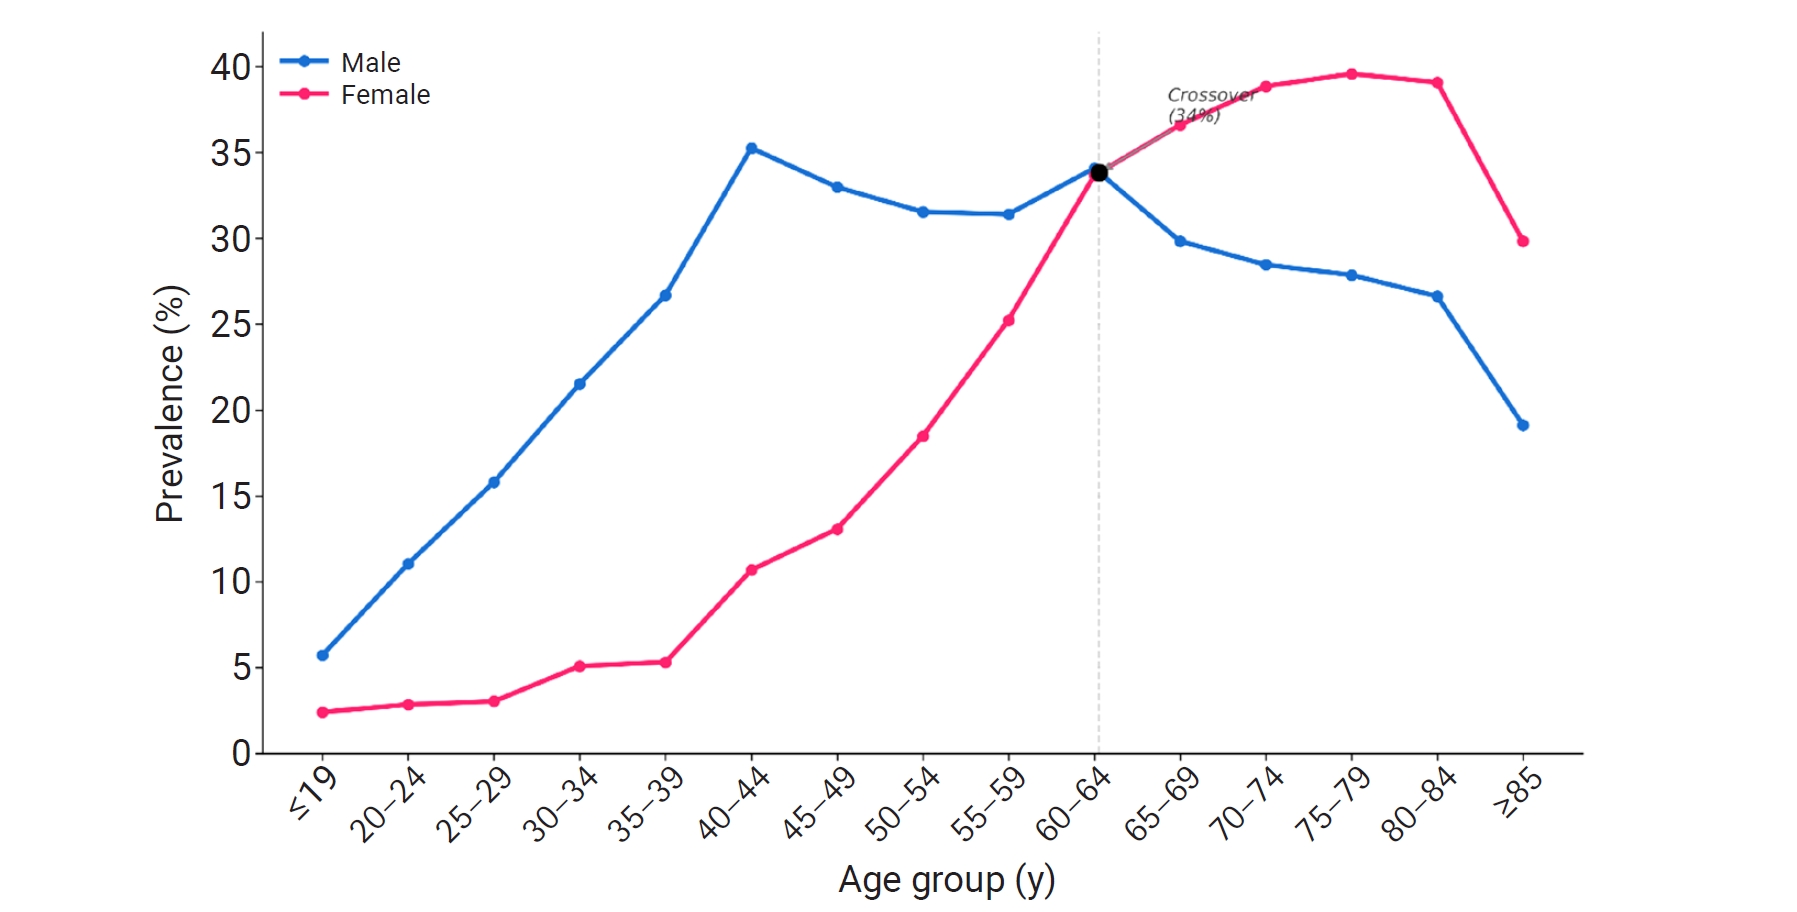
To characterize crossover patterns in which prevalence among women exceeded that among men, age-specific prevalence was compared between men and women for the 3 indicators showing such patterns: abdominal obesity, hypertriglyceridemia, and low HDL cholesterol (
Table 4;
Figure 4). Sex-by-age crossover patterns were identified descriptively by comparing average prevalence between men and women within each age group. Because the data were aggregated, these crossover patterns were not formally tested using individual-level statistical models. Abdominal obesity showed a descriptive crossover in the ≥70-year age group, in which prevalence was higher among women than among men. For hypertriglyceridemia (2014–2017), a crossover occurred in the ≥70-year group in the 7-group classification; in 5-year age bands (
Figure 4), prevalence among men peaked at 45–49 years (44.9%) and then declined, whereas prevalence among women increased steadily with age and exceeded that among men from 65–69 years (38.4% vs. 35.1%). Low HDL cholesterol (2014–2017) was more prevalent among women than among men in every age group.
Discussion
This study provides a national descriptive profile of 5 MetS components in the Republic of Korea based on aggregated repeated cross-sectional screening statistics from 2014 to 2023. Three main findings emerged. First, abdominal obesity and hyperglycemia increased, mainly before 2019; hypertension increased in both periods, partly reflecting the older age composition of examinees; and during the comparable period (2014–2017), hypertriglyceridemia increased, whereas low HDL cholesterol changed little. Second, prevalence differed substantially across age groups, particularly for hypertension and hyperglycemia. Third, sex-specific differences were pronounced, with men showing a higher prevalence of most components and older women showing descriptive crossover patterns for selected lipid-related indicators.
The observed increases in abdominal obesity and hyperglycemia are consistent with recent Korean epidemiological evidence indicating a persistent or increasing cardiometabolic burden [
5,
15]. National diabetes surveillance has shown that diabetes remains highly prevalent among Korean adults, particularly older adults, and frequently coexists with obesity, hypertension, and hypercholesterolemia [
6]. National dyslipidemia surveillance likewise indicates that lipid disorders remain common in the Republic of Korea, although awareness, treatment, and control have improved [
7]. Collectively, these findings indicate that the observed increases in adiposity- and glycemia-related indicators are epidemiologically plausible, whereas lipid-related indicators after 2017 could not be compared because of the change in the dyslipidemia screening schedule.
Comparability of Screening Statistics Across 2018
The apparent decline in lipid-related indicators in the yearbook series reflected a change in the screening program rather than an epidemiological change. From 2018, the dyslipidemia panel was provided at 4-year intervals to men aged ≥24 years and women aged ≥40 years. The 2018 yearbook compiled its metabolic risk-factor tables only for examinees who received the panel, so that year’s estimates for all 5 components refer to an age- and sex-restricted subgroup that included almost no women younger than 40 years; from 2019, all examinees were used as the denominator, whereas lipid abnormalities could be identified only among those tested or treated. In the comparable period (2014–2017), hypertriglyceridemia increased, whereas low HDL cholesterol changed little; thus, the screening statistics provide no consistent evidence of improvement in lipid-related indicators. Monitoring lipid indicators from routine screening statistics therefore requires denominators restricted to examinees who received the lipid panel. Including the 2018 values also changed the hypertension trend estimate substantially, illustrating how sensitive estimates from short annual series are to a single non-comparable observation.
Divergent Component Trends: Adiposity and Glycemia Increases
Abdominal obesity and hyperglycemia increased over the study period, mainly before 2019, and changed little during 2019–2023, indicating greater population-level burdens of central adiposity and dysglycemia than at the start of the period. Because the composition of examinees changed in 2019 (the number of examinees aged 20–39 years increased), the later plateau should be interpreted cautiously; however, the pattern was similar after age and sex standardization. These patterns are epidemiologically important because central adiposity and glycemic dysregulation are major contributors to cardiovascular disease and diabetes risk. The findings suggest that prevention and management efforts may need to place greater emphasis on weight-related behaviors and the early identification of glycemic risk across age groups.
Age-Specific Patterns and Implications for Prevention
Average prevalence generally increased across older age groups, although the pattern was not strictly monotonic for all components. Hypertension and hyperglycemia showed the steepest age-related gradients, which may partly reflect age-related physiological changes in vascular stiffness, insulin resistance, and glucose regulation. These patterns are consistent with established age-related increases in vascular stiffness and insulin resistance and with declining β-cell function [
9].
For abdominal obesity, the largest difference between adjacent age groups was observed between the 20–29- and 30–39-year groups (8.8 percentage points).
The age-specific findings should be interpreted as differences among population age groups rather than as evidence of within-person life-course progression. The higher prevalence of abdominal obesity in the 30–39-year group than in the 20–29-year group may be associated with variation in lifestyle and social factors across early adulthood, including work patterns, physical activity, dietary habits, and other health behaviors. However, these explanations remain hypothetical because the study did not include individual-level behavioral or socioeconomic variables. The observed age-group pattern may therefore identify a potentially important period for prevention at the population level but should not be interpreted as evidence of specific causal mechanisms. Moreover, because the analysis was based on aggregated screening statistics, it cannot determine whether the pattern reflects individual weight gain, cohort differences, changes in screening participation, or unmeasured behavioral and socioeconomic factors.
Sex Differences and Targeted Prevention Priorities
Sex-stratified results showed that men had a higher prevalence of abdominal obesity, hypertension, hyperglycemia, and hypertriglyceridemia, whereas women had a higher prevalence of low HDL cholesterol.
The increase in abdominal obesity between 2014 and 2023 was substantially greater among men (+8.1 percentage points) than among women (+0.9 percentage points).
These findings are consistent with reported sex differences in visceral adipose tissue accumulation and metabolic risk [
16].
Age-specific analyses further suggested that the higher prevalence of abdominal obesity among men was particularly pronounced in mid-adulthood (30s and 40s). This pattern suggests that screening and lifestyle programs directed toward men in these age groups may have substantial population-level relevance.
Sex Crossover in Older Women and the Role of Menopausal Transition
The sex crossover patterns observed for abdominal obesity (≥70 years) and hypertriglyceridemia (from 65–69 years), together with the higher prevalence of low HDL cholesterol among women in all age groups, suggest that prevalence varies by sex across age groups and becomes higher among women for some indicators in midlife or older age.
These patterns are consistent with menopause-related hormonal changes, including declining estrogen levels, that have been associated with changes in lipid metabolism and cardiovascular risk profiles [
10,
11].
From a clinical and public health perspective, these findings support consideration of more proactive dyslipidemia monitoring and management in perimenopausal and postmenopausal women, with risk communication that accounts for life-stage changes.
Strengths, Limitations, and Future Research Directions
A key strength of this study is the use of nationwide screening statistics spanning the full age spectrum over a 10-year period, which enabled large-scale descriptive assessment of age- and sex-specific prevalence patterns. Identification of the 2018 change in the denominator of the yearbook tables and restriction of the analyses to comparable years also improve the validity of the temporal comparisons.
This study has several limitations. First, the analysis was based on aggregated repeated cross-sectional screening statistics; therefore, ecological fallacy is possible, and within-person changes, incidence, cumulative exposure, and causal pathways could not be assessed. Second, although direct age and sex standardization was performed, changes in screening eligibility and participation (e.g., the increase in examinees aged 20–39 years from 2019) may have altered the composition of examinees beyond age and sex. Third, individual-level behavioral, clinical, and socioeconomic factors, including diet, physical activity, smoking, alcohol use, medication use, income, education, and comorbidities, could not be accounted for. Fourth, screening participation bias may have affected the observed prevalence estimates because the data included only individuals who participated in the national health screening program.Fifth, only 9 annual observations (4 for lipid indicators) were available, time-series autocorrelation was not formally assessed, and because many individuals are screened repeatedly across years, the annual estimates were not independent; the reported confidence intervals and p-values are therefore likely to be too narrow. Finally, because of the 2018 change in the dyslipidemia screening schedule, lipid indicators could be compared only for 2014–2017. In addition, examinees aged ≤19 and 20–29 years represent restricted subsets of these age groups, so the estimates for these groups are not representative of the general population.
Future research should use denominators restricted to examinees who received the lipid panel when monitoring lipid indicators from screening statistics.
These findings have several public health implications. First, the increases in abdominal obesity and hyperglycemia suggest potential benefits of earlier cardiometabolic risk screening and lifestyle intervention, particularly from young adulthood through midlife. Second, the higher prevalence of abdominal obesity, hypertension, hyperglycemia, and hypertriglyceridemia among men suggests that workplace- and community-based prevention programs directed toward men in early and middle adulthood may warrant consideration. Third, the descriptive crossover patterns observed among older women for abdominal obesity and lipid-related indicators support consideration of more proactive cardiometabolic monitoring before and after the menopausal transition. Finally, surveillance systems should continue to monitor individual MetS components while explicitly documenting changes in screening participation, reporting procedures, and institutional rules that could affect temporal comparability.