
Articles
- Page Path
- HOME > Osong Public Health Res Perspect > Volume 2(2); 2011 > Article
-
Original Article
Plasma Calcium and Risk of Hypertension: Propensity Score Analysis Using Data From the Korean Genome and Epidemiology Study - Jong Wook Kima,b, Kwang-Pil Koa,c, Hee Jo Kooa, Younjhin Ahna, Seon-Joo Parka, Hyo-Mi Kima, Yeonjung Kima, Sung Soo Kima
-
Osong Public Health and Research Perspectives 2011;2(2):83-88.
DOI: https://doi.org/10.1016/j.phrp.2011.07.004
Published online: August 2, 2011
aDivision of Epidemiology and Health Index, Korea National Institute of Health, Osong, Korea
bDepartment of Gastroenterology, Asan Medical Center, Seoul, Korea
cDepartment of Preventive Medicine, Gachon University of Medicine & Science, Incheon, Korea
- ∗Corresponding author. ksungsoo@korea.kr
• Received: April 6, 2011 • Revised: June 15, 2011 • Accepted: July 12, 2011
© 2011 Published by Elsevier B.V. on behalf of Korea Centers for Disease Control and Prevention.
This is an Open Access article distributed under the terms of the Creative Commons Attribution Non-Commercial License (http://creativecommons.org/licenses/by-nc/3.0) which permits unrestricted non-commercial use, distribution, and reproduction in any medium, provided the original work is properly cited.

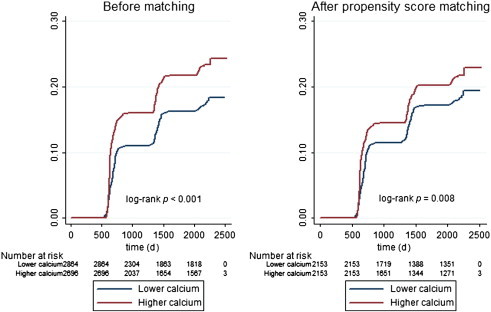
Figure & Data
References
Citations
Citations to this article as recorded by 
- Hypocalcemia is associated with severe COVID-19: A systematic review and meta-analysis
Januar Wibawa Martha, Arief Wibowo, Raymond Pranata
Diabetes & Metabolic Syndrome: Clinical Research &.2021; 15(1): 337. CrossRef - Plasma total calcium concentration is associated with blood pressure and systemic vascular resistance in normotensive and never-treated hypertensive subjects
Lasse Oinonen, Jenni Koskela, Arttu Eräranta, Antti Tikkakoski, Mika Kähönen, Onni Niemelä, Jukka Mustonen, Ilkka Pörsti
Blood Pressure.2020; 29(3): 137. CrossRef - Hipercalcemia como causa de hipertensión arterial presentación de un caso
Carlos Harrison Gómez, Derek Harrison Ragle, Francisco Sánchez Lezama, Adalberto Arceo Navarro, Víctor Manuel Arredondo Arzola, Luis Gerardo Domínguez Carrillo
Atención Familiar.2017;[Epub] CrossRef
 PubReader
 Cite
Cite


