Introduction
Chronic low-grade inflammation disrupts homeostasis and is closely associated with the development of various chronic diseases, including cardiovascular disease, diabetes, hypertension, and stroke [
1,
2]. Emerging evidence indicates that chronic inflammatory states are associated not only with poorer overall health but also with reduced quality of life. For example, studies of patients with metabolic syndrome have shown that higher concentrations of high-sensitivity C-reactive protein (CRP) are significantly associated with lower health-related quality of life, as measured using the EuroQol-5 Dimensions (EQ-5D) index [
3,
4]. These findings suggest that individuals with elevated inflammatory burden tend to perceive their physical and mental health more negatively. However, routine measurement of hematological indicators, such as CRP or interleukins (ILs), which are needed to assess systemic inflammation more directly, is challenging in the general population.
The lifestyle inflammation score (LIS) was developed to address these limitations. This score integrates lifestyle factors associated with systemic inflammation, including smoking, alcohol consumption, physical activity, and body mass index (BMI), using a weighted approach [
5]. The LIS provides a comprehensive estimate of the inflammatory potential of an individual’s lifestyle behaviors, with higher scores indicating a greater tendency toward pro-inflammatory behaviors [
5]. By estimating inflammation-related risk without requiring blood testing, the LIS serves as a practical tool for population-level health assessment [
6,
7].
Depression is associated with alterations in neuroendocrine and immune function, including hyperactivation of the stress response, elevated cortisol secretion, and autonomic nervous system imbalance. These changes may contribute to elevated inflammatory cytokine levels and enhanced systemic inflammatory responses [
8,
9]. Individuals with high levels of depressive symptoms tend to have elevated levels of inflammatory markers, such as CRP and IL-6 [
10,
11]. These physiological changes have also been associated with cardiovascular disease, metabolic abnormalities, chronic pain, and reduced quality of life [
8,
10].
Quality of life is a multidimensional indicator that encompasses an individual’s perceived physical, mental, and social well-being. The EQ-5D assesses quality of life across 5 domains: mobility, self-care, usual activities, pain/discomfort, and anxiety/depression [
12]. Previous studies have indicated that individuals with chronic inflammatory diseases or unhealthy lifestyle behaviors tend to have a lower quality of life, with consistent associations reported between inflammatory physiological responses and reduced quality of life [
3,
13].
Based on this evidence, this study hypothesized that higher LIS scores would be associated with a lower EQ-5D index. The study also hypothesized that depressive symptoms, measured using the Patient Health Questionnaire-9 (PHQ-9), would moderate this relationship [
14]. Specifically, individuals with both higher LIS scores and depressive symptoms were expected to show a stronger negative association between LIS and the EQ-5D index, potentially reflecting overlapping physiological and psychological burdens.
This study used data from the 2024 Korea Community Health Survey (KCHS) to investigate the association between LIS and the EQ-5D index. First, the main association between LIS and the EQ-5D index was assessed to examine the relationship between inflammation-related lifestyle behaviors and quality of life. Second, the association between depressive symptoms, assessed using the PHQ-9, and the EQ-5D index was examined. Third, the interaction between LIS and PHQ-9 was analyzed to determine whether depressive symptoms moderated the association between LIS and quality of life.
Through this stepwise analysis, the study examined whether depressive symptoms were associated with a stronger negative LIS–EQ-5D association and sought to provide evidence that may inform future population health research addressing both mental health and lifestyle behaviors.
Materials and Methods
Data Sources
This study used raw data from the 2024 KCHS, conducted by the Korea Disease Control and Prevention Agency (KDCA). The 2024 KCHS was a cross-sectional survey that used a complex sampling design to represent the adult population of the Republic of Korea across all cities, counties, and districts. Data were collected by trained interviewers using computer-assisted personal interviewing from May 16 to July 31, 2024 [
15].
Among 231,728 respondents, 342 individuals with missing data on LIS, stress, diabetes, or hypertension were excluded by listwise deletion, yielding a final analytic sample of 231,386 participants. Survey weights and design variables provided by the KCHS were applied to produce estimates representative of the national adult population.
The study protocol was approved by the relevant institutional review board, which waived the requirement for additional informed consent because only de-identified secondary data were used. All methods adhered to the Declaration of Helsinki and relevant guidelines and regulations.
Variables
Dependent variable
The EQ-5D index was calculated using KDCA-specific quality weights [
16]. The instrument assesses 5 domains: mobility, self-care, usual activities, pain/discomfort, and anxiety/depression. Respondents who reported “some problems” (level 2) or “severe problems” (level 3) in any domain were assigned the corresponding domain- and level-specific penalty coefficients: M2, M3, SC2, SC3, UA2, UA3, PD2, PD3, AD2, and AD3. If any domain was rated as “severe problems” (level 3), an additional penalty corresponding to the N3 term was applied. The final EQ-5D index was calculated as 1 minus the sum of penalties, with values closer to 1 indicating better overall health-related quality of life [
12].
The EQ-5D index was calculated using the following formula:
Independent variables
The primary independent variable was the LIS, which integrates 4 lifestyle factors: alcohol consumption, physical activity, smoking, and BMI. The LIS quantifies the overall extent to which an individual’s lifestyle behaviors may contribute to systemic inflammatory responses. Each component was scored so that behaviors that induce or exacerbate inflammation received higher scores. The final LIS was calculated by applying weights to these component scores and summing them [
5]. Each lifestyle factor was dummy-coded, with “1” assigned to the exposed or high-risk category and “0” assigned to the unexposed or reference category.
Heavy alcohol consumption, defined as more than 8 drinks per week for men and more than 4 drinks per week for women, induces oxidative stress during the metabolism of ethanol to acetaldehyde, thereby triggering inflammatory responses [
17]. In contrast, moderate alcohol intake, defined as 8 or fewer drinks per week for men and 4 or fewer drinks per week for women, may reduce pro-inflammatory free fatty acids through acetate, a byproduct of ethanol metabolism. Moderate intake has also been reported to increase adiponectin levels while suppressing IL-6 signaling pathways, thereby exerting anti-inflammatory effects [
18].
Physical activity, assessed using International Physical Activity Questionnaire criteria [
19], enhances antioxidant defense, increases anti-inflammatory cytokine levels, and reduces vascular inflammation [
20]. Because the weekly frequency of physical activity could not be directly derived for the LIS calculation, metabolic equivalents per week were categorized into quantiles to construct dummy variables and apply the corresponding weights. This approach was used as a proxy for relative activity level because the original LIS definition based on weekly frequency could not be directly derived from the KCHS variables.
Current smokers, including users of cigarettes, heated tobacco products, and e-cigarettes, are exposed to toxins that damage tissues and upregulate cytokines and acute-phase reactants. These processes contribute directly to increased systemic inflammatory responses [
21].
Obesity status, defined according to Korean criteria as overweight (BMI, 23–24.9 kg/m
2) or obesity (BMI ≥25 kg/m
2), promotes adipose tissue production of pro-inflammatory adipokines, such as plasminogen activator inhibitor-1 and tumor necrosis factor-α. Adipokine production is a key driver of chronic low-grade inflammation [
22].
The LIS component criteria were partially converted and classified according to Korean standards. One standard drink contains 14 g of alcohol, corresponding to 350 mL of draft beer, 300 mL (1 bowl) of rice wine, 150 mL of wine, 94 mL (1/4 bottle) of 19% soju, or 45 mL (1 shot) of whisky [
23]. Because this study targeted adults in the Republic of Korea, Korean BMI criteria were applied.
The LIS was calculated as follows:
Moderator variables
Depressive symptoms were measured using the PHQ-9 items included in the KCHS. The PHQ-9 assesses depression-related symptoms experienced during the previous 2 weeks. It comprises 9 items: loss of interest or pleasure, depressed mood, sleep problems, fatigue, appetite changes, feelings of worthlessness or guilt, difficulty concentrating, psychomotor agitation or retardation, and suicidal thoughts. Although the EQ-5D includes a single anxiety/depression domain, the PHQ-9 was included as a moderator to capture depressive symptom severity across multiple domains. Each item is rated on a 4-point scale ranging from “not at all true” (1 point) to “nearly every day” (4 points). In this study, 1 point was subtracted from each original item score to convert the scale to 0–3, and the 9 item scores were summed to calculate the total PHQ-9 score. Total scores therefore ranged from 0 to 27 points, with higher scores indicating more severe depressive symptoms [
24].
Depressive symptom status was classified according to criteria established in prior studies: a total PHQ-9 score of ≥10 indicated depressive symptoms, whereas scores of 0–9 indicated no depressive symptoms. The PHQ-9 cutoff of ≥10 has been validated in Korean adults and has demonstrated acceptable sensitivity and specificity for identifying depression [
25].
Control variables
Control variables included demographic, economic, and health-related factors. Demographic factors comprised sex and age, with age categorized into 4 KCHS-defined groups: 19–44, 45–64, 65–74, and ≥75 years. Economic factors included monthly household income, which was categorized into <1 million Korean won (KRW), 1–2.99 million KRW, and ≥3 million KRW.
Health-related factors comprised chronic diseases (diabetes and hypertension), mental health factors (perceived stress), sleep health factors (Pittsburgh sleep quality index [PSQI]), and healthcare accessibility (unmet medical needs). Stress was classified as present if respondents answered “I feel a lot of stress” or “I feel a great deal of stress” to the question, “How much stress do you generally feel in your daily life?” Sleep quality was assessed using the PSQI. The total PSQI score ranged from 0 to 21, with higher scores indicating poorer sleep quality. For analysis, total PSQI scores were categorized as “good” (0–5 points) or “poor” (≥6 points) [
26]. A PSQI cutoff of >5 has been validated in Korean adults and has demonstrated acceptable sensitivity and specificity for identifying poor sleepers [
27].
Statistical Analysis
The KCHS data were collected using a complex sampling design. Therefore, all analyses incorporated the KCHS survey design variables, including primary sampling units, sampling weights, and strata, to ensure national representativeness. Descriptive statistics for the general characteristics of the study participants were calculated using frequency analyses. To examine the association between LIS and the EQ-5D index, complex-sample multivariable linear regression analysis was performed, with depressive symptoms (assessed using the PHQ-9) included as a moderator to evaluate interaction effects. In addition, simple-slope marginal analyses were conducted according to depressive symptom status to compare the magnitude of the association between LIS and the EQ-5D index between groups. Binary variables were entered as dummy variables, whereas ordinal variables (e.g., age group and monthly household income) were treated as ordinal variables. Continuous variables were analyzed as continuous variables. Statistical analyses were performed using Stata/MP 18 software (StataCorp.), with the significance level set at 5% for 2-tailed tests.
Ethics Approval
The 2024 Korea Community Health Survey was conducted by the KDCA. The present study protocol was approved by the Yonsei University Mirae Institutional Review Board (IRB No: 1041849-202510-SB-225-01), which waived the requirement for additional informed consent because only de-identified secondary data were used. All methods followed the Declaration of Helsinki and relevant guidelines and regulations.
Results
General Characteristics of Participants
A total of 231,386 respondents were included in the analysis. The mean LIS was 0.35, and the mean EQ-5D index was 0.95 (
Table 1). According to the PHQ-9 criterion, 4.1% of participants were classified as having depressive symptoms. The distribution by sex was nearly equal, and the 45- to 64-year age group accounted for the largest proportion of participants. Participants with a monthly household income of ≥3 million KRW accounted for 71.0% of the sample. The prevalence of unmet medical needs was 4.6%, and the prevalence of perceived stress was 22.3%. The prevalence rates of hypertension and diabetes were 24.4% and 10.7%, respectively.
Association Between LIS and the EQ-5D Index
LIS was significantly and negatively associated with the EQ-5D index (β=–0.0069,
p<0.001); that is, higher LIS scores were associated with a lower EQ-5D index (
Table 2). Depressive symptoms were also significantly and negatively associated with the EQ-5D index (β=–0.1273,
p<0.001), indicating that participants with depressive symptoms had lower EQ-5D index scores than those without depressive symptoms.
Among demographic and health-related factors, the EQ-5D index was significantly lower among female participants, older adults, participants with unmet medical needs, those with perceived stress or poor sleep quality, and those with hypertension or diabetes. Monthly household income was positively associated with the EQ-5D index.
Multivariable Linear Regression of Factors Associated with the EQ-5D Index
In the multivariable linear regression model that included the interaction term, LIS remained significantly and negatively associated with the EQ-5D index (β=–0.00621,
p<0.001) (
Table 3). Depressive symptoms, defined as a PHQ-9 score ≥10, were also significantly and negatively associated with the EQ-5D index (β=–0.11834,
p<0.001). The LIS×PHQ-9 interaction term was statistically significant (β=–0.01727,
p<0.001), indicating that the association between LIS and the EQ-5D index was stronger among participants with depressive symptoms. When PHQ-9 was treated as a continuous variable, the interaction between LIS and PHQ-9 remained statistically significant and was consistent in direction, supporting the robustness of the moderation effect (
Table S1).
Among demographic and health-related factors, the EQ-5D index was significantly lower among female participants, older adults, participants with unmet medical needs, those with perceived stress or poor sleep quality, and those with hypertension or diabetes. Monthly household income showed a significant positive association with the EQ-5D index.
Comparison of LIS–EQ-5D Association Slopes by Depressive Symptom Status
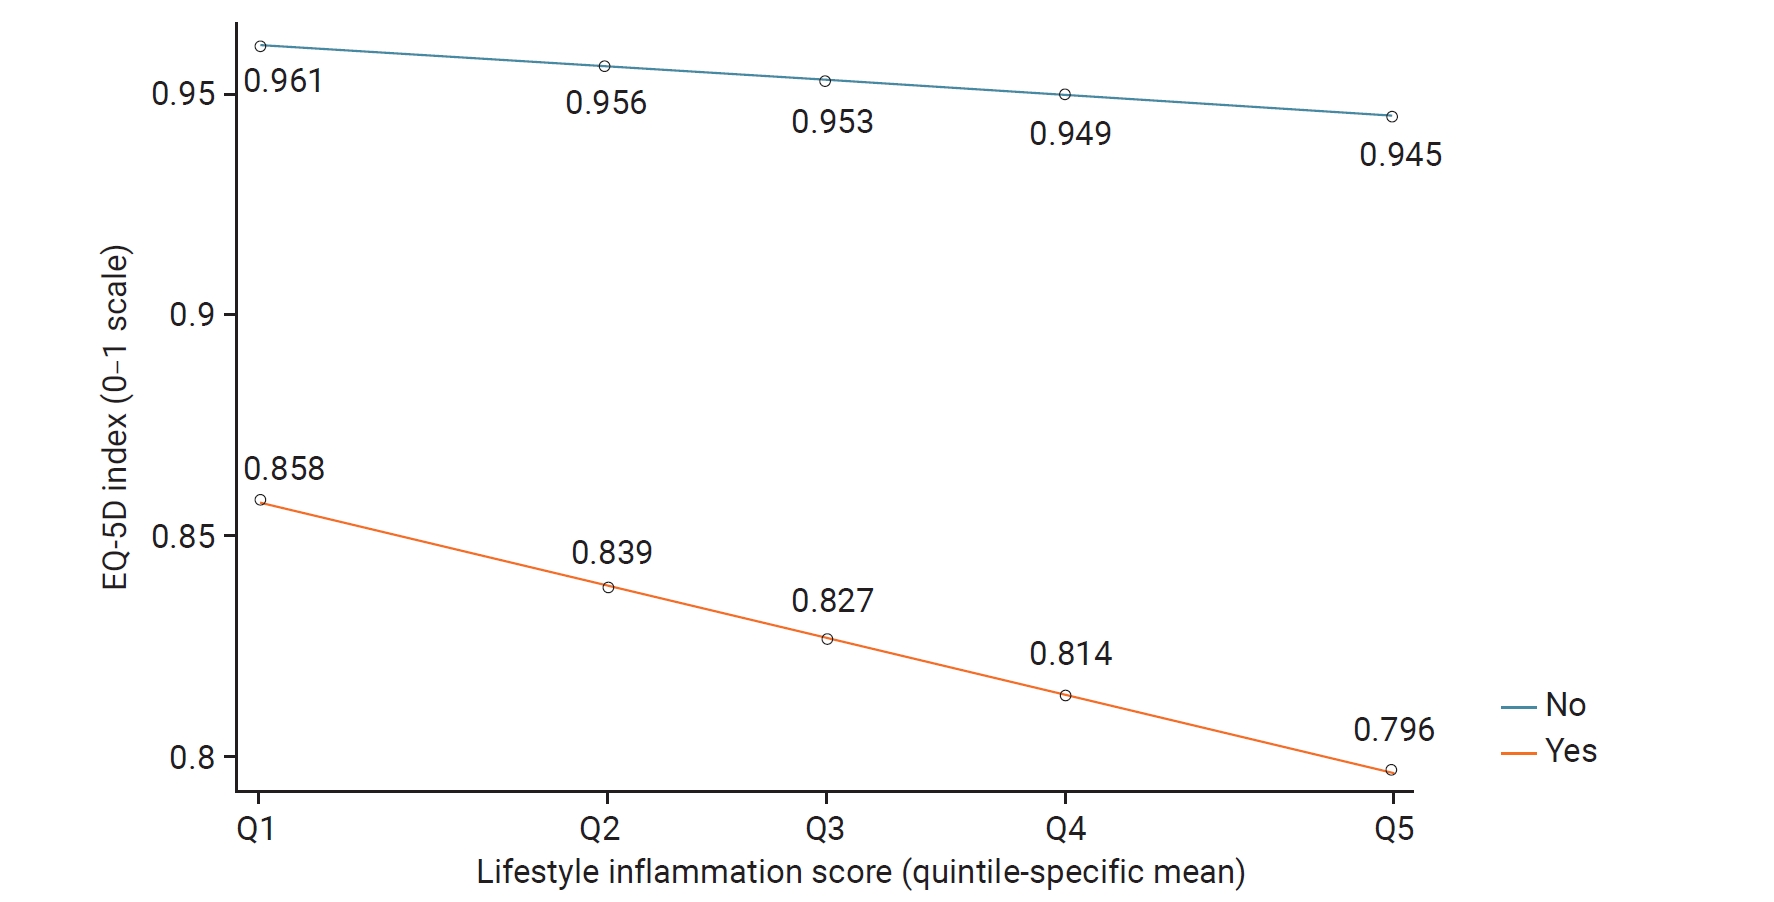
Simple-slope analysis indicated that the estimated slope for the association between LIS and the EQ-5D index was –0.02349 (
p<0.001) among participants with depressive symptoms and –0.00621 (
p<0.001) among participants without depressive symptoms (
Table 4). Thus, the negative association between LIS and the EQ-5D index was stronger among participants with depressive symptoms than among those without depressive symptoms, as illustrated in
Figure 1.
Discussion
This large community-based study found that LIS was significantly associated with a lower EQ-5D index and that this association differed according to depressive symptom status. The LIS, which integrates smoking, alcohol consumption, physical activity, and BMI, showed a consistent negative association with the EQ-5D index. This finding is consistent with previous evidence indicating that chronic inflammation adversely affects perceived physical and mental health and daily functioning [
3,
4], as well as recent population-based evidence showing that adverse lifestyle factors, such as poor sleep health, are associated with higher LIS levels [
28]. Notably, depressive symptoms emerged as a key factor moderating the relationship between LIS and the EQ-5D index [
8,
29,
30]. Among participants without depressive symptoms, the decrease in the EQ-5D index associated with higher LIS was relatively small, whereas among participants with depressive symptoms, this decrease was more pronounced. These results suggest that depressive symptoms are associated with a stronger relationship between inflammation-related lifestyle factors and health-related quality of life.
The moderating effect of depressive symptoms may be explained by both physiological and behavioral mechanisms. Although the EQ-5D includes an anxiety/depression dimension, this dimension is assessed using a single item within an overall quality-of-life measure, whereas the PHQ-9 provides a more comprehensive assessment of depressive symptom severity across multiple domains. Therefore, using the PHQ-9 as a moderator allowed a more detailed evaluation of how depressive symptom burden influenced the association between LIS and quality of life. Depression has been associated with hyperactivation of the hypothalamic–pituitary–adrenal axis, increased cortisol secretion, and disruption of autonomic nervous system balance, which may collectively promote systemic inflammatory responses [
31]. This physiological stress response is associated with elevated levels of inflammatory cytokines, such as CRP and IL-6, potentially increasing overall inflammatory burden [
32,
33]. The potential interplay between depressive symptom–related physiological changes and health behaviors may help explain why the negative association between inflammation-related lifestyle behaviors and quality of life was more pronounced among individuals with depressive symptoms, consistent with the statistically significant interaction between LIS and depressive symptom status, defined using the PHQ-9 cutoff, observed in this study.
These findings may have implications for public health and clinical practice. First, the LIS serves as an integrated indicator of the cumulative relationship between health behaviors and quality of life, suggesting its potential utility for identifying high-risk groups and informing lifestyle-based approaches. Second, depressive symptoms are associated with quality of life; in particular, individuals with both a higher LIS and depressive symptoms may experience a greater reduction in quality of life, suggesting that mental health assessment may be relevant when evaluating lifestyle-related inflammatory burden. Although this cross-sectional study did not evaluate interventions, the findings suggest that future studies should examine whether mental health management strategies influence the relationship between lifestyle-related inflammatory burden and quality of life [
34,
35]. Thus, considering mental health and lifestyle factors together may help explain population-level differences in quality of life.
Moreover, LIS remained significantly associated with the EQ-5D index after adjustment for mental health factors, including perceived stress, and chronic diseases, including hypertension and diabetes. This finding suggests that the association between LIS and quality of life was not fully explained by the variables included in the model.
This study has several strengths. First, it used a nationally representative sample and a complex sampling design, enhancing the generalizability of the results. Second, quality of life and depressive symptoms were measured using validated instruments with established reliability, including the EQ-5D and PHQ-9. Third, key potential confounders, including mental health factors, chronic diseases, and socioeconomic factors, were included in the models, strengthening the robustness of the observed associations with LIS.
However, this study also has several limitations. The mean EQ-5D index was relatively high, at approximately 0.95, suggesting a potential ceiling effect that may partly explain the small magnitude of the observed associations. The magnitude of the LIS coefficient was small on the EQ-5D scale and should therefore be interpreted cautiously, particularly at the individual clinical level. Nevertheless, given the large nationally representative sample and the stronger negative LIS–EQ-5D association among participants with depressive symptoms, these modest differences may still be relevant from a population health perspective.
The potential ceiling effect may have influenced the estimation of associations using linear regression. The cross-sectional design precludes causal inference, and reverse causality cannot be ruled out because individuals with a lower quality of life may be less motivated to maintain healthy behaviors, resulting in higher LIS scores. Future research should use longitudinal designs to clarify temporal sequences and causal pathways. In addition, the LIS weights were estimated based on previous findings and may not fully reflect population-specific inflammatory risks; therefore, their applicability to the Korean population should be validated in future research. Some LIS components were adapted to fit the KCHS data structure, which may limit comparability with the original LIS. Furthermore, because the LIS is based on self-reported health behavior data, underreporting of certain health-risk behaviors, such as smoking and alcohol consumption, is possible. Similarly, because the PHQ-9 is a self-report measure, future studies incorporating objective mental health assessments or biomarkers are warranted. Residual confounding may remain because information on other chronic conditions, detailed dietary factors, and broader psychosocial variables was not available in the KCHS. If these unmeasured factors are associated with both LIS and the EQ-5D index, the observed associations may have been overestimated or underestimated.
In addition, the modified LIS used in this study should be interpreted as a proxy measure of lifestyle-related inflammatory burden rather than as a direct biomarker-based measure of systemic inflammation. The construct validity of the modified LIS is conceptually supported by the inclusion of lifestyle components that represent distinct inflammation-related pathways, including smoking, alcohol consumption, physical activity, and BMI. The direction of the assigned weights was also consistent with prior biological evidence, with smoking and obesity contributing positive pro-inflammatory weights and physical activity contributing negative anti-inflammatory weights. Contextual relevance was further improved by using Korean-specific BMI cutoffs and standard drink definitions. Nevertheless, because inflammatory biomarkers such as CRP or IL-6 were not available in the KCHS, direct internal validation was not possible. Future studies should validate this modified LIS in populations in the Republic of Korea using biomarker-based data.
In conclusion, higher LIS scores were associated with lower quality of life, and this association was moderated by depressive symptoms. Addressing both lifestyle behaviors and mental health may be important, given their associations with overall well-being.