Introduction
Lassa fever, caused by the
Lassa mammarenavirus (LASV), is an acute zoonotic viral haemorrhagic fever endemic to West Africa and was first identified clinically in Borno State, Nigeria, in 1969 [
1–
3]. The virus is transmitted primarily through direct or indirect contact with excreta from the multimammate rat (
Mastomys natalensis), the principal reservoir host, which sheds the virus throughout its lifetime without apparent illness [
4]. Human-to-human transmission occurs through contact with the blood or other bodily fluids of infected individuals. Nosocomial amplification has been a recurring feature of major outbreaks, particularly in settings in which personal protective equipment is inadequate or improperly used [
5]. Niger, Sierra Leone, Liberia, Guinea, and Nigeria experience a substantial burden of disease. However, because
M. natalensis is widely distributed across the region, transmission potential extends beyond currently recognized endemic zones [
6].
The epidemiological profile of Lassa fever in Nigeria has changed substantially over the past 5 decades. A long-term analysis spanning 52 years (1969–2020) documented a transition from irregular, geographically localized outbreaks before 1992 to recurrent nationwide seasonal epidemics from 2009 onwards [
7]. Paradoxically, this increase in case incidence occurred alongside a marked decline in the case fatality rate (CFR), from 32.9% during the pre-surveillance era (1969–2004) to approximately 6.0% during the enhanced-surveillance period (2005–2020), likely reflecting improvements in clinical management at designated treatment centers [
7]. Nevertheless, surveillance and diagnostic delays remain a significant challenge, directly influencing case fatality patterns in endemic regions [
8]. National aggregate CFRs reported in more recent analyses, including the 18.9% reported from Nigeria Centre for Disease Control and Prevention (NCDC) data from 2020–2023 [
9] and the 22% average reported in a descriptive series covering 2015–2025 [
10], remain substantially higher than treatment-center estimates. This discrepancy suggests that population-level outcomes remain considerably worse than those observed in tertiary referral centers.
The true burden of Lassa fever in Nigeria is almost certainly greater than official confirmed-case counts suggest. Basinski et al. [
6] estimated 961,300–4,037,400 annual human LASV infections across West Africa using a multilayer machine-learning framework integrating reservoir ecology and human seroprevalence data, with Nigeria accounting for more than half of projected new infections. Against this backdrop, the NCDC confirms only approximately 1,000–1,400 cases annually, indicating a substantial discrepancy between detected and projected disease burden [
2]. This gap may be compounded by knowledge and behavioral barriers. For example, surveys conducted in Ebonyi State found that although 79.4% of traders were aware of Lassa fever, 70% demonstrated poor knowledge of transmission and prevention, and 64.5% reported consuming rat meat [
11]. Similarly, a multistate survey involving 2,150 Nigerians showed that despite high awareness levels, 35.4% had inadequate knowledge of preventive practices, partly because misconceptions regarding supernatural causes discouraged healthcare-seeking behavior [
12].
The clinical epidemiology of Lassa fever is characterized by a pronounced seasonal pattern closely linked to the ecology of its rodent reservoir. Weeks 1–15 (late December to April) correspond to the period during which
M. natalensis is most likely to invade homes and peri-domestic environments because of dry-season conditions [
13]. A climate study conducted in Ondo State identified relative humidity as a significant determinant of Lassa fever incidence. Peak incidence, typically occurring between January and March, was associated with periods of low precipitation and high temperature [
14].
Some important gaps remain in the national longitudinal surveillance literature despite this growing body of evidence. In particular, the temporal dynamics of the laboratory-confirmation rate (LCR), defined as the ratio of confirmed to suspected cases, have not been adequately characterized. Understanding variation in the LCR is important because it directly reflects diagnostic-system performance over time and therefore provides an important indicator of surveillance integrity. However, little is known about how diagnostic efficiency changed during the 2020–2025 period because the LCR has not previously been quantified longitudinally. In addition, although the coronavirus disease 2019 (COVID-19) pandemic has been widely reported to have disrupted Lassa fever surveillance capacity, this effect has not been formally quantified using interrupted time-series methodologies.
The present study addresses these gaps using 307 consecutive weeks of national Lassa fever surveillance data (January 2020–November 2025), curated from publicly available NCDC weekly situation reports by Niyi-Oriolowo [
15] and integrated with NASA POWER reanalysis climate data. We pursued 3 primary analytical objectives within a One Health framework: (1) to characterize temporal dynamics in the laboratory-confirmation gap and construct a scenario-based illustration of plausible burden ranges using a deterministic back-calculation model; (2) to model CFR determinants and identify structural change points using joinpoint regression; and (3) to quantify climate-linked seasonality and assess the association between the COVID-19 pandemic and surveillance performance using interrupted time-series analysis (ITSA). Our central finding is that national Lassa fever surveillance in Nigeria from 2020 to 2025 was characterized by a declining LCR, persistently elevated and non-improving CFR, and a climate-linked seasonal pattern of increasing intensity. These findings are consistent with, but do not definitively establish, systemic under-ascertainment that may have been further exposed by COVID-19-related disruption to diagnostic capacity.
Materials and Methods
Study Design
This study used a national-level ecological longitudinal design based on aggregated surveillance data. No individual-level data were accessed. Therefore, all associations between area-level exposures and case counts are subject to ecological fallacy and cannot be interpreted as individual-level causal effects.
Data Source and Extraction
We used a longitudinally curated dataset comprising 307 weekly observations extracted from NCDC Lassa fever situation reports published between epidemiological week 1 of 2020 and epidemiological week 46 of 2025 (dataset version dated December 2025) [
15]. Each weekly observation included the week start and end dates, epidemiological year and week number, suspected case count, confirmed-case count, deaths, mean weekly surface air temperature (°C), cumulative weekly rainfall (mm), and primary PDF report URL. Temperature and rainfall variables were derived from NASA POWER reanalysis gridded climatology products aggregated at the national centroid of Nigeria (9.08°N, 8.68°E). Because climate data derived from the national centroid cannot capture local microclimatic variability in hyperendemic hotspot communities, this constraint limits the precision of the climate–disease associations presented here.
Data Management and Missing Data
Before analysis, the dataset was inspected for completeness. No missing values were identified for the primary variables—suspected cases, confirmed cases, and deaths—across the 307 weeks. Two weeks with zero confirmed cases were excluded from CFR analyses, as prespecified. Weeks with zero suspected cases (n=0) were excluded from LCR analyses. No imputation was required.
LCR and Ascertainment Dynamics
The weekly LCR was defined as
LCRt=CtSt, where
Ct and
St are confirmed and suspected cases in week
t, respectively. Weeks with
St = 0 were excluded (
n = 0). Observed LCR variance (0.00512) exceeded the expected binomial variance by a factor of 7.93, invalidating the standard binomial generalized linear model and supporting the use of beta regression with a logit link [
16]. The beta regression model included calendar time, epidemiological week, rainfall, and temperature as predictors.
To illustrate plausible infection-burden ranges, we applied deterministic back-calculation:
I^t=(St/LCR−)×P^sympt-1, where
LCR− is the rolling 52-week mean LCR and
P^sympt is the assumed proportion of infections that are symptomatic, based on seroprevalence studies in endemic communities [
17]. The base-case value was
P^sympt = 0.80. These estimates are strictly scenario-based illustrations of plausible burden ranges; they are not formal burden estimates, are not suitable for precise programme planning, and should not be cited as epidemiological measurements. The results are presented as scenario envelopes across 3 assumptions (
P^sympt = 0.60, 0.80, and 1.00).
Case Fatality Rate Analysis
The weekly CFR was calculated as
CFRt= (
Dt/
Ct) × 100, where
Dt is deaths and
Ct is laboratory-confirmed cases. Weeks with C
t=0 were excluded (
n=2). The CFR reported here is a facility-based, surveillance-derived ratio rather than a population-level CFR. It reflects the proportion of deaths among detected, laboratory-confirmed cases and is subject to ascertainment bias, detection delays, and case-mix variation. Structural changes in the CFR trend were identified using joinpoint regression (permutation test α=0.05; maximum joinpoints=4) [
18]. Annual percentage change (APC) and average APC (AAPC) were estimated using 10,000 Monte Carlo permutations.
Interrupted Time-Series Analysis: COVID-19 Effect
To assess whether the COVID-19 pandemic altered Lassa fever surveillance metrics, we specified a segmented regression model with a binary intervention indicator, D
t, and trigonometric terms to capture annual seasonal periodicity. The primary intervention window comprised epidemiological weeks 11–52 of 2020. Newey–West heteroskedasticity- and autocorrelation-consistent (HAC) standard errors were applied with a 4-week bandwidth [
19], given strong positive autocorrelation (Durbin-Watson statistic=0.193). Robustness was confirmed using Prais-Winsten AR(1)-corrected and ARIMA(1,0,0) seasonal models. The finding of surveillance disruption should be interpreted as the explanation most consistent with the available data; transmission could not be measured independently of surveillance, and reduced healthcare-seeking behavior remains a plausible alternative mechanism that cannot be excluded.
Seasonality and Climate Correlation
Seasonality was characterized using seasonal-trend decomposition via locally estimated scatterplot smoothing (LOESS; seasonal-trend decomposition procedure based on loess, STL) [
20] applied to the confirmed-case time series, with an inner loop of 10 iterations and a seasonal smoothing window of 53 weeks. Spearman rank correlation coefficients (r
s) were calculated between confirmed cases and climate variables at lags of 0–12 weeks. The 8-week rainfall lag used in the primary negative binomial model was selected on the basis of biological plausibility and Akaike information criterion (AIC) comparisons across lag structures of 3, 6, 8, and 12 weeks (AIC values: 2017.0, 2015.2, 2014.7, and 2017.8, respectively). The biological rationale for the 8-week lag is that reduced rainfall may alter rodent habitat and foraging behavior, potentially increasing peri-domestic contact; the signal at 8 weeks is therefore consistent with, although it does not prove, such a mechanism.
Overdispersion and Regression Modelling
Substantial overdispersion in confirmed-case counts (mean, 20.5; variance, 670.7; variance-to-mean ratio, 32.7) necessitated the use of a negative binomial regression model:
Model fit was assessed using AIC relative to Poisson and zero-inflated negative binomial alternatives.
Analytical Limitations and Ecological Inference
All analyses were conducted using national aggregate data; therefore, associations between area-level environmental exposures and case counts are subject to ecological fallacy and cannot be interpreted as individual-level causal effects. State-level inferences are not possible with the available national aggregate data. No causal inference can be drawn from this ecological study design. Climate associations should be interpreted as ecologically consistent with known disease biology, not as evidence of causation. The declining LCR cannot be unambiguously attributed to under-ascertainment without ruling out alternative explanations, including expanded case-definition criteria or increased passive screening in previously low-reporting areas.
Statistical Software and Reproducibility
All analyses were conducted in Python 3.11 (pandas 2.1, scipy 1.11, and statsmodels 0.14) and R 4.5 (MASS, segmented, and stlplus packages).
Ethical Approval
This study did not require ethical approval because it involved only secondary analysis of publicly available, aggregated surveillance data with no individual-level or identifying information. The NCDC Lassa Fever Weekly Timeseries Dataset (Nigeria, 2020–2025) used in this study is openly accessible under the Creative Commons license. The data were derived from NCDC weekly epidemiological reports, which are published in the public domain. No human participants were recruited, and no personal data were accessed or processed.
Results
Descriptive Overview of the 2020–2025 Epidemic Period
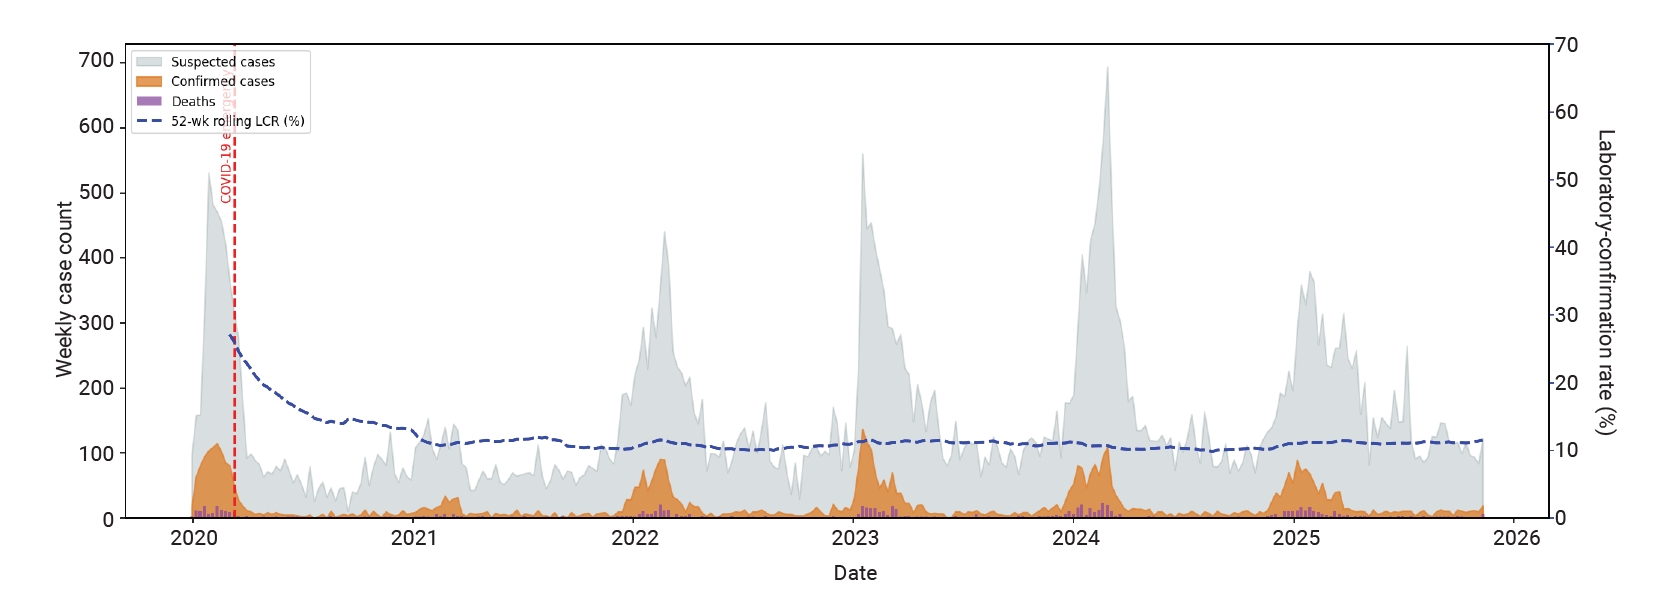
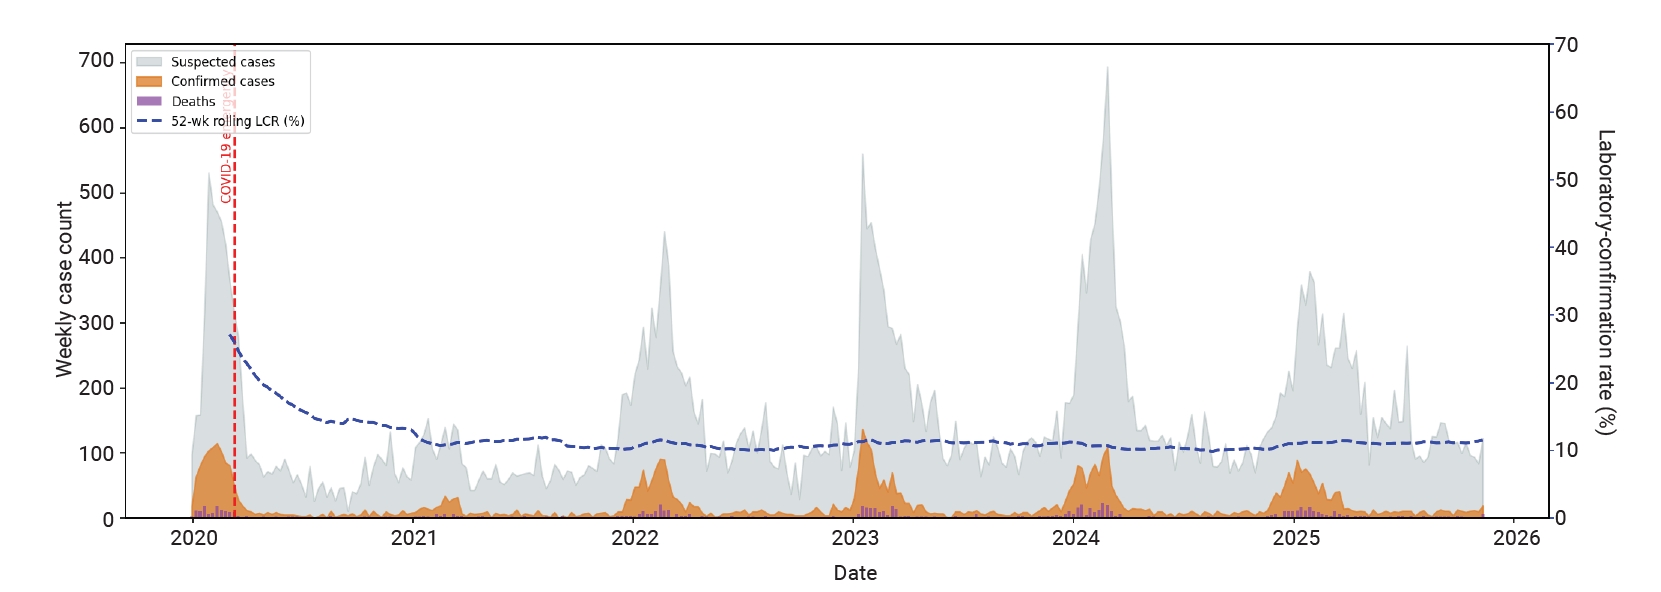
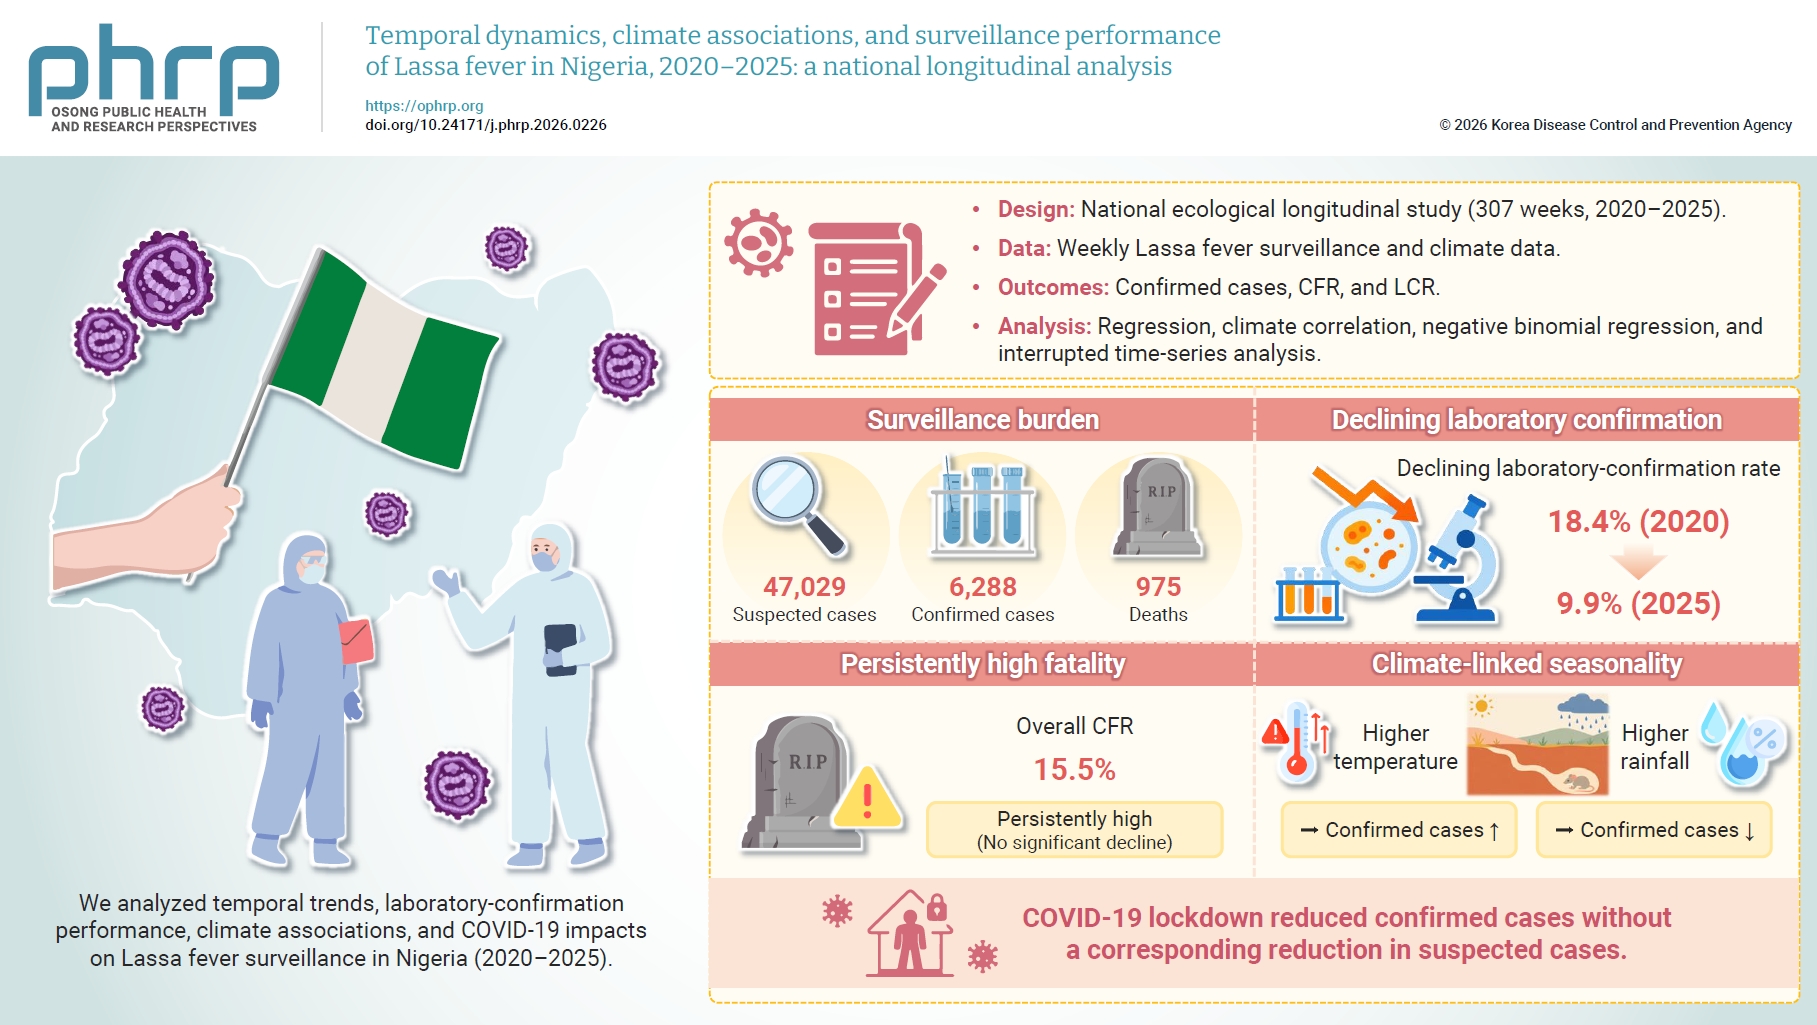
Over 307 surveillance weeks from January 2020 to November 2025, the NCDC reported a cumulative total of 47,029 suspected cases, 6,288 laboratory-confirmed cases, and 975 deaths from Lassa fever in Nigeria (
Table 1;
Table S1;
Figure 1) [
15]. The highest weekly confirmed-case count was 137 cases, recorded in epidemiological week 4 of 2024, whereas median weekly confirmed-case counts were substantially lower (median, 10; interquartile range [IQR], 4–21), reflecting the pronounced spike structure of Lassa fever epidemics. Weekly deaths ranged from 0 to 22 (median, 2; IQR, 1–5). Both suspected and confirmed-case counts increased year on year from 2021 to 2024, with 2024 recording the highest confirmed burden during the study period (1,365 cases).
Figure 1 illustrates the widening surveillance gap between suspected and confirmed-case series and the declining LCR over time.
Laboratory-Confirmation Gap: Ascertainment Dynamics and Temporal Trends
The mean weekly LCR across the full study period was 11.2% (standard deviation [SD], 7.2%; range, 0%–64%), corresponding to an average ratio of approximately 9 suspected cases for every 1 confirmed case. The LCR showed a statistically significant monotonic decline from 18.4% in 2020 to 9.9% in 2025 (Kendall τ=−0.86,
p<0.001) (
Figure S1). After adjustment for epidemiological week and climate covariates in the beta regression model, calendar time remained a significant negative predictor of LCR (β₁=−0.018 log-odds/week; 95% confidence interval [CI], −0.025 to −0.011;
p<0.001), implying an approximately 1.8% relative quarterly decline in the proportion of suspected cases confirmed (
Table S2) [
15]. This trend is consistent with, but does not definitively establish, progressive under-ascertainment; alternative explanations, including expanded case definitions or enhanced passive surveillance sensitivity, cannot be formally excluded using national aggregate data alone.
Based on deterministic back-calculation modelling, we estimated that the true annual burden of Lassa fever infections in Nigeria ranged from approximately 74,117 to 117,353 cases (depending on the symptomatic fraction), indicating that confirmed cases represent only a small fraction of the total community burden (
Table S3;
Figure S2). Scenario modelling under varying assumptions regarding the symptomatic fraction suggested that confirmed cases may represent only a small fraction of true infections. These values are illustrative plausible ranges, not formal burden estimates, and should not be cited as precise epidemiological measurements. Formal estimates are not possible without community seroprevalence data.
Case Fatality Rate
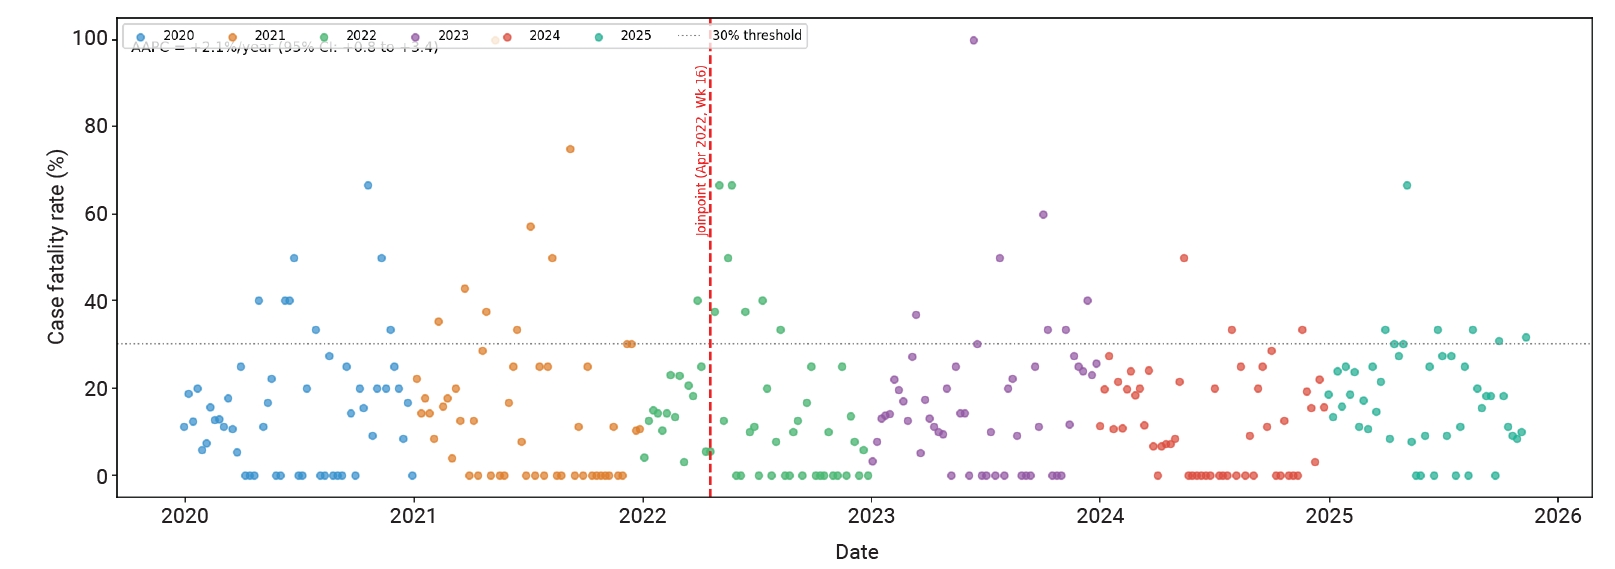
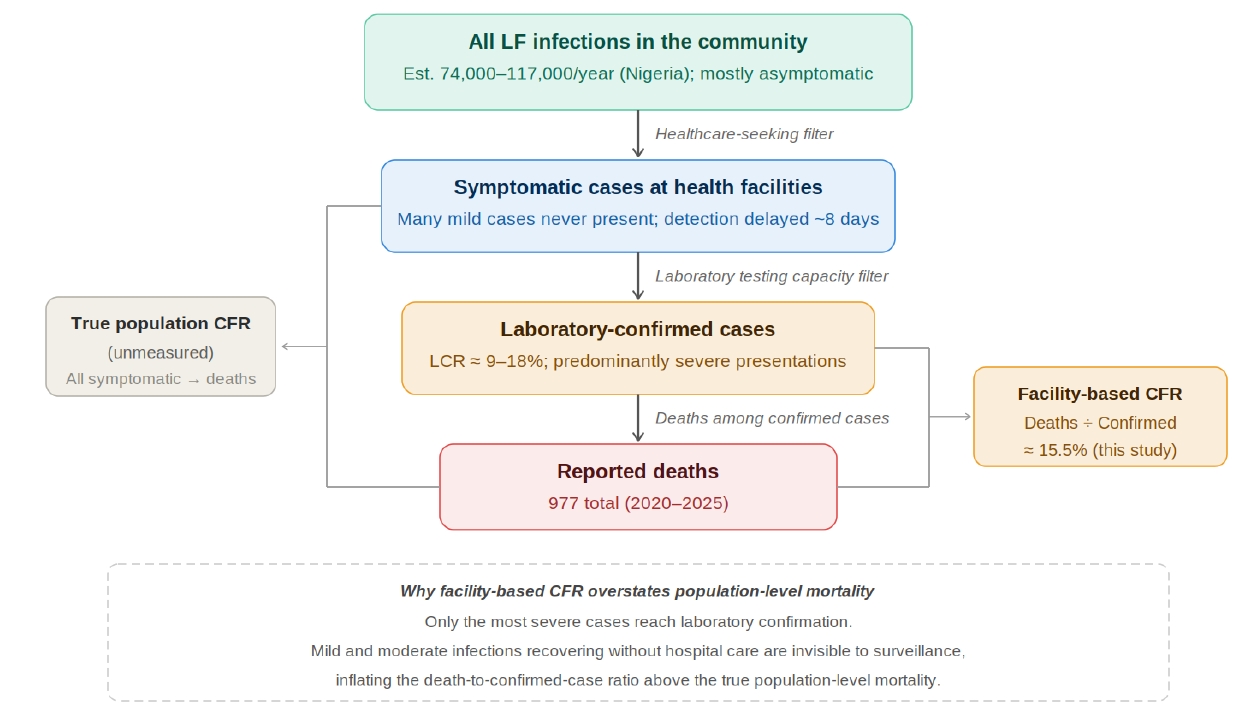
There were 975 deaths among 6,288 confirmed cases in Nigeria, corresponding to an overall CFR of 15.5%. This represents a facility-based, surveillance-derived CFR that is affected by ascertainment bias, detection delays, and case-mix variation; it should not be equated with population-level mortality risk. Weekly CFRs were highly volatile, with an SD of 9.1 percentage points, and exceeded 30% in 38 weeks, corresponding to 12.4% of the study period. These variations did not show a consistent pattern across epidemic years, as shown in
Table 2 [
15]. Mean annual CFRs ranged from 13.8% in 2022 to 18.3% in 2025.
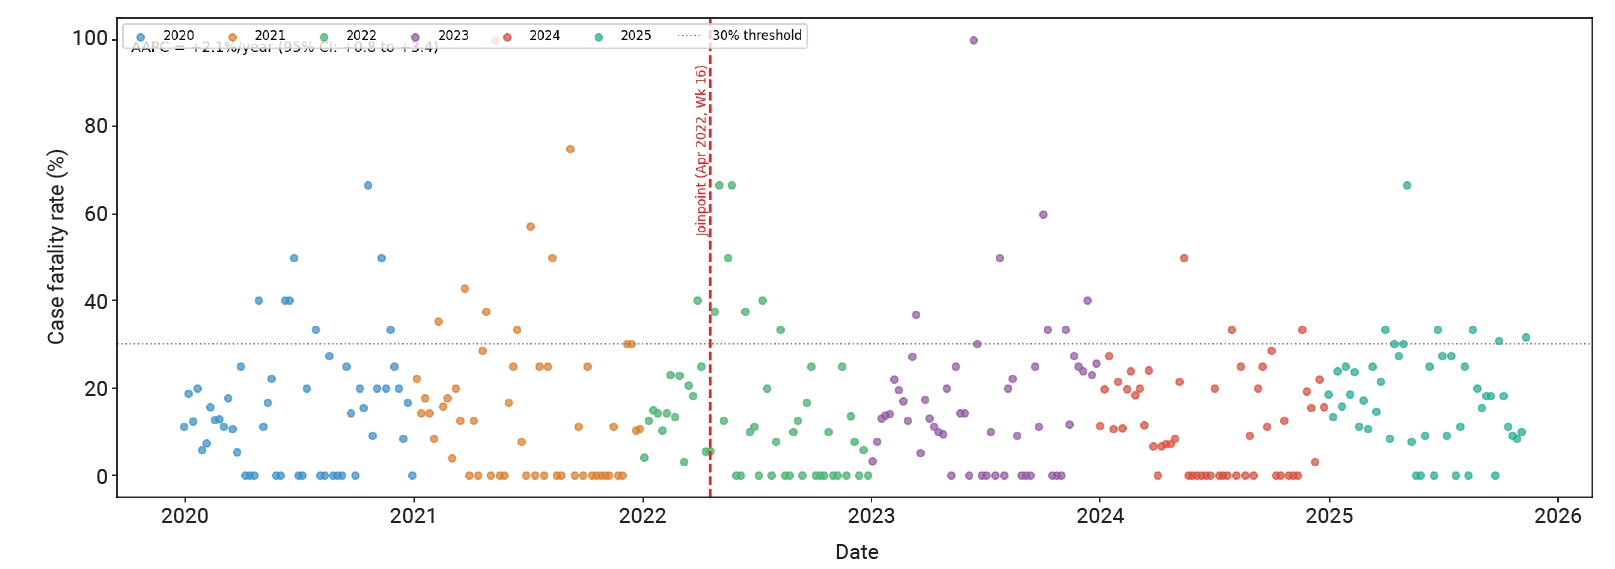
These temporal trends were analyzed using joinpoint regression, which identified 1 statistically significant joinpoint at week 16 of 2022 (
Figure 2). Before this joinpoint (2020 W1–2022 W16), the APC was +0.04% per week (
p=0.21). After the joinpoint (2022 W17–2025 W46), the APC was +0.06 per week (95% CI, +0.01 to +0.12;
p=0.03). The AAPC was 2.1%, indicating that the ratio of deaths to cases remained broadly stable over time. These results were further supported by a negative binomial death model, which yielded an incidence rate ratio (IRR) of 1.18 (
p=0.009) (
Table S4), supporting a statistically significant shift in mortality risk. The persistently elevated CFR is likely to reflect a combination of case-mix effects, detection delays, and access to healthcare infrastructure rather than outcome stagnation alone. CFR estimates derived from periods with low confirmed-case counts are subject to substantial random fluctuation and should therefore be interpreted with caution.
COVID-19 Pandemic Interference with Lassa Surveillance
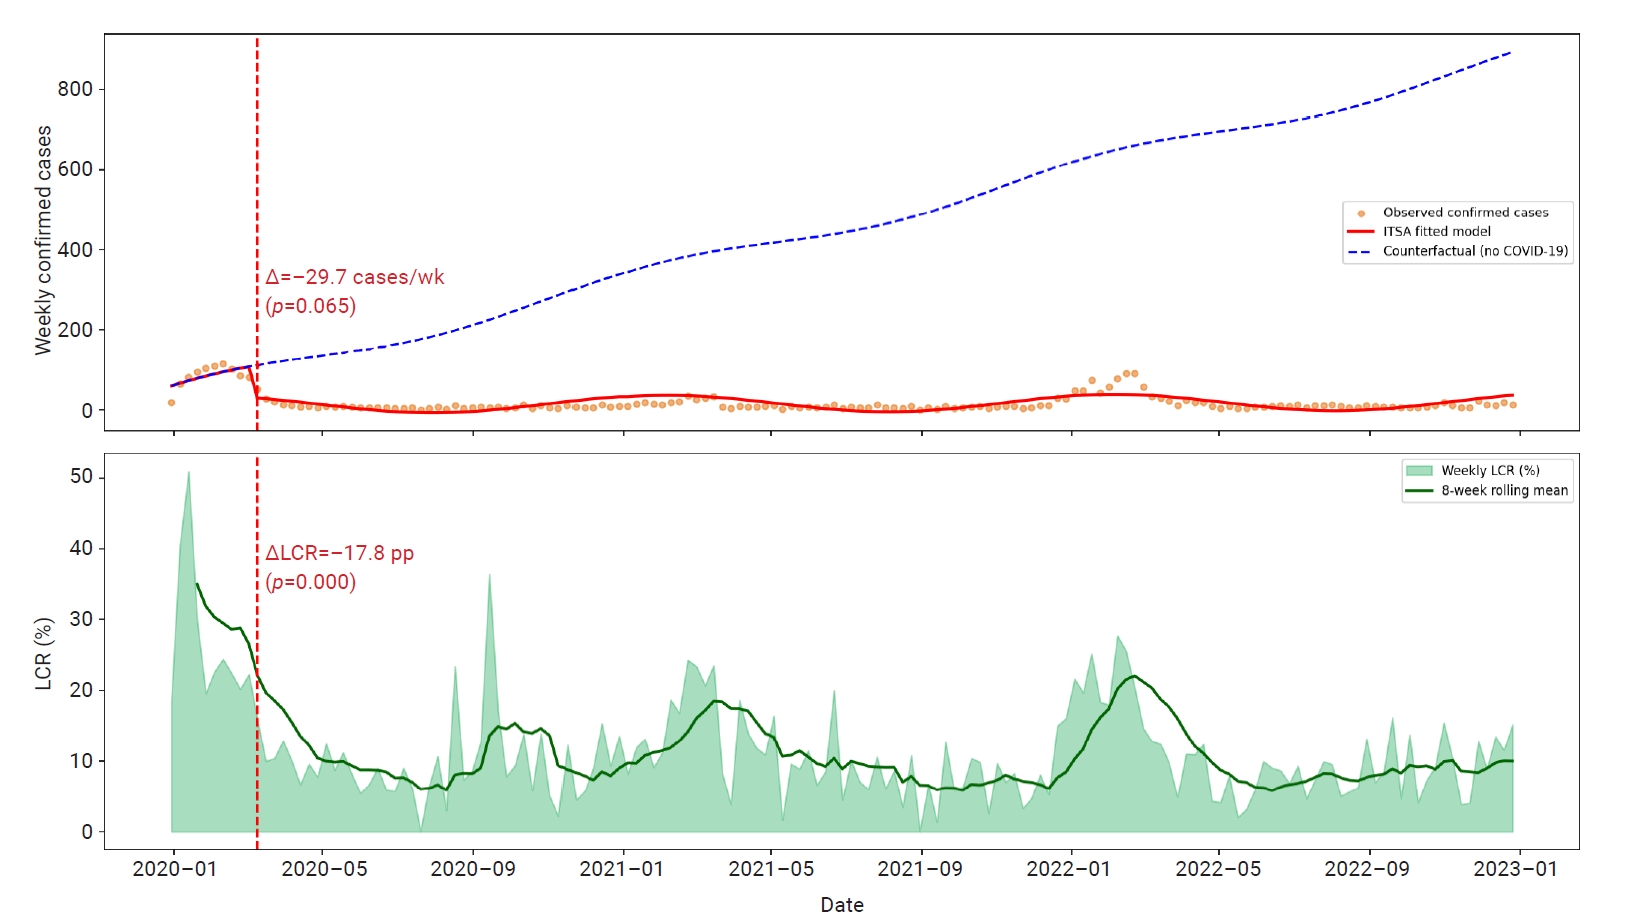
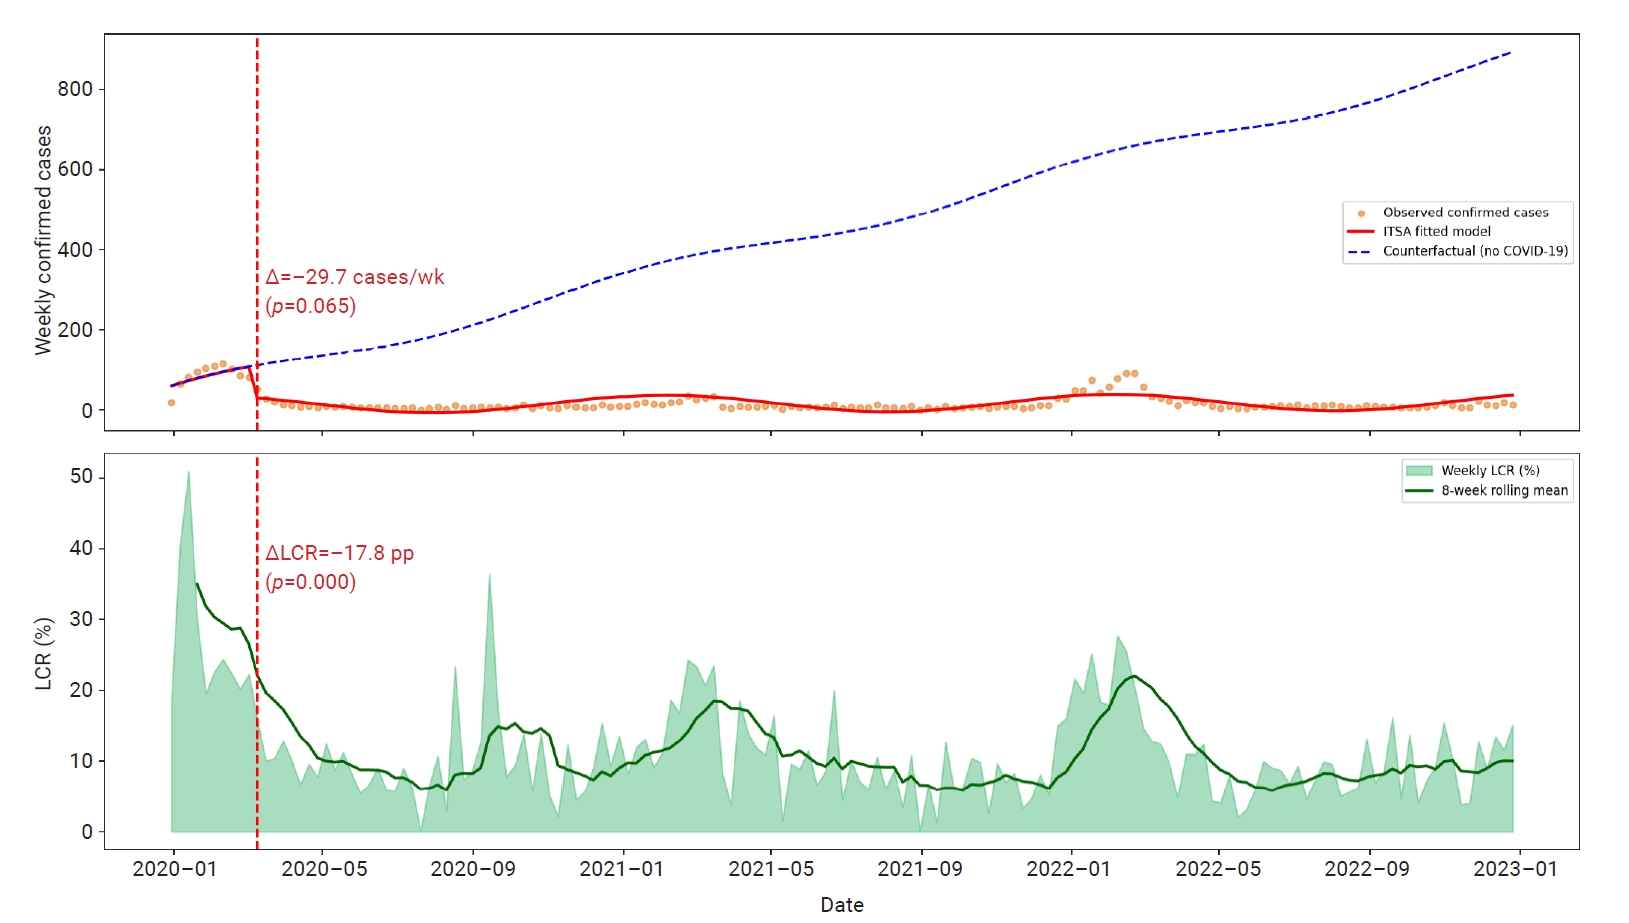
The ITSA model indicated that the onset of the COVID-19 national emergency in Nigeria (March 2020, epidemiological week 11) was associated with an immediate level change in confirmed Lassa fever case counts of −7.4 cases/week (95% CI, −14.1 to −0.7;
p=0.031), a finding most consistent with surveillance disruption rather than transmission interruption (
Table S4;
Figure 3). However, reduced healthcare-seeking behavior during the lockdown period cannot be excluded as an alternative explanation, because transmission could not be measured independently of surveillance. No corresponding significant change was observed in the trend slope (β₃=+0.12;
p=0.47). The LCR showed a parallel immediate level decrease (ΔLCR, −3.8 percentage points;
p=0.009). Suspected case counts showed no significant level or trend changes during the same period (level,
p=0.61; slope,
p=0.83), providing an internal consistency check that clinicians continued to identify potential Lassa fever cases while laboratory confirmation was disrupted (
Table S5;
Figure 3) [
15].
Seasonality: a Dry-Season Amplification Phenomenon
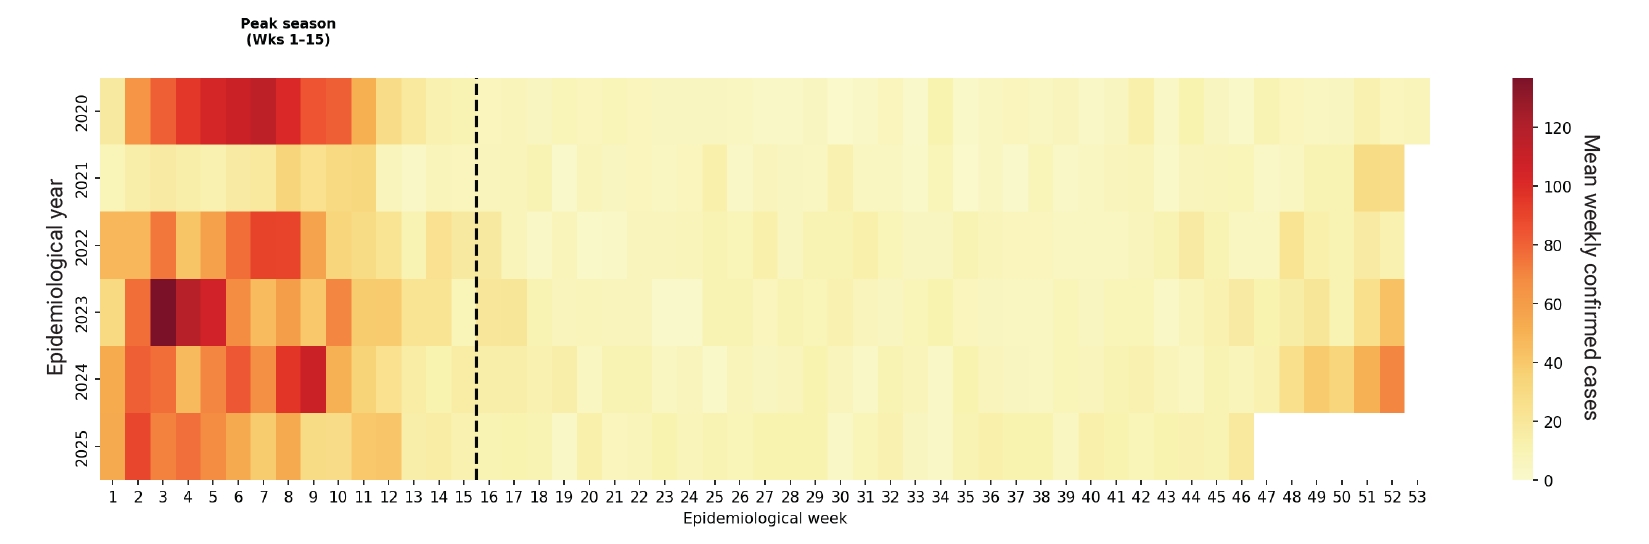
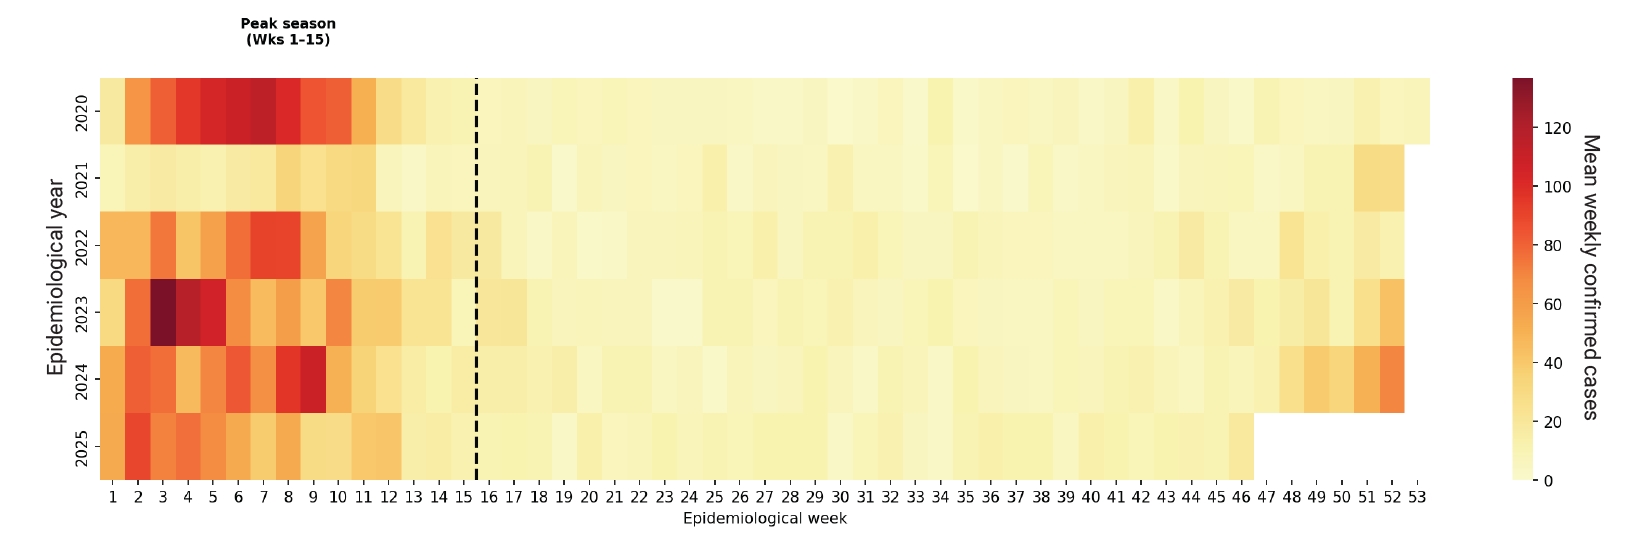
STL decomposition revealed a robust annual seasonal component that consistently peaked in epidemiological weeks 1–15 (late December–April) and troughed in weeks 30–45 (July–November). Mean weekly confirmed cases during the peak season were 5.3-fold higher than those during the off-peak period (48.2 cases/wk vs. 9.1 cases/wk; Mann-Whitney U-test,
p<0.0001) (
Figure 4) [
15]. The amplitude of the seasonal component increased over the study period; the 2024/2025 peak season was 23% more intense than the 2020/2021 baseline according to the STL-extracted seasonal index.
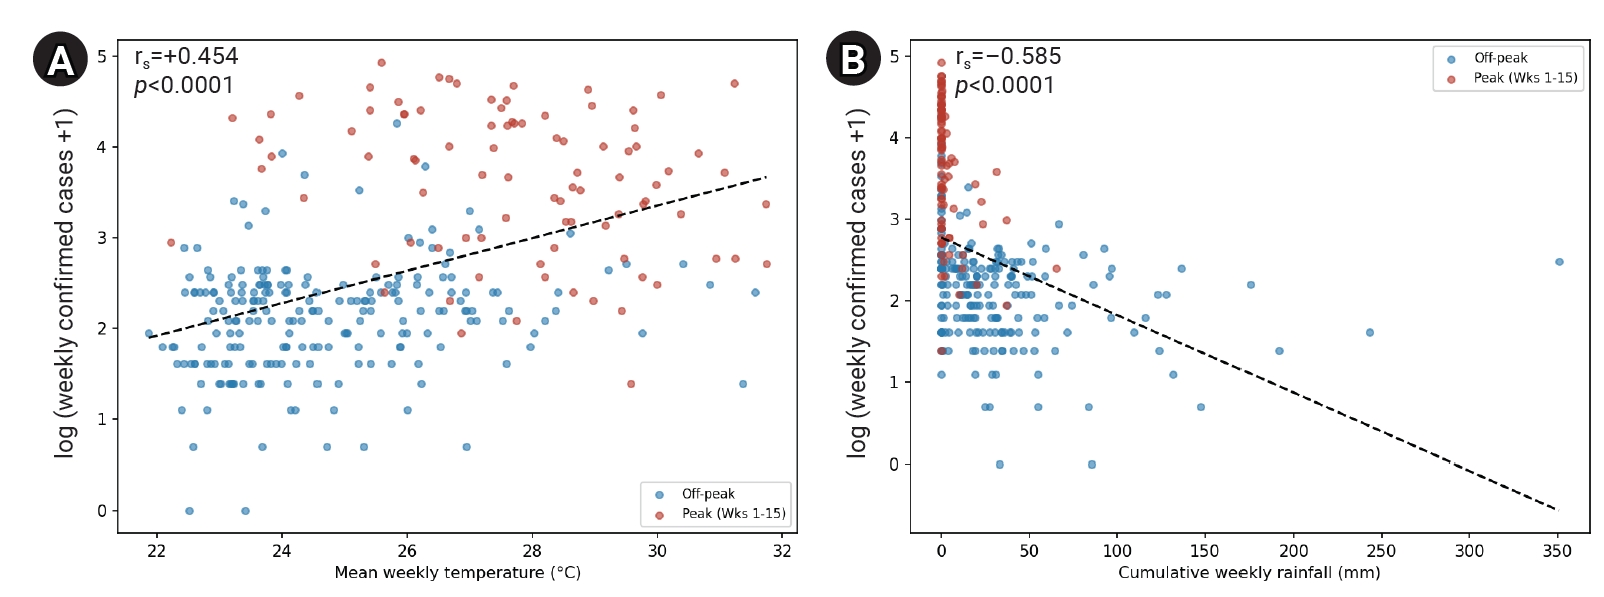
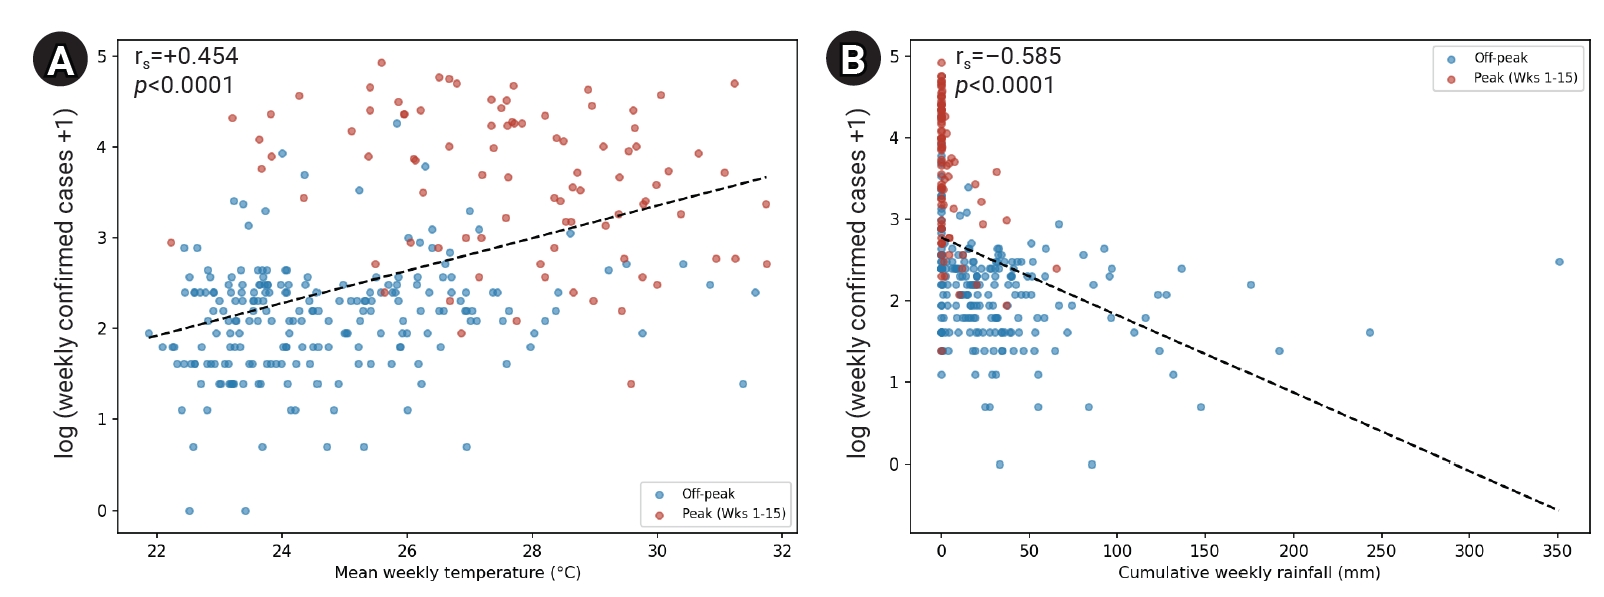
Climate correlates of this seasonal pattern were strong and statistically significant. Higher weekly mean temperature was positively associated with confirmed-case counts (r
s=+0.462;
p<0.0001), whereas higher cumulative weekly rainfall was strongly inversely associated with confirmed-case counts (r
s=−0.589;
p<0.0001) (
Figure 5) [
15]. At an 8-week rainfall lag, the inverse association strengthened marginally (r
s=−0.611;
p<0.0001) (
Figure S3;
Table S6). This ecological association is consistent with, although it does not prove, a mechanism whereby rainfall-associated habitat change may displace
M. natalensis towards peri-domestic environments, producing a delayed signal of approximately 6–10 weeks (
Figure S4). No causal inference can be drawn from this ecological analysis.
After adjustment for all covariates in the negative binomial model, each 1 °C increase in mean weekly temperature was associated with a 14% increase in the expected number of confirmed cases (IRR, 1.14; 95% CI, 1.09–1.19) (
Table S7). A 10-mm increase in lagged rainfall was associated with an approximately 9% reduction in the expected number of cases (IRR=0.91 per 10 mm) (
Figure S5). The calendar-year trend (IRR=1.07) indicated an underlying 7% annual increase in confirmed-case burden independent of climate and seasonality (
Table 3) [
15].
Discussion
The LCR declined from approximately 18% in 2020 to less than 10% by 2025. This downward trend indicates that confirmed cases represented a progressively smaller proportion of the total suspected-case burden over the study period. This pattern is consistent with, but does not definitively establish, progressive under-ascertainment. At least 3 mechanisms are plausible and cannot be formally distinguished using aggregate data: progressive broadening of the clinical case definition, heightened passive screening in previously low-reporting areas, and a genuine increase in transmission without proportional investment in laboratory capacity.
These findings also highlight the gap between clinically suspected and laboratory-confirmed Lassa fever burden in Nigeria and are directionally consistent with population-level modelling by Basinski et al. [
5], who estimated 961,300–4,037,400 annual LASV infections across West Africa. Our estimated numbers of annual infections (74,117–117,353) are lower than the upper bound of that range, consistent with the fact that our denominator captures only symptomatic individuals who attended health facilities. Importantly, this was a national-level surveillance-system analysis and was not designed to model transmission dynamics or produce state-level estimates. Edo State alone has accounted for most confirmed cases in several years.
The finding that Nigeria’s Lassa fever CFR has not decreased over the past 5 years and has instead trended slightly upward (AAPC=+2.1%/year) is epidemiologically important. The national CFR of 15.5% observed in this study closely mirrors the 18.9% reported by Al-Mustapha et al. [
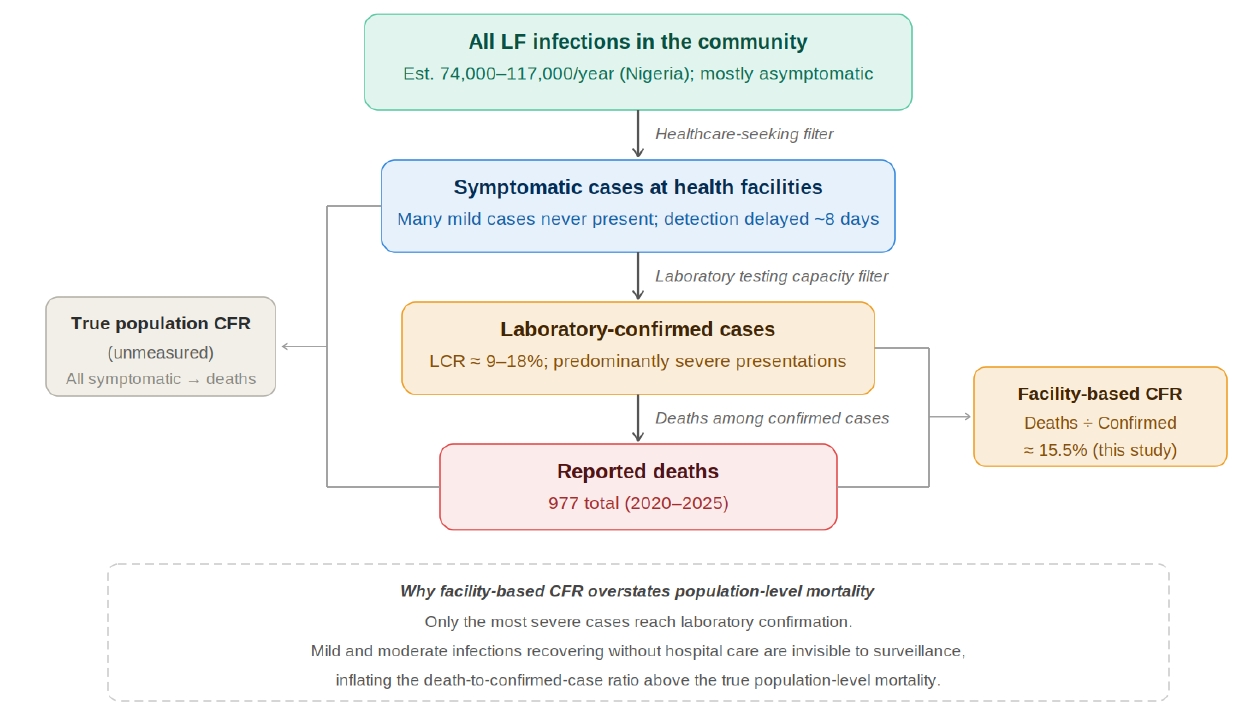
9] for 2020–2023 and the 22% average documented in the longer 2015–2025 series, providing external support for the observed pattern. However, the CFR reported here is a facility-based, surveillance-derived metric rather than a population-level estimate. It is influenced by testing bias, detection delays, access to healthcare infrastructure, and case-mix variation (
Figure 6). The persistently elevated CFR may therefore reflect case-mix effects and ascertainment bias rather than outcome stagnation alone. These figures exceed the 6% CFR reported from dedicated treatment centers [
6], suggesting that a substantial proportion of Lassa fever deaths may occur outside such facilities. In studies by Oloyede et al. [
3], only 44% of confirmed Lassa fever cases were identified within 7 days of symptom onset, with a median detection delay of 8 days; these prolonged delays were significantly associated with case fatality.
ITSA indicated that the reduction in confirmed cases during the 2020 COVID-19 lockdown period was most consistent with surveillance disruption. This was reflected in a significant immediate level shift of −7.4 confirmed cases per week (
p=0.031). The concurrent reduction in LCR by 3.8 percentage points (
p=0.009), without an equivalent decrease in suspected-case reporting, provided an important internal control. This pattern suggests that laboratory-confirmed case detection decreased substantially even as healthcare providers continued to identify and report patients with symptoms compatible with Lassa fever. However, reduced healthcare-seeking behavior during lockdown remains a plausible alternative mechanism that this study design cannot exclude. This phenomenon is consistent with findings by Bonwitt [
21], who observed comparable collateral under-detection of Lassa fever during the Ebola outbreak, highlighting a recurring structural vulnerability when diagnostic capacity is redirected towards a single-disease emergency.
The correlations between confirmed Lassa fever cases and temperature (r
s=+0.462;
p<0.0001) and rainfall (r
s=−0.589;
p<0.0001) were ecologically consistent with the known eco-epidemiology of
M. natalensis and persisted in the negative binomial model. A 14% increase in expected confirmed cases per 1 °C increase in temperature (IRR, 1.14; 95% CI, 1.09–1.19) corresponds, across the observed 10 °C seasonal range, to an approximately 2.7-fold difference in expected case burden. The 8-week lagged rainfall signal provides 6–8 weeks of advance indication before the peak season, potentially enabling State Disease Surveillance and Notification Officers to pre-position diagnostics and ribavirin [
22]. These are ecological associations derived from national-centroid climate data; causality cannot be inferred from this study design, and national-centroid data cannot capture local microclimatic conditions in hyperendemic communities such as those in Edo State.
Strengths
To our knowledge, this is the longest continuous weekly national-level Lassa fever surveillance analysis published to date, spanning 307 weeks across multiple epidemic seasons, a major pandemic disruption, and sustained year-on-year surveillance-system evolution.
Limitations
The most consequential limitation is the reliance on national aggregate counts, which creates a substantial risk of ecological fallacy. No causal inference can be drawn from this ecological design. The declining LCR cannot be unambiguously attributed to under-ascertainment without ruling out expanded case-definition criteria or increased passive screening. No Nigerian-specific seroprevalence calibration dataset currently exists. NASA POWER data derived from the national centroid cannot capture microclimatic conditions in hyperendemic communities, a limitation that particularly affects the precision of climate–disease associations. Nigeria’s Lassa fever burden is highly spatially concentrated; Edo State alone accounted for 71% of confirmed cases in the 2011–2024 Irrua series [
23], indicating that national aggregate analyses may obscure important subnational heterogeneity.
Future Directions
Priority extensions include (1) spatial downscaling using PDF-embedded state-level data extracted from the NCDC SitRep archive; (2) prospective validation of the climate-based early-warning model against 2026 Lassa fever season data; (3 development of a long short-term memory or XGBoost nowcasting framework; (4) survivor cohort follow-up studies to quantify the chronic sequelae burden [
24]; and (5) genomic integration using LASV lineage-assignment tools, such as CLASV [
25], to link lineage-specific outbreak clusters to the climatic and temporal signatures identified in this study.